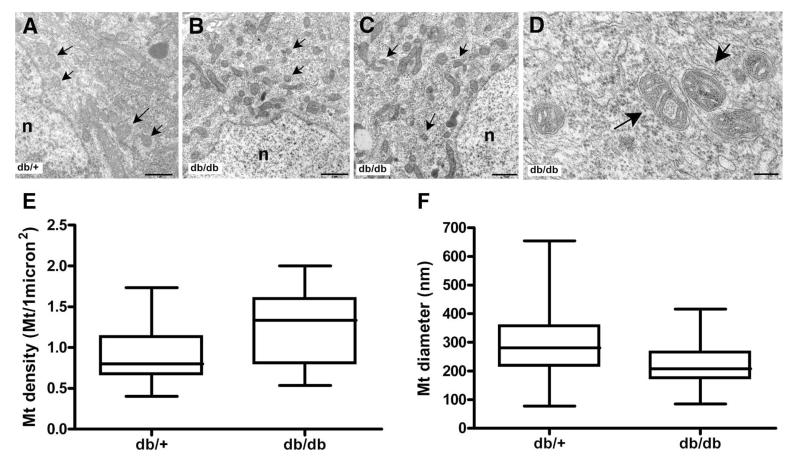
Fig. 4. Hyperglycemia leads to altered mitochondria dynamics and morphology in DRG neurons in vivo.
Transmision electron micrographs of Mt from control (A) and diabetic neurons (B, C and D). Arrows indicate mitochondria. (D) Mitochondria from DRG neuron from diabetic (db/db) mice show slightly dilated intracristal space while the matrix is still dense. n, nucleus. Scale bar: A, B and C = 1 μm; D = 180 nm. (E) Quantitative analysis of mitochondria in DRG neurons from 24 wk old mice showed an increase in the number of Mt in the diabetic (db/db) compared to control (db/+) mice; p < 0.0001. (F) Mitochondria from diabetic (db/db) mice showed reduced diameters compared to control (db/+); p < 0.0001. n=2

