

Abstract
Epilepsy is a common neurologic disorder yet no treatments aimed at preventing epilepsy have been developed. Several molecules including genes containing cAMP response elements (CREs) in their promoters have been identified that contribute to the development of epilepsy, a process called epileptogenesis. When phosphorylated cAMP response element binding protein (CREB) increases transcription from CRE regulated promoters. CREB phosphorylation is increased in rodent epilepsy models, and in the seizure onset region of humans with medically intractable epilepsy (Rakhade, et al., 2005, Lee, et al., 2007, Lund, et al., 2008). Here we show that mice with decreased CREB levels (CREB αΔ mutants) have a ~50% reduction in spontaneous seizures following pilocarpine induced status epilepticus (SE) and require more stimulation to electrically kindle. Following SE, brain derived neurotrophic factor (BDNF) and inducible cAMP early repressor (ICER) mRNAs are differentially up-regulated in the hippocampus and cortex of the CREB αΔ mutants compared to wild-type mice, which may be contributing to differences in the severity of epilepsy. In contrast, we found no difference in KCC2 mRNA levels between the CREB αΔ and wild-type mice after SE. The mechanism by which BDNF and ICER mRNAs increase specifically in the CREB αΔ compared to wild-type mice following SE is not known. We did, however, find an increase in specific cAMP response element modulator (CREM) mRNA transcripts in the CREB αΔ mutants that might be responsible for the differential regulation of BDNF and ICER after SE. Altering CREB activity following a neurologic insult provides a therapeutic strategy for modifying epileptogenesis.
Keywords: epilepsy, cyclic amp response element binding protein (CREB), cAMP response element modulator (CREM), inducible cAMP early repressor (ICER), pilocarpine, kindling
Introduction
Approximately 1% of the population develop epilepsy with ~ 30% of patients being refractory to currently available medications (ILAE,1997). To date, none of the anti-epileptic drugs tested block the development of epilepsy or reverse epileptogenesis (Temkin, 2009). Changes in gene expression have been identified in the chemoconvulsant or kindling rodent epilepsy models that might contribute to epileptogenesis (Pitkanen, et al., 2007). A better understanding of the gene regulation contributing to epilepotgenesis will hopefully provide new therapeutic strategies focused on blocking epileptogenesis or reversing the epileptic process.
The CRE transcription factor family is composed of multiple members, which share the ability to bind a highly conserved DNA 8-mer (TGACGTCA), a CRE site, found in greater than 4,000 gene promoter regions (Zhang, et al., 2005). Among the CRE binding proteins CREB and CREM/ICER are the best characterized in the brain. Binding of CREB primarily promotes transcription and is important for controlling activity-dependant processes in neurons such as memory (Lonze and Ginty, 2002). CREM can either inhibit or promote transcription depending on the exons utilized in the CREM transcript. In contrast, ICER, an isoform of CREM with a unique promoter, suppresses transcription and some forms of memory (Borlikova and Endo, 2009). Following an episode of SE there is an immediate increase in the active phosphorylated form of CREB and a later sustained increase in ICER, possibly due to increased CREB activity at the CRE sites in the ICER promoter (Lee, et al., 2007, Lund, et al., 2008, Porter, et al., 2008). Thus, there is a theoretical cascade of initial CRE transcription promotion followed by CRE transcription inhibition, creating a potential feedback loop. In humans with medically intractable epilepsy there is an increase in phosphorylated CREB and gene expression changes consistent with increased CREB regulated transcription in the seizure onset zone (Rakhade, et al., 2005). Activation of CREB and downstream genes appears to be part of both human and rodent epilepsy models.
CRE transcription appears to not only be activated by seizures but can also regulate epileptogenesis. Prolonged CREB activity in the cortex achieved via viral expression of a constituently active CREB caused development of spontaneous seizures (Lopez de Armentia, et al., 2007). Transgenic knockout mice, lacking CREM and ICER develop more severe epilepsy, experiencing 3-fold more seizures following pilocarpine induced SE than wild-type littermates (Porter, et al., 2008). Over expression of ICER in transgenic animals slows the development of seizures induced with electrical stimulation (Kojima, et al., 2008). We hypothesized that CREB αΔ transgenic mice, which express ~10% of wild-type CREB levels (Blendy, et al.,1996), would have suppressed epileptogenesis. These mice have been extensively studied previously and no obvious brain structural abnormalities have been identified. They do have a baseline increase in dentate gyrus neurogenesis and altered molecular responses to antidepressants, lacking an increase in BDNF (Conti, et al., 2002, Gur, et al., 2007). Using the pilocarpine chemoconvulsant SE model and amygdala electrical kindling we investigated the role of CREB in epileptogenesis.
Material and Methods
Animals
CREB αΔ mutant mice and wild-type littermates were bred and maintained in an F1 hybrid background (129SvEvTac/C57BL/6) as described previously (Walters and Blendy, 2001). The animals used in this study were obtained by crossing heterozygote CREB αΔ 129SvEvTac (N12) to heterozygote CREB αΔ C57BL/6 (N10) and are congenic, differing only in their expression of the CREB gene. All mice used in the study were 2-4 months of age at the onset of the study, were group housed with food and water available ad libitum, in an animal care facility on a 12 hour light/dark cycle (lights on at 7:00 A.M.). Studies were performed in accordance with the University of Pennsylvania Animal Care and Use Committee.
Surgery
Mice were anaesthetized with isoflurane and placed in a stereotaxic frame for hippocampus and amygdala depth electrode placement. A bipolar twist electrode was placed in the left hippocampus (Coordinates: A/P -2.2; M/L -2.0; D/V 1.9) for continuous EEG monitoring. For the kindling model a stimulation-recording bipolar electrode was stereotaxically implanted into the left amygdala (Coordinates: A/P -1.2; M/L -2.9; D/V 4.6). In addition to the hippocampal or amygdala electrodes, four cortical screws with two in front of bregma for bilateral cortex recording, and two behind lambda for ground and reference. Electrodes connected with a plastic cap and kept in place with dental cement. Animals were allowed to recover for at least one week prior to kindling or pilocarpine induced SE.
Pilocarpine induction of SE
Male F1 hybrids (CREB αΔ mutant mice and wild-type littermates) between 2 to 4 months of age underwent an intraperitoneal injection of 1mg/kg methyl-scopolamine (Sigma, St Louis MO) followed 30 minutes later by 7.5mg of pilocarpine HCL IP. The wild-type average dose was 299 ± 54 mg/kg (± standard deviation) and the CREBαΔ mice 239 ± 35 mg/kg (± standard deviation) per animal for all animals undergoing long term VEEG monitoring. Animals were continuously video EEG monitored for 24 hours prior to pilocarpine injection until >54 days following the injection.
Kindling
The electrographic seizure threshold was determined by application of 1 sec train of 1 msec biphasic rectangular pulses at 60Hz beginning at 60 μA; additional stimulations increasing by 20 μA were administered at 1min intervals until an electrographic seizure lasting at least 5 sec was detected on the EEG recorded from the amygdala. Subsequently, experimental animals were stimulated twice each day at a stimulus intensity of 100 μA above the seizure threshold, with a stimulation interval of at least four hours until three consecutive seizures of class 5 with four limb clonus and/or full body tonic stiffening lasting at least 12 seconds were evoked. The behavioral manifestations of seizures were classified according to Racine’s classification (Racine,1972). Kindling scoring was performed with the rater blinded to the genotype of the animals.
Quantitative PCR
RNA was extracted from whole cortex and hippocampus using the PARIS Kit (Ambion Inc, Austin TX). To synthesize complementary DNA (cDNA), 300ng of RNA per sample was reverse transcribed with SuperScript II reverse transcription kit (Invitrogen, Carlsbad, CA) according to the manufacture’s directions. Concentrations of RNA and cDNA were measured using a spectrophotometer (ND 1000, Thermo Fischer Scientific Inc, Wilmington, DE). Reactions were carried out in 384-well plates with 5 μl of the Taqman Universal PCR Master Mix (Applied Biosystems, Foster City, CA), 0.5 μl of the probe/primer mix for either the gene of interest; BDNF Mm00432069_m1 (exon III older nomenclature (Timmusk, et al.,1993) or exon IV new nomenclature (Aid, et al., 2007), KCC-2-Mm00803929_m1 (covering exon 21-22 boundary), CREM Mm01230944_g1 (p-box domain), CREM Mm01230943_m1 (containing Q1 domain), CREM Mm00516343_m1 (lack Q1 domain), CREM Mm01230945_m1 (containing Q2 domain), CREM -Mm00516346_m1 (lack Q2 domain), ICER-forward: ATGGCTGTAACTGGAGATGAAACT; Reverse: GTAGGAGCTCGGATCTGGTAAGT; or PPIA (cyclophilin) (Rn00690933_m1), 2.5ul of ddH2O, and 1μl of sample DNA per well. Approximately 1000ηg of sample cDNA were added to each well. Each sample was run in two sets of triplicates, one set with the probe for the gene of interest and one for PPIA (cyclophilin). There was no difference in PPIA mRNA levels between genotypes or treatment groups. A standard curve for each probe was included on each plate using cDNA from the cortex of a wild-type mouse. Real-time PCR assays were carried out on a SDS 7900HT model thermocycler (Applied Biosystems). The real-time PCR settings were 50°C for 2 mins, 95°C for 10 mins, and then 40 cycles of 95°C for 1 min and 60°C for 1 minute.
Western blot
Western blots were performed with modifications of published protocols (Porter et al., 2008). The hippocampus and cortex were removed and frozen on dry ice. To the protein (75μg) extracted from cortex and hippocampus 2μl of β-mercaptoethanol and 3μl 100mM DTT were added and boiled for 10 min. Each sample was loaded into 12-14% SDS-polyacrylamide gels and run for 1.5 hours at 110V. Blots were then transferred to nitrocellulose membranes and blocked in 2% milk/tris-buffered saline with Tween-20 (TBS-T). Membranes were then incubated with anti-CREM-1 (x-12) (1:1000; Santa Cruz, Santa Cruz, CA) and anti-BDNF (1:2000; Millipore, Billerica, MA) overnight respectively at 4°C in 1.5% milk in TBS-T followed by horseradish peroxidase-conjugated goat anti-rabbit secondary antibodies (1:5000; GE healthcare UK limited) for 2 hours at room temperature. The immunoblots were developed with enhanced chemiluminescence (ECL; Pierce, Rockford, IL). Pro-BDNF ~30kd, BDNF ~14kd, ICER ~14kd, CREM-1~45kd, CREM-2 ~40kd were quantified. After developing, membranes were stripped and reprobed for β-actin (1:10,000, Sigma) in 5% milk/TBS-T. All values were normalized to β-actin. Densitometry was performed with NIH Image Version 1.63.
Analysis of SE: Behavior and EEG
All analysis were carried out by observers blinded to the genotype of the animal with the Stellate Harmonie video EEG recording system (Stellate Systems Inc, Montreal, Canada). After injection of pilocarpine, electroencephalographic seizures were differentiated from background noise by the appearance of large-amplitude, high frequency activity, with progression of the spike frequency. The behavioral data captured by the synchronized video recording system were used to confirm EEG seizure activity and during SE all behavioral seizures lasted ≥ 40 seconds. To analyze the EEG spikes during the SE episode, an automated spike detector was developed using MATLAB (Natick, MA). A Butterworth filter was used to band-pass the data from 1Hz to 55Hz and spikes were detected based on zero crossings and an amplitude threshold set at 30 % of the maximum EEG amplitude if it was less than 5000 μV, or 1500 μV if the maximum EEG amplitude exceeded 5000 μV. To validate the spike detector for both genotypes, hippocampus and cortex, random 30 seconds of EEG following the pilocarpine injection were marked independently by a genotype blinded reviewer. The MATLAB program had equivalent sensitivity and specificity for spike detection between genotypes (Supplementary Table 1). The spike detector was used to measure the total spikes and average spike amplitude in the 24-hour EEG segment following pilocarpine injection. The spike count data of cortex and hippocampus were averaged separately across each genotype to obtain the mean and SEM.
Analysis of spontaneous seizures: behavior and EEG
All animals were continuously video EEG (VEEG) monitored following the SE episode until >54 days (Average 61 days wild-type, and 63 days CREB αΔ) following the pilocarpine injection. The EEG was reviewed by an observer blinded to genotype for spontaneous seizure activity and correlation with the video portion of the recording. The EEG was screened for sudden change in the background brain wave patterns, with repetitive, evolving waveforms with a definite beginning, middle, and end. The video was screened to ensure that EEG changes were not secondary to grooming or feeding behaviors. EEG analysis of the spontaneous seizure included calculating the latency to onset of first spontaneous seizure, average duration of each seizure and frequency of the spontaneous seizures.
Statistical analysis
A two-tailed t-test was performed to compare WT and CREB αΔ mice for each measurement of SE. Latency, frequency and duration of the spontaneous seizure analysis, was carried out using a two-tailed t-test. ANOVA with a Tukey’s multiple comparisons test was used for the real-time PCR analysis. All statistics were carried out using Prism 4.0 software (GraphPad, La Jolla, CA).
Results
All of the CREB αΔ and wild-type mice developed spontaneous seizures following pilocarpine induced SE. The wild-type mice had their first spontaneous seizure on average 49.8 ± 8.0 and the CREB αΔ 62.75± 17.53 hours after pilocarpine injection (Figure 1A). While there was a trend in the CREB αΔ mice toward delayed spontaneous seizure onset it was not statistically significant. Continuous video EEG recording for all the mice was carried out for >54 days (Average: wild-type 61 days, CREB αΔ 63 days). CREB αΔ mice had a ~50% reduction in spontaneous seizures (0.033 ± 0.003 seizures/per hour) compared to their wild-type littermates (0.062 ± 0.011 seizures/per hour *P<0.05) (Figure 1B). Spontaneous seizures were similar, electrographically and behaviorally in the wild-type and CREBαΔ mice. EEG seizure duration was equivalent between genotypes; the wild-type mice seizures on average were 42.93 ± 2.65 seconds and CREB αΔ 47.36 ± 4.43 seconds (Figure 1C). A representative electrographic seizure from a wild-type mouse is shown in Figure 1D. All electrographic seizures detected had behavioral correlates, and were stage IV or V on the Racine scale with bilateral four-limb clonus and most with loss of postural control. While number of spontaneous seizures per day fluctuated over the duration of the study there was not an escalation in spontaneous seizures over time following SE (Figure 1E).
Figure 1.

CREBαΔ mice developed fewer spontaneous seizures following pilocarpine induced SE. (A) The time to onset of spontaneous seizures was similar in the wild-type and CREBαΔ mice after pilocarpine induced SE. (B) The spontaneous seizure frequency was reduced in CREBαΔ as compared to wild-type mice. (WT; n=6; CREBαΔ; n=5, T-test, *p<0.05) (C) The duration of spontaneous seizures as assessed by EEG was similar across genotypes. Wild-type and CREBαΔ mice had comparable electrical and behavioral spontaneous seizures. (D) The EEG recording from a representative spontaneous electrographic seizure in a wild-type mouse is shown, Racine stage V behavioral seizure. (E) All mice, WT; n=6; CREBαΔ;n=5, underwent video EEG recording for at least 54 days following pilocarpine induced SE were followed for the development of spontaneous seizures. There was large variability in average spontaneous seizure numbers per day in both the wild-type and CREBαΔ, over the 54 days of recording the average spontaneous seizure frequency did not change in the wild-type or CREBαΔ mice.
Using multiple parameters the episode of SE appeared similar in the wild-type and CREB αΔ mice. The latency to stage V seizure after pilocarpine injection and duration of behavioral SE was similar in the wild-type and CREB αΔ mice as measured by a genotype blinded video reader (Figure2 A,B). Similar numbers of wild type (eight of fourteen) and CREB αΔ mice (four of nine) mice died during the episode of SE. The EEG during SE was analyzed using spike detection software that was validated on random sections of EEG following pilocarpine induced SE from the CREB αΔ and wild-type mice (Supplemental Table 1). The total number of spikes were counted by the automated spike detection software over 24 hours, average spike amplitude and the temporal spiking pattern following SE was similar for the wild-type and CREB αΔ mice (Figure 2C,D and data not shown). Duration of behavioral SE, or time to onset of SE did not appear to influence frequency of spontaneous seizures in the wild-type or CREB αΔ mice (Figure 2E,F) A sample of the EEG recording shows the dramatic change in EEG following the injection of the pilocarpine-HCL (Figure 2G).
Figure 2.

Pilocarpine induced SE was similar in the CREBαΔ and wild-type mice. (A, B) Average time to onset of SE and electrographic SE duration did not differ in the wild-type and CREBαΔ mice (wild-type; n=6; CREBαΔ; n=5). (C,D) No difference in total spike per animal and spike amplitude was found during the 24 hours following the pilocarpine injection between the CREBαΔ and wild-type mice. All data are presented as mean ± SEM. (One way ANOVA, wild-type; n=6; CREBαΔ; n=5). (E) The duration of behavioral SE did not correlate with spontaneous seizure frequency in either the wild-type or CREBαΔ mice. (F) The latency to onset of SE following pilocarpine injections did not correlate with spontaneous seizure frequency in either the wild-type or CREBαΔ mice. (G) Typical EEG recording of the baseline and SE in cortex and hippocampus of a wild-type mouse.
To determine if the differences we found in epilepsy following pilocarpine SE was model specific we carried out amygdala kindling in wild-type and CREB αΔ mice. The amount of initial current required to kindle the wild-type (0.12 ± 0.01mA) was similar to the CREB αΔ mice (0.10 ± 0.01mA) (Supplemental Figure 1A). Both sets of animals developed more severe behavioral and electrographic seizures over time (Supplemental Figure 1B,C). With increased amygdala stimulations both the wild-type and CREB αΔ mice experienced longer electrographic after discharges. CREB αΔ mice had a delayed rate of seizure progression during amygdala kindling compared to the wild-type mice (Figure 3A, B).
Figure 3.
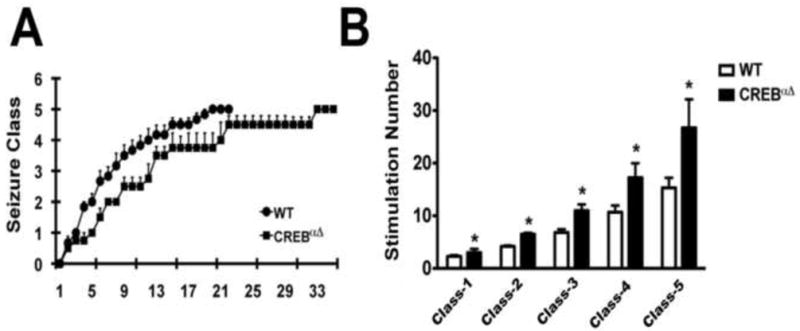
More amygdala electrical stimulations were required to fully kindle (stage V) CREBαΔ mice as compared to wild-type mice. (A) Kindling development is presented as behavioral seizure classification. Stimulation number (X axis) refers to the number of stimulations required to evoke an electrographic seizure with duration of at least 5 sec. (B) Number of stimulations required to reach different seizure classes in wild-type and CREBαΔ mice. (Two way ANOVA, *p<0.01; wild-type; n=6; CREBαΔ; n=4)
To begin to understand the molecular mechanism contributing to the difference in epilepsy severity between the wild-type and CREB αΔ mice we explored differences in gene expression across genotypes. We measured expression of three mRNA’s from putative CRE regulated genes at baseline and after SE. All the genes had previously been implicated in epileptogenesis; BDNF, ICER, and K+ Cl- cotransporter (KCC2).
BDNF exon IV containing mRNAs, are activity dependent and regulated via CRE sites in the promoter region (Timmusk, et al.,1993, Aid, et al., 2007). We found no baseline differences in BDNF exon IV expression between the wild-type and the CREB αΔ mice, however, six hours after SE there was a greater increase in BDNF exon IV mRNA levels in the CREB αΔ compared to wild-type mice in both hippocampus and cortex (Figure 4A, B). However by 48 hours after SE BDNF exon IV mRNA in the hippocampus was actually lower in the CREB αΔ as compared to wild-type mice (Figure 5A, B). Western blot analysis showed an increase in proBDNF immunostaining and a trend toward an increase in mature BDNF immunostaining in the CREBαΔ mice compared to the wild-type mice 48 hours after SE (Figure 6A, B).
Figure 4.

BDNF mRNA increased in the hippocampus and cortex of CREBαΔ mice compared with wild-type mice six hours after pilocarpine induced SE. (A) At baseline wild-type mice and CREBαΔ mice have similar levels of BDNF exon IV containing mRNA in the hippocampus; six hours after SE there was an increase in BDNF exon IV mRNA in the CREBαΔ compared with wild-type mice. (B) At baseline wild-type mice and CREBαΔ mice had similar levels of BDNF exon IV mRNA in the cortex; six hours after pilocarpine induced SE there was an increase in BDNF exon IV mRNA in the CREBαΔ mice compared with wild-type mice (n=5-6 per group, one-way ANOVA * P<0.05, **P<0.01, Tukey’s Multiple Comparison Test).
Figure 5.

By 48 hours after SE there was a decrease in BDNF exon IV mRNA in the hippocampus of the CREBαΔ compared with wild-type mice. (A) Quantification of the decrease in BDNF exon IV mRNA in the hippocampus of the CREBαΔ compared with wild-type mice. (n=5 per group, t-test * P<0.05) (B) Forty-eight hours after SE there was no difference in BDNF exon IV mRNA in the cortex of wild-type and CREBαΔ mice. (n=5 per group)
Figure 6.

Pro-BDNF immunostaining by Western blot of the hippocampus is increased 48 hours after SE in the CREBαΔ mice compared to wild-type mice. (A) Quantification of the increase in Pro-BDNF immunostaining by Western blot on the left and sample lanes on the right with β-actin loading controls for those lanes. (n=4 per group, t-test * P<0.05) (B) Quantification of the BDNF immunostaining by Western blot on the left and sample lanes on the right with β-actin loading controls for those lanes. (n=4 per group)
ICER mRNA, a short RNA transcript of the CREM gene with its own promoter has four potential CRE binding sites in its promoter region that may regulate its expression in an activity-dependant manner (Molina, et al.,1993, Krueger, et al.,1999). At baseline there was no difference in ICER mRNA levels between the wild-type and CREBαΔ mice in the hippocampus and cortex. Six hours after SE, ICER was increased in hippocampus and cortex of the CREB αΔ compared to wild-type mice (Figure 7A, B). As reported previously following SE in both mice and rats, (Lee, et al., 2007, Lund, et al., 2008, Porter, et al., 2008), the wild-type mice had a trend toward increased ICER mRNA in the hippocampus (wild-type control 1 ± 0.208 std dev, wild-type seizure 4.0 ±1.518 std dev) and cortex (wild-type control 1± 0.205 std dev and wild-type seizure 2.1 ± 0.507 std dev) though using a one way ANOVA the difference did not meet statistical significance. By 48 hours after SE there no longer was a difference in ICER mRNA levels between the CREB αΔ and wild-type mice (Figure 8A, B). Western blot immunostaining showed an increase in ICER in the CREBαΔ mice compared to the wild-type mice at 48 hours after SE (Figure 9).
Figure 7.

ICER mRNA increased in the hippocampus and cortex of CREBαΔ mice compared with wild-type mice six hours after pilocarpine induced SE. (A) At baseline wild-type and CREBαΔ mice have similar levels of ICER mRNA in the hippocampus; six hours after SE there was an increase in ICER mRNA in the CREBαΔ compared with wild-type mice. (B) At baseline wild-type mice and CREBαΔ mice have similar levels of ICER mRNA in the cortex; six hours after pilocarpine induced SE there was a greater increase in ICER mRNA in the CREBαΔ than the wild-type mice (n=5-6 per group, one-way ANOVA * P<0.05, **P<0.01, Tukey’s Multiple Comparison Test).
Figure 8.

By 48 hours after SE there was no difference in ICER mRNA levels in the (A) hippocampus or (B) cortex between the CREBαΔ and wild-type mice. (n=5 per group, t-test * P<0.05)
Figure 9.

ICER immunostaining by Western blot of the hippocampus is increased 48 hours after SE in the CREBαΔ mice compared to wild-type mice. Quantification of the increase in ICER immunostaining by Western blot on the left and sample lanes on the right with β-actin loading controls for those lanes. (n=4 per group, t-test * P<0.05)
At baseline KCC2 mRNA levels were similar in cortex and hippocampus of the wild-type and CREB αΔ mice. In contrast, to the genotype specific changes in BDNF exon IV and ICER mRNAs following SE, KCC2’s (SLC12A5) mRNA levels increased in the cortex of both the wild-type and the CREB αΔ mice and in wild-type hippocampus. There was also an upward trend in KCC2 mRNA in the hippocampus of the CREB αΔ mice following SE but it did not reach statistical significance (Figure 10 A,B).
Figure 10.

KCC2 mRNA is increased in the hippocampus (A) and cortex (B) of wild-type mice six hours after pilocarpine induced SE. (A) There was a trend toward an increase in KCC2 mRNA six hours after SE in the hippocampus of the CREBαΔ mice. (B) KCC2 mRNA increased in the cortex of CREBαΔ mice six hours after SE. Genotype had no effect on KCC2 expression; no difference in KCC2 mRNA levels between the wild-type mice and the CREBαΔ mice was detected at baseline or six hours after SE. (n=5-6 per group, one-way ANOVA * P<0.05, Tukey’s Multiple Comparison Test).
Surprisingly, two of the three putative CRE regulated genes increased immediately following SE to a greater extent in the CREB αΔ than wild-type mice, suggesting another CRE transcription factor might be responsible for the immediate robust increase in BDNF exon IV and ICER mRNA in the CREB αΔ mice following SE. Several CREM mRNA bands of different sizes were increased in CREB αΔ mice in a prior study (Hummler, et al.,1994). At baseline we found an increase in some, but not all, of the CREM mRNA splice variants in the CREB αΔ mice. CREM mRNA’s containing the P-box, Q1 and Q2 (putative activators of CRE transcription) domains and transcripts lacking Q1 were all increased in hippocampus and cortex of the CREB αΔ mice (Figure 11 B-E and Figure 12 B-E). At baseline CREM mRNA’s lacking the Q2 domain and ICER did not show a difference between the wild-type and CREB αΔ mice. Six hours following SE, all the CREM mRNA splice variants we measured increased in the CREB αΔ mice as compared to wild-type litter mates in both hippocampus and cortex (Figure 11A-E and supplement Figure 12A-E). Western blot immunostaining identified two bands of the correct molecular weight for CREM; one bands intensity increased in the CREBαΔ mice at 48 hours after SE compared to the wild-type mice. The other immunoreactive band appeared to increase in the CREBαΔ compared to the wild-type mice but it did not meet statistical significance (Figure 13 A, B).
Figure 11.

At baseline there is an increase in four of five CREM mRNA splice forms measured in the hippocampus of the CREBαΔ compared to the wild-type mice. There are seizure induced increases in all CREM mRNA splice forms in the hippocampus in the CREBαΔ compared to wild-type mice. (A) At baseline, wild-type and CREBαΔ mice had similar levels of CREM mRNA lacking Q2 in the hippocampus. CREM mRNA lacking the Q2 domain was increased in the hippocampus of CREBαΔ compared with wild-type mice six hours after pilocarpine induced SE. (B) At baseline, CREM P box containing mRNA was increased in the hippocampus of CREBαΔ compared with wild-type mice. Six hours after pilocarpine induced SE there was an increase in CREM P box containing mRNAs in the hippocampus of CREBαΔ compared to the wild-type mice. (C) At baseline, CREM Q1 containing mRNAs were increased in the hippocampus of CREBαΔ compared with wild-type mice. Six hours after pilocarpine induced SE there was an increase in CREM Q1 containing mRNAs in the hippocampus of CREBαΔ compared to the wild-type mice. (D) At baseline, CREM Q2 containing mRNAs were increased in the hippocampus of CREBαΔ compared with wild-type mice. Six hours after pilocarpine induced SE there was an increase in CREM Q2 containing mRNAs in the hippocampus of CREBαΔ mice compared to the wild-type mice. (E) At baseline, CREM mRNAs lacking Q1 were increased in the hippocampus of CREBαΔ compared with wild-type mice. Six hours after pilocarpine induced SE there was an increase in CREM mRNAs lacking Q1 in the hippocampus of CREBαΔ compared to the wild-type mice. (n=5-6 per group, one-way ANOVA * P<0.05, **P<0.01, ***P<0.001, Tukey’s Multiple Comparison Test).
Figure 12.

At baseline there is an increase in four of five CREM mRNA splice forms measured in the cortex of the CREBαΔ compared to the wild-type mice. There are seizure induced increases in all CREM mRNA splice forms in the cortex in the CREBαΔ compared to wild-type mice. (A) At baseline, wild-type and CREBαΔ mice had similar levels of CREM mRNA lacking Q2. CREM mRNA lacking the Q2 domain was increased in the cortex of CREBαΔ compared with wild-type mice six hours after pilocarpine induced SE. (B) At baseline, CREM P box containing mRNA was increased in the cortex of CREBαΔ compared with wild-type mice. Six hours after pilocarpine induced SE there was an increase in CREM P box containing mRNAs in the cortex of CREBαΔ compared to the wild-type mice. (C) At baseline, CREM Q1 containing mRNAs were increased in the cortex of CREBαΔ compared with wild-type mice. Six hours after pilocarpine induced SE there was an increase in CREM Q1 containing mRNAs in the cortex of CREBαΔ compared to the wild-type mice. (D) At baseline, CREM Q2 containing mRNAs were increased in the cortex of CREBαΔ compared with wild-type mice. Six hours after pilocarpine induced SE there was an increase in CREM Q2 containing mRNAs in the cortex of CREBαΔ mice compared to the wild-type mice. (E) At baseline, CREM mRNAs lacking Q1 were increased in the cortex of CREBαΔ compared with wild-type mice. Six hours after pilocarpine induced SE there was an increase in CREM mRNAs lacking Q1 in the cortex of CREBαΔ compared to the wild-type mice. (n=5-6 per group, one-way ANOVA * P<0.05, **P<0.01, ***P<0.001, Tukey’s Multiple Comparison Test).
Figure 13.

CREM immunostaining by Western blot of the hippocampus is increased 48 hours after SE in the CREBαΔ mice compared to wild-type mice. (A) Quantification of the increase in CREM-1 immunostaining by Western blot on the left and sample lanes on the right with β-actin loading controls for those lanes. (n=4 per group, t-test * P<0.05) (B) Quantification of the CREM-2 immunostaining by Western blot on the left and sample lanes on the right with β-actin loading controls for those lanes. (n=4 per group)
Discussion
CREB αΔ mutants have milder epilepsy using both the pilocarpine SE and amygdala kindling models. While we predicted a decrease in CRE regulated genes in the CREB αΔ mice following SE, instead we found an early increase in BDNF and ICER mRNA and protein in the CREB αΔ compared to the wild-type mice. There was an increase in some CREM mRNA splice variants in the CREB αΔ mutants at baseline, which might explain the early increase in BDNF and ICER mRNAs in the CREB αΔ mice following SE. Following SE all the CREM mRNA splice variants we measured including ICER increased in the CREB αΔ mutants compared to the wild-type mice. This correlated with an increase in several CREM immunoreactive bands at 48 hours following SE in the CREB αΔ mutants compared to wild-type mice following SE. As ICER is a potent inhibitor of CRE transcription and increases following SE in the CREB αΔ mice, it may be responsible for the later decrease in BDNF mRNA, 48 hours after SE.
Altered CRE transcription appears to influence epileptogenesis with continuous expression of a dominant active form of CREB in the frontal-cortex resulting in the development of spontaneous seizures (Lopez de Armentia, et al., 2007). The current study finds that mice with ~10% of wild-type CREB levels, CREB αΔ mutants, have fewer spontaneous seizures following SE and require more electrical stimulations to fully kindle. Our data suggests that CRE transcription is involved in the development of epilepsy therefore, therapeutic strategies which suppress CREB activity may be useful for decreasing the severity of epilepsy.
We hypothesized that decreased CREB would repress CRE transcription after SE and this would be a putative mechanism for differences in epileptogenesis. However, when we measured CRE regulated transcripts in the CREB αΔ mutants following SE there was an increase at 6 hours in two putative CRE regulated transcripts BDNF and ICER, and an increase in proBDNF and ICER immunoreactivity on Western Blots at 48 hours. There was, however, an eventual decrease in BDNF mRNA 48 hours after SE in the hippocampus of the CREB αΔ mice. Decreased CREB levels following SE did not alter all CRE activity regulated genes as there was no difference following SE of KCC2 (SLC12a5) mRNA levels between wild-type and CREB αΔ mice (Rivera, C., et al., 2004). Suggesting the relationship between decreased CREB levels and CRE regulated transcription following SE is time dependent and gene specific.
We suspect that the increase in a subset of the CREM mRNA isoforms in the CREB αΔ mutants may be responsible for the lack of baseline difference in BDNF, KCC2 and ICER mRNAs between the CREB αΔ mutants and wild-type mice. The increase in a subset of CREM isoforms could also be responsible for the greater increase in exon IV containing BDNF and ICER mRNA immediately following SE in the CREB αΔ mutants. CREM can either inhibit or promote transcription depending on which exons have been spliced into the CREM transcript. CREMα, which lacks the Q2 domain, inhibits transcription, the addition of the Q2 domain, CREMτ2α, converts CREM to a transcription promoter similar to CREB (Walker, et al.,1994, Groussin, et al., 2000). The CREBαΔ mutants compared to the wild-type mice at baseline have an increase in CREM transcripts containing the Q2 region, a promoter of transcription. CREM transcripts lacking Q2, suppress transcription, and are not increased in the CREBαΔ mutants. Overall, CREM transcripts containing elements thought to promote CRE transcription, P-box containing elements, the Q1 and Q2 glutamine rich domains are increased at baseline in the CREB αΔ mutants. Of the CREM transcripts likely to suppress CRE transcription, lacking Q1 or Q2 domains and ICER a known suppressor, two of the three were not increased in the CREB αΔ mice at baseline. In the CREB αΔ mice, at baseline there was a specific increase in CREM isoforms promoting CRE transcription, suggesting the brain has a feedback mechanism for maintaining CRE transcription. The mechanism for regulation of CREM splicing is not well understood, however, one study has shown that the RNA binding protein SRp40 regulates splicing of CREM’s Q2 exon in smooth muscle (Tyson-Capper, et al., 2005). Our data suggests a similar splicing regulation of the CREM Q2 exon can occur in the brain and there is a feedback mechanism for decreased CREB levels to up-regulate and alternatively splice CREM.
Decreased CREB levels have also been shown to increase CRE mediated transcription; a prior study has suggested that phospho-CREB via its dimerization with ICER can suppress transcription of a gamma aminobutyric acid α1 receptor subunit following SE (Lund, et al., 2009). Lower CREB levels in the CREB αΔ mice might have less transcriptional repression following SE due to fewer CREB dimers formed with ICER or CREM, inhibitors of CRE transcription.
In wild-type mice SE appears to specifically increase ICER expression, with no increase in the hippocampus or cortex of the five other CREM splice variants we studied. (Figure 5A; Supplemental Figure 2C,D; Figure 6A-E; Supplemental Figure 4A-E). Our data is similar to prior reports of a robust increase in ICER following SE and no or minimal increase in CREM (Lund, et al., 2008, Porter, et al., 2008). Suggesting that the SE induction of the CREM/ICER gene is primarily at the ICER promoter in wild-type mice. In contrast, following SE in the CREB αΔ mice there was a robust increase in ICER mRNA and the four of the five CREM mRNA transcripts studied. CREM transcription appears to be sensitive to SE in the CREB αΔ mice but not in the wild-type mice. Decreased CREB levels increase baseline transcription of CREM and also alter its sensitivity to an acute insult such as SE.
In prior studies both BDNF exon IV, KCC2 (SLC12a5) and ICER genes have been shown to have CRE sites in their promoters and are thought to be subject to activity dependent gene regulation. The increased BDNF and ICER mRNA and protein levels we found following SE, in both the hippocampus and cortex were similar to previous reports of increased expression following SE. Interestingly, decreases in KCC2 (SLC12a5) mRNA and protein following SE or excess neuronal activity in culture have also been attributed to CRE regulated transcription (Rivera, et al. 2004). Our findings of an increase in KCC2 (SLC12a5) mRNA, in hippocampus and cortex following SE in adult animals was unexpected, however it appears we have looked at an earlier time point following SE than prior studies (Pathak, et al., 2007, Li, et al., 2008). Following a stage V kindling induced seizure, however, there was a rapid decrease in KCC2 mRNA and protein in all hippocampal subregions (Rivera, et al. 2002). At six hours after SE, mRNA expression changes in BDNF, ICER, and KCC2 (SLC12a5) were present in both the hippocampus and cortex suggesting it is not brain region specific. We did not determine if the altered expression was cell type specific though prior staining studies have implicated neurons in the altered BDNF, ICER and KCC2 (SLC12a5) expression following SE (Dugich-Djordjevic et al., 1992, Porter et al., 2008, Pathak et al., 2007)
The role of BDNF has been studied extensively in the field of epileptogenesis with some mixed findings but overall increased BDNF signaling is thought to promote epilepsy (Lahteinen, et al., 2002, He, et al., 2004). Over-expression of ICER, primarily a suppressor of CRE transcription, results in slower kindling (Kojima, et al., 2008). Mice that lack the CREM/ICER gene have increased seizure frequency following pilocarpine induced SE (Porter, et al., 2008).
The early increase in ICER and BDNF mRNA and protein in the CREB αΔ mice following SE therefore would have potentially counteracting effects on epileptogenesis. One hypothesis is that at later time points the increase in ICER and CREM isoform lacking Q2 might play a greater inhibitory roll in CRE transcription possibly driving down BDNF as well as other mRNAs to a greater extent in the CREB αΔ mice and suppressing seizures. Alternatively, greater levels of CREM isoforms present at baseline and during SE in the CREB αΔ mice might suppress epilepsy severity through mechanisms unrelated to BDNF. We have clearly shown differences in transcription between the wild-type and CREB αΔ mice following SE; future studies are needed to clarify which differences in transcription are responsible for the difference in epilepsy severity.
In the pilocarpine SE model, the CREB αΔ mice had a lower seizure frequency but both genotypes, CREB αΔ and wild-type developed spontaneous seizures or epilepsy, and the spontaneous seizure duration and semiology appeared similar between the genotypes. The absence of the CREB αΔ isoforms seemed to mitigate the severity of the epilepsy but did not completely prevent the development of epilepsy. We have tried to assess if the episode of SE was similar between the CREB αΔ and wild-type mice by measuring multiple aspects of the episode of pilocarpine induced SE including, time to SE onset, spike amplitude, total spike number and mortality finding no difference. Of course a difference in the SE between the genotypes is possible at a level we could not assess. A reassuring finding was the SE duration and time to SE onset did not appear to influence spontaneous seizure frequency in either the wild-type or the CREB αΔ mice. Similarly the CREB αΔ mice could be kindled but required more stimulations for progression of the seizure severity. Therefore, we conclude that the CREB αΔ mice have suppressed but not absent epileptogenesis.
Understanding gene regulation that contributes to the development of epilepsy will hopefully guide us toward treatment strategies that not only suppress seizures but also prevent or even reverse the development of epilepsy.
Supplementary Material
(A) The level of electrical activity required to produce an electrographic seizure (after discharge) was similar between the CREBαΔ and wild-type mice. (B) There was a trend toward an increase in electrographic seizure duration during the development of kindling in both the wild-type and CREBαΔ hypomorphs but no difference between genotypes. (C) Typical EEG recording of the baseline and fully kindled mice in cortex and hippocampus. Arrow indicates the electrical pulse.
Highlights.
CREBαΔ mice have milder epilepsy, in both pilocarpine and kindling models.
Milder epilepsy in the CREB αΔ mice is not due to suppression of CRE transcription.
BDNF, ICER increased in CREB αΔ more than wild-type mice after status epilepticus.
Increased CREM in CREB αΔ mice may increase BDNF and ICER after status epilepticus.
Acknowledgments
This work was supported by an NINDS grant to BEP NSR01NS056222.
Footnotes
Publisher's Disclaimer: This is a PDF file of an unedited manuscript that has been accepted for publication. As a service to our customers we are providing this early version of the manuscript. The manuscript will undergo copyediting, typesetting, and review of the resulting proof before it is published in its final citable form. Please note that during the production process errors may be discovered which could affect the content, and all legal disclaimers that apply to the journal pertain.
References
- ILAE Commission Report. The epidemiology of the epilepsies: future directions. International League Against Epilepsy. Epilepsia. 1997;38:614–8. [PubMed] [Google Scholar]
- Aid T, Kazantseva A, Piirsoo M, Palm K, Timmusk T. Mouse and rat BDNF gene structure and expression revisited. J Neurosci Res. 2007;85:525–35. doi: 10.1002/jnr.21139. [DOI] [PMC free article] [PubMed] [Google Scholar]
- Blendy JA, Kaestner KH, Schmid W, Gass P, Schutz G. Targeting of the CREB gene leads to up-regulation of a novel CREB mRNA isoform. Embo J. 1996;15:1098–106. [PMC free article] [PubMed] [Google Scholar]
- Borlikova G, Endo S. Inducible cAMP early repressor (ICER) and brain functions. Mol Neurobiol. 2009;40:73–86. doi: 10.1007/s12035-009-8072-1. [DOI] [PMC free article] [PubMed] [Google Scholar]
- Conti AC, Cryan JF, Dalvi A, Lucki I, Blendy JA. cAMP response element-binding protein is essential for the upregulation of brain-derived neurotrophic factor transcription, but not the behavioral or endocrine responses to antidepressant drugs. J Neurosci. 2002;22:3262–68. doi: 10.1523/JNEUROSCI.22-08-03262.2002. [DOI] [PMC free article] [PubMed] [Google Scholar]
- Groussin L, Massias JF, Bertagna X, Bertherat J. Loss of expression of the ubiquitous transcription factor cAMP response element-binding protein (CREB) and compensatory overexpression of the activator CREMtau in the human adrenocortical cancer cell line H295R. J Clin Endocrinol Metab. 2000;85:345–54. doi: 10.1210/jcem.85.1.6307. [DOI] [PubMed] [Google Scholar]
- Gur TL, Conti AC, Holden J, Bechtholt AJ, Hill TE, Lucki I, Malberg JE, Blendy JA. cAMP Response Element-Binding Protein Deficiency Allows for Increased Neurogenesis and a Rapid Onset of Antidepressant Response. J Neurosci. 2007;27:7860–68. doi: 10.1523/JNEUROSCI.2051-07.2007. [DOI] [PMC free article] [PubMed] [Google Scholar]
- He XP, Kotloski R, Nef S, Luikart BW, Parada LF, McNamara JO. Conditional deletion of TrkB but not BDNF prevents epileptogenesis in the kindling model. Neuron. 2004;43:31–42. doi: 10.1016/j.neuron.2004.06.019. [DOI] [PubMed] [Google Scholar]
- Hummler E, Cole TJ, Blendy JA, Ganss R, Aguzzi A, Schmid W, Beermann F, Schutz G. Targeted mutation of the CREB gene: compensation within the CREB/ATF family of transcription factors. Proc Natl Acad Sci U S A. 1994;91:5647–51. doi: 10.1073/pnas.91.12.5647. [DOI] [PMC free article] [PubMed] [Google Scholar]
- Kojima N, Borlikova G, Sakamoto T, Yamada K, Ikeda T, Itohara S, Niki H, Endo S. Inducible cAMP early repressor acts as a negative regulator for kindling epileptogenesis and long-term fear memory. J Neurosci. 2008;28:6459–72. doi: 10.1523/JNEUROSCI.0412-08.2008. [DOI] [PMC free article] [PubMed] [Google Scholar]
- Krueger DA, Mao D, Warner EA, Dowd DR. Functional analysis of the mouse ICER (Inducible cAMP Early Repressor) promoter: evidence for a protein that blocks calcium responsiveness of the CAREs (cAMP autoregulatory elements) Mol Endocrinol. 1999;13:1207–17. doi: 10.1210/mend.13.7.0319. [DOI] [PubMed] [Google Scholar]
- Lahteinen S, Pitkanen A, Saarelainen T, Nissinen J, Koponen E, Castren E. Decreased BDNF signalling in transgenic mice reduces epileptogenesis. Eur J Neurosci. 2002;15:721–34. doi: 10.1046/j.1460-9568.2002.01897.x. [DOI] [PubMed] [Google Scholar]
- Lee B, Dziema H, Lee KH, Choi YS, Obrietan K. CRE-mediated transcription and COX-2 expression in the pilocarpine model of status epilepticus. Neurobiol Dis. 2007;25:80–91. doi: 10.1016/j.nbd.2006.08.015. [DOI] [PMC free article] [PubMed] [Google Scholar]
- Li X, Zhou J, Chen Z, Chen S, Zhu F, Zhou L. Long-term expressional changes of Na+ -K+ -Cl- co-transporter 1 (NKCC1) and K+ -Cl- co-transporter 2 (KCC2) in CA1 region of hippocampus following lithium-pilocarpine induced status epilepticus (PISE) Brain Res. 2008;122:141–6. doi: 10.1016/j.brainres.2008.04.047. [DOI] [PubMed] [Google Scholar]
- Lonze BE, Ginty DD. Function and regulation of CREB family transcription factors in the nervous system. Neuron. 2002;35:605–23. doi: 10.1016/s0896-6273(02)00828-0. [DOI] [PubMed] [Google Scholar]
- Lopez de Armentia M, Jancic D, Olivares R, Alarcon JM, Kandel ER, Barco A. cAMP response element-binding protein-mediated gene expression increases the intrinsic excitability of CA1 pyramidal neurons. J Neurosci. 2007;27:13909–18. doi: 10.1523/JNEUROSCI.3850-07.2007. [DOI] [PMC free article] [PubMed] [Google Scholar]
- Lund IV, Hu Y, Raol YH, Benham RS, Faris R, Russek SJ, Brooks-Kayal AR. BDNF selectively regulates GABAA receptor transcription by activation of the JAK/STAT pathway. Sci Signal. 2008;1:ra9. doi: 10.1126/scisignal.1162396. [DOI] [PMC free article] [PubMed] [Google Scholar]
- Molina CA, Foulkes NS, Lalli E, Sassone-Corsi P. Inducibility and negative autoregulation of CREM: an alternative promoter directs the expression of ICER, an early response repressor. Cell. 1993;75:875–86. doi: 10.1016/0092-8674(93)90532-u. [DOI] [PubMed] [Google Scholar]
- Pathak HR, Weissinger F, Terunuma M, Carlson GC, Hsu FC, Moss SJ, Coulter DA. Disrupted dentate granule cell chloride regulation enhances synaptic excitability during development of temporal lobe epilepsy. J Neurosci. 2007;27:14012–22. doi: 10.1523/JNEUROSCI.4390-07.2007. [DOI] [PMC free article] [PubMed] [Google Scholar]
- Pitkanen A, Kharatishvili I, Karhunen H, Lukasiuk K, Immonen R, Nairismagi J, Grohn O, Nissinen J. Epileptogenesis in experimental models. Epilepsia. 2007;48(Suppl 2):13–20. doi: 10.1111/j.1528-1167.2007.01063.x. [DOI] [PubMed] [Google Scholar]
- Porter BE, Lund IV, Varodayan FP, Wallace RW, Blendy JA. The role of transcription factors cyclic-AMP responsive element modulator (CREM) and inducible cyclic-AMP early repressor (ICER) in epileptogenesis. Neuroscience. 2008;152:829–36. doi: 10.1016/j.neuroscience.2007.10.064. [DOI] [PMC free article] [PubMed] [Google Scholar]
- Racine R. Modification of seizure activity by electrical stimulation. II. Motor seizure. Electroencephalogr Clin Neurophysiol. 1972;32:281–294. doi: 10.1016/0013-4694(72)90177-0. [DOI] [PubMed] [Google Scholar]
- Rakhade SN, Yao B, Ahmed S, Asano E, Beaumont TL, Shah AK, Draghici S, Krauss R, Chugani HT, Sood S, Loeb JA. A common pattern of persistent gene activation in human neocortical epileptic foci. Ann Neurol. 2005;58:736–47. doi: 10.1002/ana.20633. [DOI] [PubMed] [Google Scholar]
- Rivera C, Voipio J, Thomas-Crusells J, Li H, Emri Z, Sipila S, Payne JA, Minichiello L, Saarma M, Kaila K. Mechanism of activity-dependent downregulation of the neuron-specific K-Cl cotransporter KCC2. J Neurosci. 2004;24:4683–91. doi: 10.1523/JNEUROSCI.5265-03.2004. [DOI] [PMC free article] [PubMed] [Google Scholar]
- Rivera C, Li H, Thomas-Crusells J, Lahtinen H, Viitanen T, Nanobashvili A, Kokaia Z, Airaksinen MS, Voipio JL, Kaila K, Saarma M. BDNF-induced TrkB activation down-regulates the K+-Cl- cotransporter KCC2 and impairs neuronal Cl - extrusion. J Cell Biol. 2002;159:747–52. doi: 10.1083/jcb.200209011. [DOI] [PMC free article] [PubMed] [Google Scholar]
- Temkin NR. Preventing and treating posttraumatic seizures: the human experience. Epilepsia. 2009;50(Suppl 2):10–3. doi: 10.1111/j.1528-1167.2008.02005.x. [DOI] [PubMed] [Google Scholar]
- Timmusk T, Palm K, Metsis M, Reintam T, Paalme V, Saarma M, Persson H. Multiple promoters direct tissue-specific expression of the rat BDNF gene. Neuron. 1993;10:475–89. doi: 10.1016/0896-6273(93)90335-o. [DOI] [PubMed] [Google Scholar]
- Tyson-Capper AJ, Bailey J, Krainer AR, Robson SC, Europe-Finner GN. The switch in alternative splicing of cyclic AMP-response element modulator protein CREMτ2α (activator) to CREMα (repressor) in human myometrial cells is mediated by SRp40. J Biol Chem. 2005;280:34521–9. doi: 10.1074/jbc.M505344200. [DOI] [PubMed] [Google Scholar]
- Walker WH, Sanborn BM, Habener JF. An isoform of transcription factor CREM expressed during spermatogenesis lacks the phosphorylation domain and represses cAMP-induced transcription. Proc Natl Acad Sci U S A. 1994;91:12423–7. doi: 10.1073/pnas.91.26.12423. [DOI] [PMC free article] [PubMed] [Google Scholar]
- Zhang X, Odom DT, Koo SH, Conkright MD, Canettieri G, Best J, Chen H, Jenner R, Herbolsheimer E, Jacobsen E, Kadam S, Ecker JR, Emerson B, Hogenesch JB, Unterman T, Young RA, Montminy M. Genome-wide analysis of cAMP-response element binding protein occupancy, phosphorylation, and target gene activation in human tissues. Proc Natl Acad Sci U S A. 2005;102:4459–64. doi: 10.1073/pnas.0501076102. [DOI] [PMC free article] [PubMed] [Google Scholar]
Associated Data
This section collects any data citations, data availability statements, or supplementary materials included in this article.
Supplementary Materials
(A) The level of electrical activity required to produce an electrographic seizure (after discharge) was similar between the CREBαΔ and wild-type mice. (B) There was a trend toward an increase in electrographic seizure duration during the development of kindling in both the wild-type and CREBαΔ hypomorphs but no difference between genotypes. (C) Typical EEG recording of the baseline and fully kindled mice in cortex and hippocampus. Arrow indicates the electrical pulse.