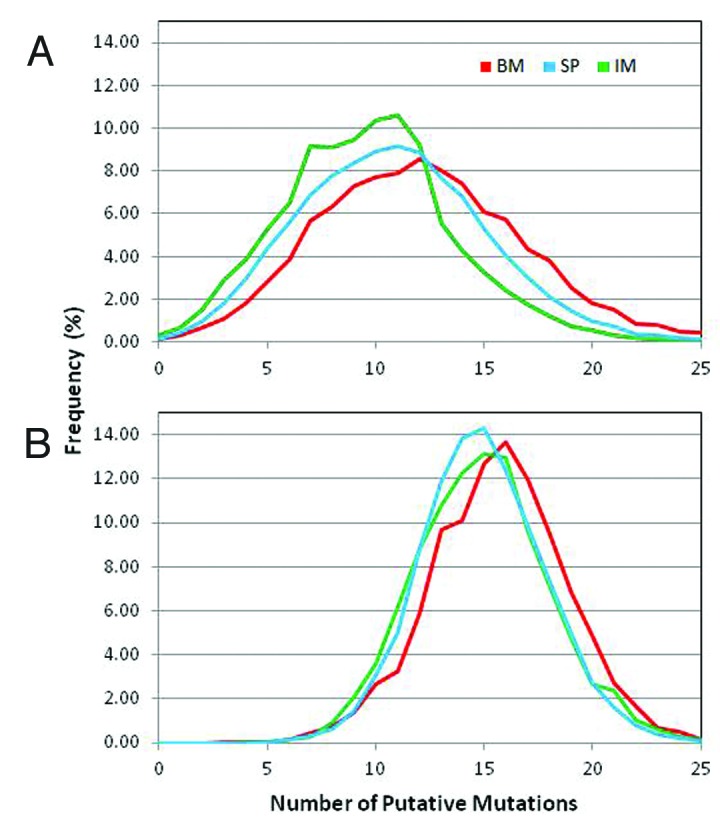
Figure 5. Distribution of total number somatic mutations per read: Total number of mutations per read observed in the three samples, bone marrow (BM), spleen (SP) from naïve rabbit and spleenocytes from immunized rabbit (IM). All reads with germline gene assignment were compared with the respective germline gene sequence and the total number of mutations, except at the first 7 amino acid residues, along the v-gene were counted and the reads were grouped based on the number of mutations. The curves represent the percent of reads with a given number of mutations for VH (A) and VL (B).
