

Abstract
An advanced two-dimensional liquid chromatography/mass spectrometry platform was used to quantify individual host cell proteins (HCPs) present at various purification steps for several therapeutic monoclonal antibodies (mAbs) produced in Chinese hamster ovary cells. The methodology produced reproducible identifications and quantifications among replicate analyses consistent with a previously documented individual limit of quantification of ~13 ppm. We were able to track individual HCPs from cell culture fluid to protein A eluate pool to subsequent viral inactivation pool and, in some cases, further downstream. Approximately 500 HCPs were confidently identified in cell culture fluid and this number declined progressively through the purification scheme until no HCPs could be confidently identified in polishing step cation-exchange eluate pools. The protein A eluate pool of nine different mAbs contained widely differing numbers, and total levels, of HCPs, yet the bulk of the total HCP content in each case consisted of a small subset of normally intracellular HCPs highly abundant in cell culture fluid. These observations hint that minimizing cell lysis during cell culture/harvest may be useful in minimizing downstream HCP content. Clusterin and actin are abundant in the protein A eluate pools of most mAbs studied. HCP profiling by this methodology can provide useful information to process developers and lead to the refinement of existing purification platforms.
Keywords: Host cell proteins, mass spectrometry, monoclonal, antibody
Introduction
Recombinant biotherapeutics are typically produced in non-human cell lines. Following purification, low residual levels of host cell protein (HCP) impurities can remain in the final drug product. Residual HCPs represent potential safety risks for patients, and for this reason are expected to be reduced to levels deemed safe by regulatory agencies. Potential risks associated with specific HPCs may include immunogenicity, adjuvant activity, proteolytic activity, and direct biological activity of potent molecules (e.g., cytokines); examples of all of these are documented in the literature.1-5 Currently, immunoassays are almost universally used to monitor total residual HCP levels in the industry (the use of Fourier transform mid infrared spectroscopy has also recently been reported6), but whether specific, critical HCPs should be individually measured is an open question.7,8
Monoclonal antibodies (mAbs) constitute a substantial portion of the biopharmaceutical industry’s current biotherapeutics portfolio, and downstream purification of mAbs has evolved into platform processes that are highly similar across the pharmaceutical industry. Protein A affinity capture is often employed as a generic first step, followed by two or three orthogonal polishing steps, the exact conditions for which may be empirically tailored for each specific mAb.9 A low pH viral inactivation step may be conveniently included after elution from the protein A resin. The protein A step is highly effective in reducing the high HCP levels typically present in cell culture harvests, with much of the subsequent optimization of polishing steps focused on reducing HPCs, as well as mAb aggregates, to ‘acceptable’ levels.10
Little is currently known regarding the identity of HCPs present in mAb drug products or the mechanisms by which these survive rigorous purification schemes. To date, most attempts to address the latter question have focused on the protein A affinity step, both because of its high effectiveness and the near universality of operating conditions. In principle, HCPs could co-elute with mAb due to interaction with either the product or the affinity matrix. Using total HCP monitoring by ELISA, it has been demonstrated that HCP levels in protein A eluate pools can vary widely (orders of magnitude) among different mAbs,10 supporting HCP interactions with mAb as the dominant mechanism. This conclusion was also supported by an elegant experiment that demonstrated large differences in protein A eluate pool HCP content depending on the order in which purified mAb and null cell harvested cell culture fluid were first applied to the column.11 These studies left unanswered the question of whether different mAbs interact with different subpopulations of HCPs. A recent study used cross-interaction chromatography followed by two-dimensional (2D) gel electrophoresis with MALDI-TOF identification to conclude that product association constitutes an important mechanism by which specific HCPs co-purify during protein A chromatography.12 What remains unclear is whether these represent specific, high-affinity HCP-mAb interactions or arise from non-specific binding of the highest abundance HCPs to differentially ‘sticky’ mAbs. Such knowledge could have implications for the future refinement of purification strategies, as well as possibly affecting both cell line and protein engineering.
To answer such questions, it would be ideal to track (i.e., identify and quantify) HCPs through actual purification processes, in the presence of mAb product. This represents a major analytical challenge due to the required parts-per-million (ppm) sensitivity combined with dynamic range limitations of analytical instrumentation. To date, proteomics-based profiling of HCPs has been almost universally performed by highly resolving 2D gel electrophoresis followed by MS identification of excised spots, usually with the purpose of identifying proteins differentially expressed under specific conditions.13-17 These approaches are inherently non-quantitative in an absolute sense, but can be used to make relative comparisons. Carlage et al.18 used direct liquid chromatography-mass spectrometry (LC-MS) analysis of lysed, trypsin-digestion Chinese hamster ovary (CHO) cells to identify nearly 400 proteins, with an emphasis on those differentially expressed as a function of cellular productivity. These studies have led to the identification of numerous CHO proteins, often with a predominance of various chaperones, glycolytic enzymes and other proteins related to mAb production. Absolute quantification, however, has been lacking in all these studies.
Doneanu et al.19 first demonstrated the ability to identify and quantify individual HCPs in mAb protein A eluate pools, and in a highly automated fashion, using 2D-LC-MSE (MSE). This approach utilized the “top3” approach20 for quantification, the accuracy of which was validated for selected proteins to within 25% of those obtained by LC-MRM monitoring of isotopically labeled peptide analogs. This methodology appears well suited as an information-rich, generic method to monitor HCPs in the biopharmaceutical industry and to provide valuable information for process developers at the individual HCP level. Because we wished to provide quantitative information on HCPs in actual process pools in the presence of mAb product, HCP enrichment techniques21 were not applicable.
In this study, we utilized MSE to comprehensively identify and quantify residual HCPs in purification pools through the initial steps of typical mAb platform processes. Analysis by MS of HCPs present at ppm levels represents a challenge similar to that posed by the “dark corner” of the proteome, where the reliability of low abundance identifications can be expected to be lower than those of the higher abundance identifications of typical proteomics experiments.22 For this reason, care was taken to also evaluate the reproducibility of both identifications and quantifications. Samples from three purification processes were then analyzed, including two different mAbs with major process differences (expressed in different CHO cell lines and utilizing different media), as well as two subtly differing processes for the same mAb. Table 1 provides a high-level comparison of these processes. Specific sample types studied include clarified cell culture fluid (CCCF), protein A eluate pool (PrA pool), filtered viral inactivation pool (FVIP), CaptoAdhere flow-through (CAP) and cation-exchange eluate pool (CEX). Further insight was obtained by analyzing the PrA pools from seven other mAbs. The quantification of individual HCPs through these purification steps provides insight into the mechanisms that allow specific HCPs to co-purify with mAb product.
Table 1. Process comparison.
| mAb | mAb1 | mAb2 | |
|---|---|---|---|
| Process | P1 | P2 | N/A |
| Cell Line | A | A | B |
| Media | Contains peptone | Contains peptone | Chemically defined |
| Harvest Method | Centrifugation Depth Filtration (Cuno) |
Centrifugation Depth Filtration (Sartopure) |
Centrifugation Depth Filtration |
| Pr. A Resin | MabSelect (22 g/L) | MabSelect (30 g/L) | MabSelect SuRe (36 g/L) |
| Chaotopic Salt Wash? | No | No | Yes |
Results
In this study, we estimated individual HCP levels from in-process pools of two antibody purification processes designed for large scale production with the goal of gaining initial insight into why individual HCPs co-purify, or are eliminated, at specific steps. Parallel samples from two distinct processes for mAb1 were compared and contrasted to samples from mAb2. The effect of process variability on any HCP-related findings was not investigated. Both mAb1 and mAb2 are IgG2κ antibodies with pIs of 7.4 and 7.1, respectively. A high level summary of all analyses is presented in Table 2, with more detailed results following in subsequent sections.
Table 2. High level overview of number of HCPs and amount of total HCP (in ppm) for each analysis based only on good PLGS matches.
| mAb1 P1 | |||||||
|---|---|---|---|---|---|---|---|
| CCCF | Pr.A pool | FVIP | CEX | ||||
| Replicate | 1 | 2 | 1 | 2 | 1 | 2 | 1 |
| # of HCPs | 410 | 490 | 133 | 163 | 34 | 32 | 0 |
| Total ppm | ≥ 121,938 | ≥ 158,040 | 10,623 | 7,385 | 991 | 863 | N/A |
| mAb1 P2 | |||||||||
|---|---|---|---|---|---|---|---|---|---|
| CCCF | Pr.A pool | FVIP | CEX | ||||||
| Replicate: | 1 | 2 | 3* | 1 | 2 | 3 | 1 | 2 | 1 |
| # of HCPs: | 440 | 395 | 374 | 135 | 132 | 126 | 19 | 15 | 0 |
| Total ppm: | ≥ 78,077 | ≥ 77,701 | ≥ 98,188 | 8,381 | 8,173 | 7,264 | 908 | 523 | N/A |
| mAb2 | |||||||||
|---|---|---|---|---|---|---|---|---|---|
| CCCF | Pr.A pool | FVIP | CAP | CEX | |||||
| Replicate: | 1 | 2 | 1 | 2 | 1 | 2 | 1 | 1 | |
| # of HCPs: | 747 | 599 | 31 | 34 | 15 | 15 | 6 | 0 | |
| Total ppm: | ≥ 133,668 | ≥ 112,210 | 1,212 | 1,483 | 823 | 726 | 195 | N/A | |
10 µg injection, all other were 40 µg
Clarified cell culture fluid
In typical clinical or commercial antibody production, protein A chromatography is the first column step, and where the majority of HCP is removed. Antibodies produced in engineered CHO cells are secreted into the cell culture media. Prior to loading onto this column, the cell culture material is processed to remove live and dead cells and other debris. Centrifugation or other methods may be used to clarify the cell culture fluid, producing CCCF (clarified cell culture fluid). Levels of individual HCPs in CCCF were determined to study changes from the protein A chromatography step and to compare crude samples between different antibody processes.
Multiple CCCF samples were tested to assess the performance of the assay on this sample type. HCP levels are normally reduced to ppm levels (w/w, relative to product) during mAb purification processes but, due to instrumental dynamic range limitations, a single LC-MS protocol cannot simultaneously quantify both low level HCPs and the mAb product. Since the antibody is over 99% of the total protein in most in-process samples, we measured its concentrations by UV absorbance and optimized the LC-MS sample load (40 µg, representing ~2 µg for each 2nd dimension gradient) to facilitate detection of low abundance HCPs in downstream purification samples. Under these conditions, mAb peptides exceed the upper end of the dynamic range of the instrument; however, this might also be true for HCPs that are highly abundant (especially in CCCF samples). To test the upper limits of HCP linearity, mAb1 P2 CCCF was analyzed with the standard 40 µg, as well as a lower, 10 µg, sample load. A quantitative comparison of results is shown in Figure 1, with numerical data in Table S1. Results from replicate 40 µg analyses correlated well (Fig. 1A), but a comparison of results from 10 µg and 40 µg loads (Fig. 1B) showed deviations from linearity at higher HCP levels. The MS response is fundamentally proportional to moles, as opposed to relative mass, of analyte. Plotting the data of Figure 1B in terms of on-column fmol for each HCP (Fig. 1C) demonstrated more clearly a systematic deviation from linearity above ~500 fmol, which is not evident below 500 fmol (Fig. 1D). HCPs present at on-column levels of > 500 fmol showed decreased quantification at the standard 40 ug load compared with the 10 ug load, suggesting under-quantification at the 40 ug load. For an HCP with a typical MW of 50,000 Da, 500 fmol represents 630 ppm with a 40 µg injection. This level was exceeded by numerous abundant HCPs found in CCCF samples, but generally not in pools collected from downstream samples. In spite of the underestimation issue with abundant HCPs, the 40 µg load was chosen for in-process comparison for the increased sensitivity of the less abundant proteins. For this reason, HCP levels exceeding the linear range are represented subsequently as ≥ X ppm, where X represents the apparent quantification result. It is important to note that the yeast protein standards used for calibration span the range from 20–540 fmol on-column and fall within the linear response range. Representative calibration curves are shown in Figure S1.

Figure 1. Quantitative correlations among three analyses of mAb1 P2 CCCF using identifications from the 100 highest scoring HCPs in Run 1 (arbitrary). (A) Replicate analyses with 40 µg injection. (B) Average of the two 40 µg injections compared with the 10 µg injection, plotted as ppm HCP. (C and D) Average of the two 40 µg injections compared with the 10 µg injection, plotted as on-column fmol HCP. The dashed lines represent the expected correlations.
For the two mAbs chosen, mAb1 P1, mAb1 P2 and mAb2 represent 3 distinct cell culture/harvest conditions. Compared with mAb1 P1, P2 has several improvements, including a change in the depth filters that significantly reduced HCP levels as determined by ELISA. MAb2 represents a major change in cell culture conditions, with a different CHO cell line and different media compared with mAb1 (Table 1). Hundreds of HCPs were confidently identified and quantified in the CCCF of each of these processes (Table 2). The total HCP content for mAb1 P2 was decreased ~2-fold compared with P1, given the caveats discussed in the preceding paragraph. The 100 top-scoring CCCF HCPs from the three processes are compared in Table S2. Ninety-nine of mAb1 P1 HCPs were also identified in CCCF from mAb1 P2. Quantitatively, the scatter plot correlation between numerical values for mAb1 P1 vs P2 (Fig. 2A) was as good as between replicates of P1 (Fig. 1A). The reduced slope is consistent with reduced levels of all HCPs. In contrast, only 92 of these HCPs were detected in the CCCF of mAb2 and the quantitative correlation between HCP levels in CCCF of mAb1 vs mAb2 was considerably poorer (Fig. 2B). These findings are consistent with significant changes in expression of individual CHO proteins as a result of genetic divergence in cell lines or metabolic changes due to differences in feed media. Multiple HCPs showed quantitative variations greater than 10-fold (Table S2). For example, protein disulfide isomerase A6 measured 1839 ppm in mAb1 P1 CCCF, but only 43 ppm in mAb2 CCCF. Such differences could be attributed to any combination of different host cell lines, different media composition, or expression of a different mAb product. It should be emphasized that the present study does not contain true process, as opposed to analytical, replicates and the reproducibility of these processes with respect to specific HCP results has not been broadly demonstrated. However, the similarity between results for mAb1 P1 vs P2 is encouraging in this regard.
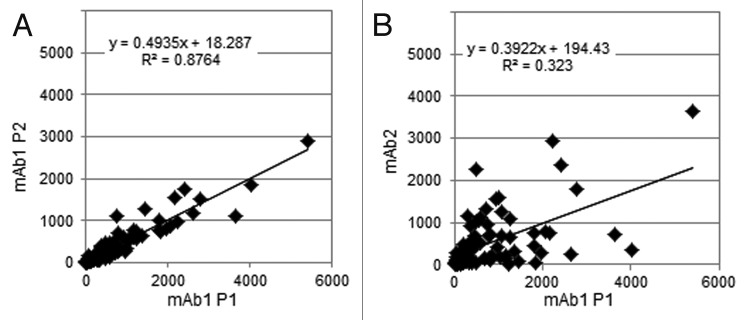
Figure 2. Quantitative comparison (in ppm) of the highest scoring 100 HCPs (in mAb1 P1 CCCF, Run 1) between different processes: (A) mAb1 P2 vs. P1, and (B) mAb2 vs. mAb1 P1. All numbers are the average values from two replicate runs. To allow these comparisons, all HCP levels were plotted at their nominal value, ignoring the fact that some MS signals were likely to be saturated, resulting in under-quantification.
Protein A eluate pool
Protein A affinity chromatography is the single most effective purification step in platform mAb processes,23,24 and this was reflected in the large reduction in both numbers and total levels of HCPs after this step (Table 2). Compared with mAb1, mAb2 has an improved PrA step with MabSelect SuRe resin and a chaotropic salt wash, which could help to more effectively reduce HCP levels. Notably, the PrA pool of mAb2 contained nearly 10-fold less total HCP than mAb1, which might be attributable to either, or both, of these process improvements. However, differences in the mAb product itself may also contribute to this difference.
In spite of the large differences in efficiency of HCP reduction by PrA chromatography for these two molecules, mainly the most abundant CCCF HCPs were identified in PrA pools in both cases (Table S3). A fairly monotonic relationship between the initial abundance of specific HCPs in CCCF and their detectability in PrA pool was observed (Fig. 3); this was true for both mAbs. The majority of HCPs that quantified above 500 ppm (but possibly much higher) in CCCF were detected in PrA pool, whereas few that quantified below 200 ppm were detected. Therefore, to a first approximation, the mechanism by which the majority of HCPs carry through the PrA purification step is likely due to non-specific binding to mAb, which would be highly dependent on CCCF HCP concentration and the mAb density on the PrA resin.
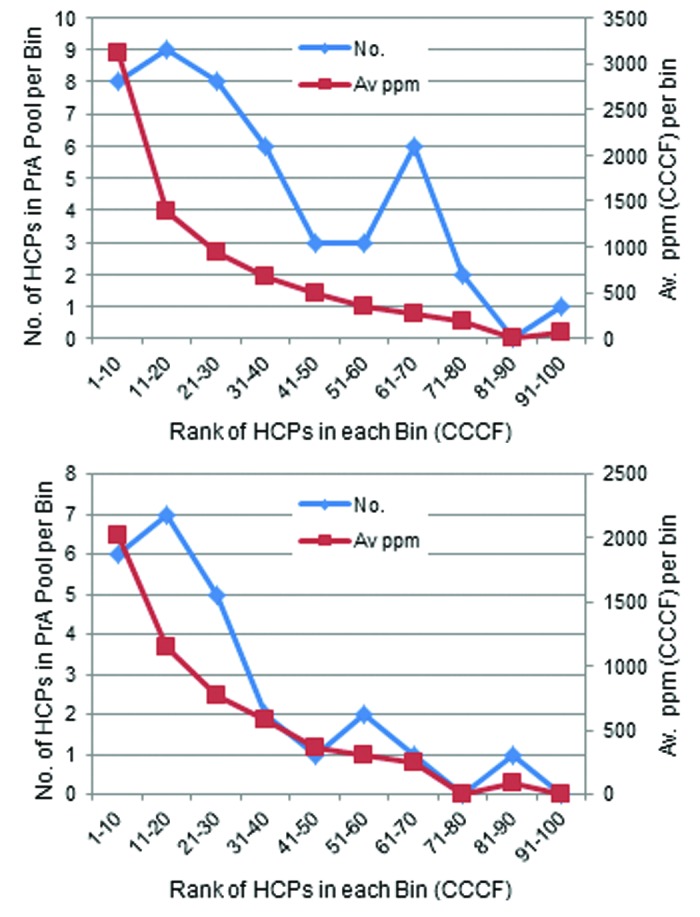
Figure 3. Number and average CCCF ppm of the HCPs identified in PrA pools from the 100 highest scoring CCCF HCPs for mAb1 P1 (top) and mAb2 (bottom) grouped by bins of 10 representing the CCCF HCPs in order of abundance.
The HCPs identified in the PrA pools of both molecules exhibited considerable overlap, in spite of the large difference in numbers of identifications. Twenty-one HCPs were identified in mAb2 PrA pool with a PLGS score of > 1000 in either of two analyses. All 21 were also identified upstream in CCCF from mAb2 (as expected), as well as in mAb1 CCCF. Somewhat surprisingly, 14 (67%) of these were also identified in mAb1 PrA pool (data not shown). The fact that all 21 of these HCP’s were identified in the CCCF of both molecules is important, as it directly demonstrates that failure to detect seven of these in mAb1 PrA pool was not due to suppression by unique Mab1 Fab peptides. As a more likely explanation, the mAb1 CCCF levels of many of these HCPs was noticeably lower than for mAb2 CCCF, suggesting that the failure to identify them in the mAb1 PrA pool was the result of clearance to below the LOQ.
A PrA pool was used to more rigorously probe the reproducibility of individual HCP identifications and quantifications. This sample type was chosen because it had a sufficient number of identifications to yield meaningful statistics, including numerous low level HCPs, yet was not as complex as CCCF. MAb1 P2 PrA pool was independently analyzed three times. The number of good HCP identifications in these runs was 133, 132 and 126, respectively, and these quantified with total levels of 8381, 8173 and 7264 ppm, respectively. Further analyses were performed with the more confidently identified HCPs to avoid issues related to the stochastic nature of lower scoring identifications. For this purpose, all HCPs with a PLGS score of > 1000 in any of the three analyses were included (n = 74), and these are listed in Table S4. By weight, these HCPs comprised the bulk (av. 6000 ppm) of the measured HCP content of this sample, with individual HCPs ranging from > 1000 ppm to 3 ppm. Figure 4 shows the correlation of HCP identifications among the 3 runs; 65 (88%) were independently identified in all three runs, 7 (9%) were identified in 2 runs and two (3%) were only identified once. All HCPs that quantified above an average of 22 ppm (n = 43) were independently identified in every replicate run. Conversely, as HCP levels approached the LOQ of ~13 ppm,7 independent identifications became less probable. There was good quantitative agreement for each HCP among the three runs, with an average CV of 27% (Table S4). Scattergrams showing two-way comparisons are presented in Figure 5; an average linear correlation coefficient (r2) of 0.91 was obtained between the quantification results from any two analyses. These data are representative of the present study and demonstrate that good results can be obtained even from a single analysis.
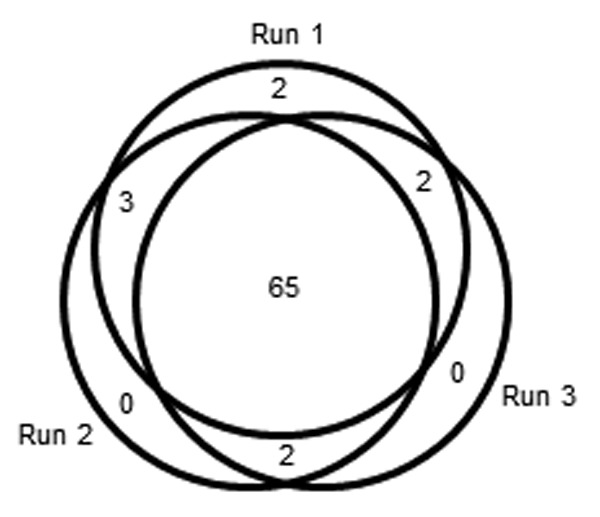
Figure 4. Venn diagram of overlap of identifications among 3 analyses of mAb1 P2 PrA pool. All identifications with a PLGS score of > 1000 in any run were included in the analysis (n = 74).
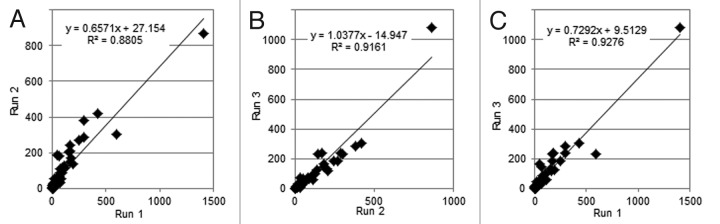
Figure 5. Quantitative correlations (in ppm) among three replicate analyses of mAb1 P2 PrA pool, showing each HCP plotted as an individual point. The most abundant HCP, clusterin, was plotted at its nominal value, even though this likely represents an under-quantification (text).
FVIP and further downstream
Although not designed for this purpose, HCP levels were further reduced following low pH viral inactivation and depth filtration of the PrA column eluate (Table 2). The total HCP reduction by this step was significant (nearly 10-fold) for mAb1. Notably, with mAb2, where the PrA pool HCP content was already much lower, the subsequent viral inactivation/depth filtration step resulted in only a ~2-fold reduction. This difference may be due to differences in depth filters used or due to the difference in composition, differences in the interactions with the antibody, or concentration of the HCPs in the ProA pool sample. As a result, although the mAb1 and mAb2 PrA pool HCP levels differed ~6-fold, the FVIP HCP levels were similar. The process reproducibility of these results was not investigated.
The second chromatography step for both P1 and P2 of mAb1 consisted of cation-exchange chromatography in the bind/elute mode, although different resins were used. MSE analysis of the CEX pools yielded no confident identifications, demonstrating both the effectiveness of this purification step and the practical sensitivity limitation of our current methodology. The second chromatography step of the mAb2 process was mixed-mode CaptoAdhere chromatography conducted in the flow-through mode. In the CaptoAdhere flow-through pool, six HCPs, totaling 195 ppm, were confidently identified. However, a subsequent ion-exchange chromatography step further reduced HCPs to non-detectable levels.
HCP step clearance
Quantitative tracking of individual HCPs through purification is of interest to process developers because it allows clearance factors at various steps to be calculated and correlated with physiochemical properties of individual HCPs. This, in turn, should allow informed, as opposed to empirical, purification improvements that target HCPs deemed problematic. Because the highly effective PrA affinity purification step reduced the number of identified HCPs to manageable levels, we tracked all HCPs detected in the PrA pools of mAb1 Pr1 and mAb2 throughout all steps of their respective processes. Results for mAb1 P1 are shown in Table 3 (partial data) and Table S5 (complete data). There appear to be considerable variations in the reduction factor for individual HCPs across PrA chromatography, even though accurately estimating these for many of the most abundant HCPs in CCCF is difficult. Reduction to at least 23% of the level in CCCF had been achieved for many HCPs for this step, which used MabSelect resin without a chaotropic salt wash. This number may, however, represent a substantial underestimation of the true reduction factor. Two abundant HCPs that appeared to experience especially poor clearance during PrA chromatography were clusterin and actin. These results were similar with mAb1 P2 (data not shown). As a possible explanation, clusterin is known to bind by a multivalent mechanism to both the Fc and Fab regions of human IgG25 and actin, besides being highly abundant, is reported to participate in more protein-protein interactions than any known protein.26 These tables further show that the HCPs identified downstream in FVIP tended to be among those most abundant in PrA pool, with an average reduction to ~22% of starting concentrations. Clusterin was by far the most abundant HCP in both PrA pool and FVIP.
Table 3. MAb1 P1 in-process quantification for those HCPs identified in PrA pool, ranked by abundance in PrA pool.
| Av ppm | PrA pool/CCCF | FVIP/PrA pool | |||
|---|---|---|---|---|---|
| Description | CCCF | PrA pool | FVIP | ||
| Clusterin | ≥ 2398 | ≥ 1216 | 309 | ≤ 51% | ≤ 25% |
| Pyruvate kinase | ≥ 2770 | 395 | 39 | ≤ 14% | 10% |
| Actin cytoplasmic 1 | 531 | 386 | 77 | 73% | 20% |
| Hypoxia upregulated protein 1 | ≥ 3579 | 357 | ≤ 10% | ||
| Endoplasmin | ≥ 4031 | 350 | 38 | ≤ 9% | 11% |
| 78 kDa glucose regulated protein | ≥ 5399 | 304 | 59 | ≤ 6% | 19% |
| Laminin subunit β 1 | ≥ 2626 | 287 | ≤ 11% | ||
| Elongation factor 2 | 607 | 223 | 37% | ||
| Elongation factor 1 α 1 | ≥ 765.5 | 201 | 27 | ≤ 26% | 13% |
| Heat shock protein HSP 90 β | ≥ 1359 | 196 | 18 | ≤ 14% | 9% |
| Laminin subunit gamma 1 | ≥ 1152 | 170 | ≤ 15% | ||
| Glyceraldehyde 3 phosphate dehydrogenase | ≥ 1061 | 149 | 18 | ≤ 14% | 12% |
| Tubulin α chain | ≥ 1040 | 143 | 19 | ≤ 14% | 13% |
| Alpha enolase | ≥ 703 | 141 | ≤ 20% | ||
| Glutathione S transferase P | 570 | 131 | 18 | 23% | 14% |
| Calreticulin | ≥ 1455 | 121 | ≤ 8% | ||
| Galectin 3 binding protein | ≥ 1161 | 120 | ≤ 10% | ||
| Kinesin like protein Fragment | ≥ 862 | 120 | ≤ 14% | ||
| Transketolase | ≥ 1801 | 92 | ≤ 5% | ||
| Phospholipid transfer protein | 266 | 85 | 18 | 32% | 21% |
| ERP57 protein | ≥ 2481 | 69 | ≤ 3% | ||
| 6 phosphogluconate dehydrogenase decarboxylating | 501 | 67 | 13% | ||
| T complex protein 1 subunit β | 268 | 63 | 23% | ||
| Protein disulfide isomerase A4 | ≥ 1958 | 63 | 40 | ≤ 3% | 64% |
| T complex protein 1 subunit α | 317 | 62 | 20% | ||
| T complex protein 1 subunit gamma | 267 | 61 | 23% | ||
| Alanyl tRNA synthetase cytoplasmic | 300 | 59 | 20% | ||
| Peroxiredoxin 1 | ≥ 1057 | 57 | 21 | ≤ 5% | 37% |
| T complex protein 1 subunit delta | 156 | 52 | 33% | ||
| Elongation factor 1 gamma | 273 | 51 | 18% | ||
| Heat shock protein HSP 90 α | ≥ 1167 | 49 | 10 | ≤ 4% | 20% |
| Serine protease HTRA1 | 145 | 49 | 34% | ||
| Phosphoglycerate kinase 1 | 552 | 49 | 9% | ||
| RuvB like 1 | 131 | 47 | 36% | ||
| T complex protein 1 subunit zeta | 234 | 46 | 20% | ||
| Thrombospondin 1 OS | 627 | 45 | 7% | ||
| T complex protein 1 subunit eta | 216 | 45 | 21% | ||
| Retinoid inducible serine carboxypeptidase | 240 | 41 | 17% | ||
| Procollagen C endopeptidase enhancer 1 | ≥ 1248 | 40 | ≤ 3% | ||
| 60S acidic ribosomal protein P0 | 122 | 39 | 4 | 32% | 10% |
Inclusion criteria: PrA pool and FVIP - all HCPs with PLGS score > 1000 in either run; CCCF - good confidence identification. For brevity, only the top 40 most abundant HCPs in PrA pool are shown. All values are average of two analyses.
A similar analysis for mAb2 (Table 4) presents an interesting comparison. This antibody had similar total HCP levels upstream (CCCF), but achieved much lower levels in the PrA pool (Table 2), possibly due to use of MabSelect SuRe resin with less non-specific binding or implementation of an on-column chaotropic salt wash. Following PrA purification, the average HCP level was reduced to ≤ 6% of starting concentration, compared with ≤ 23% for mAb1 P1. Notably, with the improved conditions used for mAb2, clusterin no longer exhibited atypically low reduction over the PrA step, possibly because the chaotropic salt effectively disrupts the clusterin-IgG interactions. On the other hand, the subsequent low-pH viral inactivation step for mAb2 appeared much less effective in reducing HCP levels compared with mAb1. Whether this could be attributed to the chaotropic salt wash in the preceding step, which perhaps removed much of the more weakly associating HCP population, is unclear. What is strikingly obvious from Table 4 is that the six HCPs identified furthest downstream (in CAP) were among the seven most abundant HCPs in the preceding FVIP. Those HCPs detected in FVIP, in turn, tended to be among those most abundant in the preceding PrA pool. And those HCPs detected in PrA pool tended to be among those most abundant in CCCF, in spite of CCCF quantification limitations. In fact, following PrA chromatography, low pH viral inactivation, and CaptoAdhere chromatography, the six surviving HCPs were among the 30 apparently most abundant HCPs in CCCF. Clusterin and actin were both among the six HCPs detected in CAP.
Table 4. MAb2 in-process quantification for those HCPs identified in PrA pool, ranked by abundance in PrA pool.
| Av ppm | CCCF/Rank | PrA pool/CCCF | FVIP/PrA pool | CAP/FVIP | ||||
|---|---|---|---|---|---|---|---|---|
| Description | CCCF | PrA pool | FVIP | CAP | ||||
| Clusterin | ≥ 2354 | 366 | 263 | 67 | 3 | ≤ 16% | 72% | 26% |
| 78 kDa glucose regulated protein | ≥ 3659 | 116 | 18 | ≤ 3% | 16% | |||
| Granulins | ≥ 1167 | 107 | 83 | 33 | 15 | ≤ 9% | 78% | 40% |
| Elongation factor 1 α 1 | ≥ 669 | 85 | 61 | 15 | 31 | ≤ 13% | 72% | 25% |
| Procollagen lysine 2 oxoglutarate 5 dioxygenase 1 | ≥ 1174 | 74 | 62 | 44 | 14 | ≤ 6% | 84% | 71% |
| Glyceraldehyde 3 phosphate dehydrogenase | ≥ 1264 | 71 | 54 | 23 | 12 | ≤ 6% | 76% | 43% |
| Actin cytoplasmic 1 | ≥ 725 | 63 | 31 | 13 | 28 | ≤ 9% | 50% | 42% |
| Pyruvate kinase | ≥ 1783 | 57 | 35 | ≤ 3% | 62% | |||
| Heat shock 70 kDa protein 13 | 227 | 43 | 19% | |||||
| Follistatin related protein 1 | ≥ 1251 | 32 | ≤ 3% | |||||
| Ubiquitin | 338 | 27 | 15 | 8% | 55% | |||
| Phosphoglycerate kinase 1 | ≥ 910 | 23 | ≤ 3% | |||||
| Peroxiredoxin 1 | ≥ 689 | 23 | ≤ 2% | |||||
| Sulfated glycoprotein 1 | ≥ 936 | 20 | ≤ 2% | |||||
| Alcohol dehydrogenase class 3 | 275 | 17 | 15 | 6% | 93% | |||
| Cornifin A | 327 | 16 | 5% | |||||
| Glutathione S transferase P | 511 | 10 | 2% | |||||
| Fructose bisphosphate aldolase | ≥ 969 | 10 | ≤ 1% | |||||
| Phosphoglycerate mutase 1 | 272 | 9 | 3% | |||||
| Peptidyl prolyl cis trans isomerase | ≥ 767 | 6 | 3 | ≤ 1% | 39% | |||
| Pigment epithelium derived factor | ≥ 682 | 4 | 3 | ≤ 1% | 91% | |||
| Av | ≤ 6% | 65% | 41% | |||||
Inclusion criteria: PrA pool and FVIP - all HCPs with PLGS score > 1000 in either run; CCCF and CAP - good confidence identification. All values except those for CAP are average of two analyses.
An unexpected result was that, in spite of having very different total HCP levels, the PrA pools of Mab1 and Mab2 nevertheless contained substantially overlapping HCP populations. The PrA pools of seven other mAbs, all utilizing approximately similar platform cell culture conditions followed by MabSelect SuRe purification, were similarly analyzed. The number of HCPs identified ranged from 8 to 74, with total HCP levels ranging from 337 to 7450 ppm. Such large differences, although at first surprising, are in agreement with prior findings.10 Comparison of total HCP values to those from HCP ELISA (Fig. 6) showed a good correlation between both methods and confirmed the large intermolecular differences. A reasonable correlation between MS and ELISA results also extended to subsequent purification pools (data not shown). Notably, the most abundant HCPs in the PrA pools of these seven other mAbs, as well as for mAb1 and mAb2, tended to be largely similar (Table 5). Clusterin was among the top three most abundant HCPs for all 9 mAbs. Actin, several glycolytic enzymes, as well as various heat shock proteins also tended to be highly abundant. Although the CCCFs of the seven other mAbs were not specifically analyzed, an overwhelming majority of the three most abundant HCPs in the PrA pools of 9 different mAbs were among the most abundant HCPs in the CCCF of mAb1 and mAb2 (Table 5).
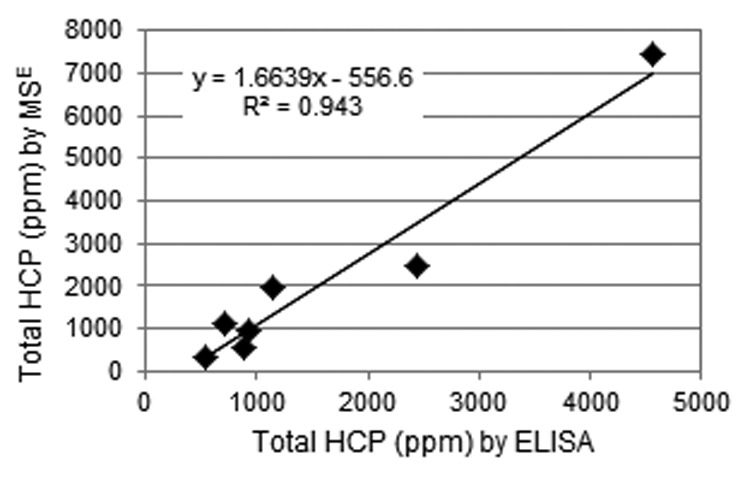
Figure 6. Correlation between total HCP measured by MSE vs. ELISA for PrA pools of 7 mAbs.
Table 5. Number of times specific HCPs ranked first, second or third in abundance in the PrA pools of 9 mAbs.
| Abundance Rank in CCCF of | |||||
|---|---|---|---|---|---|
| Description | Rank 1 | Rank 2 | Rank 3 | mAb1 P1 | mAb2 |
| Clusterin | 7 | 1 | 1 | 6 | 3 |
| Actin | 2 | 4 | 27 | 28 | |
| Pyruvate kinase | 2 | 4 | 6 | ||
| Glyceraldehyde 3 phosphate dehydrogenase | 2 | 21 | 12 | ||
| 78 kDa glucose regulated protein | 1 | 1 | 2 | ||
| Elongation factor 2 | 1 | 155* | 9 | ||
| Lactate dehydrogenase | 1 | 24 | 7 | ||
| Procollagen lysine 2 oxoglutarate 5 dioxygenase 1 | 1 | 16 | 14 | ||
| Granulins | 1 | 63 | 15 | ||
| Phosphoglycerate kinase 1 | 1 | 41 | 18 | ||
| Hypoxia upregulated protein 1 | 1 | 3 | 178* | ||
| Heat shock protein HSP 90 α | 1 | 19 | 252* | ||
not among 100 top scoring HCPs
Discussion
There are unique challenges associated with LC-MS analysis of HCPs at ppm levels (reviewed in ref.19). Because dynamic range limitation was one major challenge, we employed 2D chromatography prior to MS analysis, thereby increasing peak capacity and improving the dynamic range. A second adaptation we employed was to overload the column(s), thereby increasing sensitivity at the low end, but compromising quantification at the high end. A second challenge, less generally appreciated, is that false identifications in MS-based proteomics are concentrated in the low-abundance part of a detected proteome,22 where modified peptides (mutations/misincorporations/post-translational modifications) of abundant proteins (in this case mAb) can significantly outnumber peptides from low abundance proteins (e.g., HCPs). Therefore, we evaluated our ability to obtain consistent identifications and quantifications among independent analyses. For this, we used a PrA pool containing HCPs with individual levels from > 1000 ppm to 3 ppm, with most below 100 ppm (Table S4). Among three analyses, consistent identification and quantification was obtained for HCPs present above ~20 ppm, with reduced consistency below that. These results conform to a previously estimated LOQ of ~13 ppm.7 Furthermore, we established that our method showed a linear response to ~500 fmol on-column (~630 ppm for a 50 kDa protein). This compromised the quantification of the most abundant HCPs present in CCCF, but allowed good quantification of the majority of HCPs in downstream steps, the accurate quantification of which was of greater interest.
Our results demonstrate that the PrA pools of 9 different antibodies, purified by similar protocols, contain widely differing numbers, and levels, of identifiable HCPs, which is in agreement with prior findings.10 Identification and quantification of individual HCPs in these pools yielded the observation that the bulk of the total HCP amount in each case consist of a small subset of HCPs highly abundant in cell culture fluid. Rather than different mAbs interacting with different subpopulations of HCPs, it appears that mAbs interact weakly, but to varying degrees, predominantly with different members of a group of highly abundant upstream HCPs. This is probably best thought of as non-specific binding, driven in a concentration-dependent fashion between highly abundant HCPs and mAb bound at high effective concentration to the affinity resin. As the PrA pool HCP concentrations vary so widely among mAbs, and the studied mAbs have near-identical Fc regions (consisting of human IgG1s and IgG2s), one can speculate that the majority of these interactions occur with mAb Fab, perhaps due to unusually ‘sticky’ complementarity-determining regions.
IgG surfaces are generally considered hydrophilic and it is known that even a few amino acid changes can make a large difference to the aggregation propensity,27 as well as the capacity to interact with other proteins.12 Several HCPs were identified that appear to interact with all, or most, mAbs. Most obvious among these was clusterin, known to bind both Fc and Fab regions of IgGs25 and a protein that was always among the most abundant, and frequently the most abundant, in PrA eluate pools. A second HCP that was highly abundant in the PrA pool of most mAbs was actin, a protein known to engage in numerous protein-protein interactions.26 General HCP clearance also appears to play a role in steps downstream of PrA chromatography. The post-PrA low pH viral inactivation/depth filtration step can reduce HCPs significantly (up to 10-fold), but appears to do so across the board; as the HCPs identified in FVIP tend to be among the most abundant in PrA pool. Thus, the HCPs remaining at this stage, and prior to the employment of subsequent polishing steps, can trace their presence back to those most abundant in the CCCF. Furthermore, six HCPs remaining in a flow-through chromatography pool (CAP) downstream of FVIP were among the seven most abundant HCPs in PrA pool. Nonetheless, subsequent CEX chromatography, properly optimized, may provide sufficient orthogonality to reduce such HCPs to very low levels.
Several general approaches to ultimately minimize HCP levels in drug products suggest themselves from these findings. First, mAbs could be engineered to minimize ‘sticky’ patches resulting from unique variable region sequences and presumably responsible for much product-specific HCP binding. Second, it is crucial to minimize cell lysis during cell culture/harvest because this represents the major source of HCPs in harvest fluid28,29 as well as the major source of HCP profile variability.30 Third, effective on-column wash conditions, capable of disrupting HCP interactions with mAb, can be developed. It is possible that loading of PrA columns to high dynamic binding capacities, in the interest of maximizing process efficiency, exacerbates non-specific binding of HCPs to product. When practical, it is probably prudent to reduce the HCP burden as much as possible in early purification steps, to avoid relying too much on the downstream polishing steps.
Limited numbers of CHO cell proteins have been identified in prior reports, either based on MS analysis of 2D gel spots (e.g., references 13–17) or direct LC-MS of lysed cells.18 In many cases, these correspond to some of the most abundant CCCF HCPs identified in this study (and thus these may be considered the tip of the iceberg), suggesting that we measurably improved the sensitivity of HCP identifications with our methodology. In addition, this is, to our knowledge, the first report systematically quantifying HCPs through rigorous mAb purification processes. A prior MSE analysis of several mAb PrA pools shows good general agreement with our results.19
To conclude, MSE profiling, both qualitative and quantitative, of HCPs during the upstream mAb purification steps, can provide a wealth of information to process developers, and this can be used to refine existing purification platforms. For example, identification of specific, stubborn HCPs may be used to target these for clearance further downstream by rationally exploiting differences in physicochemical properties (e.g., pI) between HCP and mAb. With our current instrumentation, we encountered sensitivity limitations with the polishing steps downstream of FVIP. We attribute this to the outstanding effectiveness of PrA affinity chromatography in reducing HCPs, as other biotherapeutics purified without PrA chromatography did not encounter this limitation.31 We anticipate that rapid advances in instrumentation will soon facilitate more confident MSE analysis of downstream samples, including mAb drug product. This, in turn, should allow more rational evaluation of potential HCP-related safety risks to patients based on identification and quantification of individual HCPs. This can be especially pertinent for comparing biosimilar mAbs,32-34 which may represent the end products of very different cell culture and purification processes. In the meantime, we anticipate that, in many cases, any HCPs remaining in mAb drug product, and potentially capable of affecting patient safety, are more likely than not to originate from a relatively small subset of the most highly abundant upstream HCPs, which are identifiable today.
Materials and Methods
Materials
Therapeutic mAb1 and mAb2 (both IgG2) and seven other mAbs (2 IgG1 and 5 IgG2) were produced at Amgen (Thousand Oaks and Seattle). In-process samples were frozen retains and included samples from two different processes (P1 and P2) for mAb1.
Yeast standard proteins were purchased commercially and included glucose-6-phosphate dehydrogenase (G6PD), hexokinase 2 (HXKB), alcohol dehydrogenase (ADH1), inorganic pyrophosphatase (IPYR), and enolase (ENO1). Protein concentrations were verified by UV absorbance at 280 nm and impurity levels were estimated by reversed-phase high pressure liquid chromatography (RP-HPLC) coupled with time-of-flight-mass spectrometry (TOF-MS). Digestion enzymes were trypsin (Promega #PRV5280) and Lys-C (Promega #PRV1671).
Host cell protein ELISA
Total immunoreactive HCP content was measured with an in-house ELISA assay developed using polyclonal antibodies raised against concentrated, conditioned media from mock transfected CHO cells.
MSE sample preparation
All samples were concentrated to 25 mg/mL and diafiltered into 50 mM ammonium bicarbonate buffer using Amicon Ultra centrifugal filters with a 3 kDa cut-off membrane. A mixture of five different yeast proteins, each at a different level, was spiked in from a stock solution to serve as calibration standards. RapiGest (Waters #186001861) was added to 0.1% followed by dithiothreitol to 30 mM and the mixture was denatured and reduced by heating at 60 °C for 30 min. Following alkylation (iodoacetamide) and quenching with excess dithiothreitol, the sample was simultaneously digested with 1:50 (w/w) trypsin and 1:170 Lys-C for 4 h at 37 °C. RapiGest was then cleaved by acidifying to 1% (v/v) trifluoroacetic acid (TFA) and incubating for 30 min at 37 °C. Following centrifugation and prior to analysis, samples were adjusted to pH ~10 with 28% NH4OH and filtered using 0.2 µ PVDF filter vials (Thomson Instrument Co #15531–100). Four µL (40 µg) samples were routinely injected.
2D-LC-MSE
This was performed similarly to what was described previously.7 Briefly, 2D separations were performed using a Waters nanoAcquity UPLC system that was interfaced with a Synapt G1 QTOF mass spectrometer (Waters Corp) operating in V-mode. First-dimension chromatography was performed on a XBridge BEH 130 C18 (5 µ, 300µ x 50 mm) Nanoease column using a 20-step gradient created with different ratios of 20 mM NH4HCO3, pH 10 and acetonitrile. Each step elution was automatically analyzed in a second dimension using a linear gradient between 0.1% TFA in water and 0.1% TFA in acetonitrile and a Symmetry C18 (5 µ, 180 µ x 20 mm) trap column and HSS T3 (1.8 µ, 75 µ x 150 mm) analytical column. The eluate from the 2D analytical column was sampled into the mass spectrometer via a Z-spray nanosource (with lock mass) incorporating a universal sprayer using PicoTip emitters.
Data processing
Data were processed35 using Protein Lynx Global Server (PLGS) 2.4, MassLynx (Waters Corp) and Microsoft Excel. Key PLGS parameters were as follows: chromatographic peak width, 0.09 min; TOF resolution, automatic; lock mass for charge 2, 785.8426 m/z (for glufibrinopeptide-B2+); lock mass window, 0.25 Da; low energy threshold, 150 counts; high energy threshold, 40 counts; retention time window, automatic; total intensity threshold, 1000 counts; intact peptide tolerance, automatic (typically 10 ppm); fragment ion tolerance, automatic (typically 25 ppm); minimum fragment ion matches per peptide, 3; minimum fragment ion matches per protein, 7; minimum peptide matches per protein,1; tryptic peptides with a maximum of one missed cleavage; fixed modifications, carbamidomethyl-Cys; variable modifications, oxidation-Met. Results were searched against a custom CHO database from Uniprot (downloaded 12/19/2012) and also containing the yeast standards, enzymes and common contaminants (http://maxquant.org/contaminants.zip). The maximum protein false discovery rate was set to 5%.
PLGS Results Browser automatically curates protein matches as good (green), fair (yellow) or poor (red) with the list of good matches similar, but not always identical, to what would be generated from previously used criteria.7 In this study, good matches were accepted without further manual scrutiny. The confidence of protein matches is further differentiated by a protein (PLGS) score which factors in both the number of matched peptides and their peptide scores. Peptide scores, in turn, reflect the quality of the MS/MS data. The list of good protein matches for some sample types was further restricted, using arbitrary PLGS score cut-offs, to allow more detailed data analysis in a practical manner. Quantification was performed automatically by PLGS based on the top3 approach,20 and initially using a single point calibration based on yeast G6PD at 540 fmol on-column. The slope of this single-point calibration line was compared with the slope of the 5-point calibration curve based on all five internal yeast standards, and, if warranted, small, systematic adjustments to HCP concentrations were made based on the ratios of the two slopes, using Excel and assuming that the 5-point calibration was more accurate. In all cases, any adjustment was minor (< 10%).
Replicates
On principle, no scoring scheme based on database searching can completely separate correct and incorrect matches,36 and this is especially true for HCPs present at very low levels compared with the major component(s).22,36 A common strategy to generate increased confidence in lower confidence assignments is to demonstrate consistent identifications in independent analyses.37 For example, one approach might require independent identification in at least two of three replicate analyses.19 Due in part to the length of our method, we have chosen to avoid extensive replicate analyses. Our goal was to probe the reliability, both qualitative and quantitative, of results from a single MS^E analysis, and for this we analyzed most samples twice. Upstream samples (CCCF and PrA pool) generated large numbers of HCP identifications and, for reasons of practicality of data presentation, and to avoid having to perform extensive replicate analyses to confirm individual HCP results near the LOD/LOQ, we limited data discussions of these samples to a subset of the more confidently identified HCPs using criteria described below. Unless otherwise indicated, quantitative results represent the average from two replicate runs.
Supplementary Material
Disclosure of Potential Conflicts of Interest
No potential conflicts of interest were disclosed.
Acknowledgments
We would like to acknowledge Cindy Ren for conducting the ELISA assays.
Glossary
Abbreviations:
- 2D
two-dimensional
- CAP
CaptoAdhere (flow-through pool)
- CCCF
clarified cell culture fluid
- CEX
cation-exchange
- CHO
Chinese hamster ovary
- ELISA
enzyme-linked immunosorbent assay
- FVIP
filtered viral inactivation pool
- G6PD
glucose-6-phosphate dehydrogenase
- HCP
host cell protein
- HPLC
high pressure liquid chromatography
- LC
liquid chromatography
- LOD
limit of detection
- LOQ
limit of quantification
- mAb
monoclonal antibody
- MALDI
matrix assisted laser desorption ionization
- MRM
multiple reaction monitoring
- MS
mass spectrometry
- PLGS
Protein Lynx Global Server
- PrA
Protein A
- PVDF
polyvinylidene fluoride
- RP
reversed-phase
- TFA
trifluoroacetic acid
- TOF
time-of-flight
- UV
ultraviolet
Footnotes
Previously published online: www.landesbioscience.com/journals/mabs/article/28120
References
- 1.Bierich JR. Treatment of pituitary dwarfism with biosynthetic growth hormone. Acta Paediatr Scand Suppl. 1986;325:13–8. doi: 10.1111/j.1651-2227.1986.tb10357.x. [DOI] [PubMed] [Google Scholar]
- 2.Wadhwa M, Skog AL, Bird C, Ragnhammar P, Lilljefors M, Gaines-Das R, Mellstedt H, Thorpe R. Immunogenicity of granulocyte-macrophage colony-stimulating factor (GM-CSF) products in patients undergoing combination therapy with GM-CSF. Clin Cancer Res. 1999;5:1353–61. [PubMed] [Google Scholar]
- 3.Gao SX, Zhang Y, Stansberry-Perkins K, Buko A, Bai S, Nguyen V, Brader ML. Fragmentation of a highly purified monoclonal antibody attributed to residual CHO cell protease activity. Biotechnol Bioeng. 2011;108:977–82. doi: 10.1002/bit.22982. [DOI] [PubMed] [Google Scholar]
- 4.Beatson R, Sproviero D, Maher J, Wilkie S, Taylor-Papadimitriou J, Burchell JM. Transforming growth factor-β1 is constitutively secreted by Chinese hamster ovary cells and is functional in human cells. Biotechnol Bioeng. 2011;108:2759–64. doi: 10.1002/bit.23217. [DOI] [PubMed] [Google Scholar]
- 5.Pavlovic M, Girardin E, Kapetanovic L, Ho K, Trouvin JH. Similar biological medicinal products containing recombinant human growth hormone: European regulation. Horm Res. 2008;69:14–21. doi: 10.1159/000111790. [DOI] [PubMed] [Google Scholar]
- 6.Capito F, Skudas R, Kolmar H, Stanislawski B. Host cell protein quantification by Fourier transform mid infrared spectroscopy (FT-MIR) Biotechnol Bioeng. 2013;110:252–9. doi: 10.1002/bit.24611. [DOI] [PubMed] [Google Scholar]
- 7.Schenauer MR, Flynn GC, Goetze AM. Identification and quantification of host cell protein impurities in biotherapeutics using mass spectrometry. Anal Biochem. 2012;428:150–7. doi: 10.1016/j.ab.2012.05.018. [DOI] [PubMed] [Google Scholar]
- 8.Bracewell DG, Smales CM. The challenges of product- and process-related impurities to an evolving biopharmaceutical industry. Bioanalysis. 2013;5:123–6. doi: 10.4155/bio.12.314. [DOI] [PubMed] [Google Scholar]
- 9.Guiochon G, Beaver LA. Separation science is the key to successful biopharmaceuticals. J Chromatogr A. 2011;1218:8836–58. doi: 10.1016/j.chroma.2011.09.008. [DOI] [PubMed] [Google Scholar]
- 10.Shukla AA, Hubbard B, Tressel T, Guhan S, Low D. Downstream processing of monoclonal antibodies--application of platform approaches. J Chromatogr B Analyt Technol Biomed Life Sci. 2007;848:28–39. doi: 10.1016/j.jchromb.2006.09.026. [DOI] [PubMed] [Google Scholar]
- 11.Nogal B, Chhiba K, Emery JC. Select host cell proteins coelute with monoclonal antibodies in protein A chromatography. Biotechnol Prog. 2012;28:454–8. doi: 10.1002/btpr.1514. [DOI] [PubMed] [Google Scholar]
- 12.Levy NE, Valente KN, Choe LH, Lee KH, Lenhoff AM. Identification and characterization of host cell protein product-associated impurities in monoclonal antibody bioprocessing. Biotechnol Bioeng. 2013 doi: 10.1002/bit.25158. In press. [DOI] [PMC free article] [PubMed] [Google Scholar]
- 13.Meleady P, Henry M, Gammell P, Doolan P, Sinacore M, Melville M, Francullo L, Leonard M, Charlebois T, Clynes M. Proteomic profiling of CHO cells with enhanced rhBMP-2 productivity following co-expression of PACEsol. Proteomics. 2008;8:2611–24. doi: 10.1002/pmic.200700854. [DOI] [PubMed] [Google Scholar]
- 14.Pascoe DE, Arnott D, Papoutsakis ET, Miller WM, Andersen DC. Proteome analysis of antibody-producing CHO cell lines with different metabolic profiles. Biotechnol Bioeng. 2007;98:391–410. doi: 10.1002/bit.21460. [DOI] [PubMed] [Google Scholar]
- 15.Hayduk EJ, Choe LH, Lee KH. A two-dimensional electrophoresis map of Chinese hamster ovary cell proteins based on fluorescence staining. Electrophoresis. 2004;25:2545–56. doi: 10.1002/elps.200406010. [DOI] [PubMed] [Google Scholar]
- 16.Champion KM, Arnott D, Henzel WJ, Hermes S, Weikert S, Stults J, Vanderlaan M, Krummen L. A two-dimensional protein map of Chinese hamster ovary cells. Electrophoresis. 1999;20:994–1000. doi: 10.1002/(SICI)1522-2683(19990101)20:4/5<994::AID-ELPS994>3.0.CO;2-N. [DOI] [PubMed] [Google Scholar]
- 17.Van Dyk DD, Misztal DR, Wilkins MR, Mackintosh JA, Poljak A, Varnai JC, Teber E, Walsh BJ, Gray PP. Identification of cellular changes associated with increased production of human growth hormone in a recombinant Chinese hamster ovary cell line. Proteomics. 2003;3:147–56. doi: 10.1002/pmic.200390023. [DOI] [PubMed] [Google Scholar]
- 18.Carlage T, Hincapie M, Zang L, Lyubarskaya Y, Madden H, Mhatre R, Hancock WS. Proteomic profiling of a high-producing Chinese hamster ovary cell culture. Anal Chem. 2009;81:7357–62. doi: 10.1021/ac900792z. [DOI] [PubMed] [Google Scholar]
- 19.Doneanu CE, Xenopoulos A, Fadgen K, Murphy J, Skilton SJ, Prentice H, Stapels M, Chen W. Analysis of host-cell proteins in biotherapeutic proteins by comprehensive online two-dimensional liquid chromatography/mass spectrometry. MAbs. 2012;4:24–44. doi: 10.4161/mabs.4.1.18748. [DOI] [PMC free article] [PubMed] [Google Scholar]
- 20.Silva JC, Gorenstein MV, Li GZ, Vissers JP, Geromanos SJ. Absolute quantification of proteins by LCMSE: a virtue of parallel MS acquisition. Mol Cell Proteomics. 2006;5:144–56. doi: 10.1074/mcp.M500230-MCP200. [DOI] [PubMed] [Google Scholar]
- 21.Valente KN, Schaefer AK, Kempton HR, Lenhoff AM, Lee KH. Recovery of Chinese hamster ovary host cell proteins for proteomic analysis. Biotechnol J. 2014;9:87–99. doi: 10.1002/biot.201300190. [DOI] [PMC free article] [PubMed] [Google Scholar]
- 22.Zubarev RA. The challenge of the proteome dynamic range and its implications for in-depth proteomics. Proteomics. 2013;13:723–6. doi: 10.1002/pmic.201200451. [DOI] [PubMed] [Google Scholar]
- 23.Tarrant RD, Velez-Suberbie ML, Tait AS, Smales CM, Bracewell DG. Host cell protein adsorption characteristics during protein A chromatography. Biotechnol Prog. 2012;28:1037–44. doi: 10.1002/btpr.1581. [DOI] [PubMed] [Google Scholar]
- 24.Shukla AA, Hinckley P. Host cell protein clearance during protein A chromatography: development of an improved column wash step. Biotechnol Prog. 2008;24:1115–21. doi: 10.1002/btpr.50. [DOI] [PubMed] [Google Scholar]
- 25.Wilson MR, Easterbrook-Smith SB. Clusterin binds by a multivalent mechanism to the Fc and Fab regions of IgG. Biochim Biophys Acta. 1992;1159:319–26. doi: 10.1016/0167-4838(92)90062-I. [DOI] [PubMed] [Google Scholar]
- 26.Dominguez R, Holmes KC. Actin structure and function. Annu Rev Biophys. 2011;40:169–86. doi: 10.1146/annurev-biophys-042910-155359. [DOI] [PMC free article] [PubMed] [Google Scholar]
- 27.Chennamsetty N, Voynov V, Kayser V, Helk B, Trout BL. Design of therapeutic proteins with enhanced stability. Proc Natl Acad Sci U S A. 2009;106:11937–42. doi: 10.1073/pnas.0904191106. [DOI] [PMC free article] [PubMed] [Google Scholar]
- 28.Tait AS, Hogwood CE, Smales CM, Bracewell DG. Host cell protein dynamics in the supernatant of a mAb producing CHO cell line. Biotechnol Bioeng. 2012;109:971–82. doi: 10.1002/bit.24383. [DOI] [PubMed] [Google Scholar]
- 29.Hogwood CE, Tait AS, Koloteva-Levine N, Bracewell DG, Smales CM. The dynamics of the CHO host cell protein profile during clarification and protein A capture in a platform antibody purification process. Biotechnol Bioeng. 2013;110:240–51. doi: 10.1002/bit.24607. [DOI] [PubMed] [Google Scholar]
- 30.Jin M, Szapiel N, Zhang J, Hickey J, Ghose S. Profiling of host cell proteins by two-dimensional difference gel electrophoresis (2D-DIGE): Implications for downstream process development. Biotechnol Bioeng. 2010;105:306–16. doi: 10.1002/bit.22532. [DOI] [PubMed] [Google Scholar]
- 31.Schenauer MR, Flynn GC, Goetze AM. Profiling the effects of process changes on residual host cell proteins in biotherapeutics by mass spectrometry. Biotechnol Prog. 2013;29:951–7. doi: 10.1002/btpr.1748. [DOI] [PubMed] [Google Scholar]
- 32.Reichert JM. Next generation and biosimilar monoclonal antibodies: essential considerations towards regulatory acceptance in Europe. February 3-4, 2011, Freiburg, Germany. MAbs. 2011;3:223–40. doi: 10.4161/mabs.3.3.15475. [DOI] [PMC free article] [PubMed] [Google Scholar]
- 33.Reichert JM, Beck A, Iyer H. European Medicines Agency workshop on biosimilar monoclonal antibodies: July 2, 2009, London, UK. MAbs. 2009;1:394–416. doi: 10.4161/mabs.1.5.9630. [DOI] [PMC free article] [PubMed] [Google Scholar]
- 34.Beck A, Reichert JM. Approval of the first biosimilar antibodies in Europe: a major landmark for the biopharmaceutical industry. MAbs. 2013;5:621–3. doi: 10.4161/mabs.25864. [DOI] [PMC free article] [PubMed] [Google Scholar]
- 35.Geromanos SJ, Vissers JP, Silva JC, Dorschel CA, Li GZ, Gorenstein MV, Bateman RH, Langridge JI. The detection, correlation, and comparison of peptide precursor and product ions from data independent LC-MS with data dependant LC-MS/MS. Proteomics. 2009;9:1683–95. doi: 10.1002/pmic.200800562. [DOI] [PubMed] [Google Scholar]
- 36.Cottrell JS. Protein identification using MS/MS data. J Proteomics. 2011;74:1842–51. doi: 10.1016/j.jprot.2011.05.014. [DOI] [PubMed] [Google Scholar]
- 37.Elias JE, Haas W, Faherty BK, Gygi SP. Comparative evaluation of mass spectrometry platforms used in large-scale proteomics investigations. Nat Methods. 2005;2:667–75. doi: 10.1038/nmeth785. [DOI] [PubMed] [Google Scholar]
Associated Data
This section collects any data citations, data availability statements, or supplementary materials included in this article.