Abstract
While many antibody therapeutics are formulated at low concentration (~10–20 mg/mL) for intravenous administration, high concentration (> 100 mg/mL) formulations may be required for subcutaneous delivery in certain clinical indications. For such high concentration formulations, product color is more apparent due to the higher molecular density across a given path-length. Color is therefore a product quality attribute that must be well-understood and controlled, to demonstrate process consistency and enable clinical trial blinding. Upon concentration of an IgG4 product at the 2000 L manufacturing scale, variability in product color, ranging from yellow to red, was observed. A small-scale experimental model was developed to assess the effect of processing conditions (medium composition and harvest conditions) on final bulk drug substance (BDS) color. The model was used to demonstrate that, for two distinct IgG4 products, red coloration occurred only in the presence of disulfide reduction-mediated antibody dissociation. The red color-causing component was identified as vitamin B12, in the hydroxocobalamin form, and the extent of red color was correlated with the cobalt (vitamin B12) concentration in the final pools. The intensity of redness in the final BDS was modulated by changing the concentration of vitamin B12 in the cell culture media.
Keywords: monoclonal antibody, bioprocess, high concentration, color, Chinese hamster ovary
Introduction
Monoclonal antibody (mAb) therapeutics are used to treat a wide array of disease indications, including oncology, inflammation, and autoimmune disorders. Antibody therapeutics can be formulated at low mAb concentration for intravenous administration, but for certain indications, injectable drug products are advantageous because they enable reduced dosing frequency and patient self-administration. The high concentration formulations required for injectable products, however, pose additional development challenges related to manufacturability and product stability,1,2 and further complexity can arise due to variability in bulk drug substance (BDS) color.
Formulated mAb products typically appear colorless to pale yellow at low concentration. The International Conference on Harmonization (ICH) guidelines suggest “a qualitative statement about the…color of the new drug substance” in the release specification,3 and as such, minimal resources are typically invested in quantifying and controlling final product color. At high concentrations (> 100 mg/mL), however, variation in color becomes more apparent.4 In addition to suggesting a lack of process control, color variability can affect clinical development, particularly the ability to blind clinical trials involving placebo controls. The trend toward high concentration formulations thus necessitates the capability to control product color via bioprocess steps, like other critical quality attributes.
Several culture medium components are colored in solution, including vitamins B2 (riboflavin),5,6 B6, and B12.7 Other medium components such as iron and copper can vary in color depending on oxidative state and the presence of other ions, and can interact with proteins to form highly stable complexes that remain intact throughout downstream processing.8 It has been shown that decreasing the medium concentrations of B-vitamins and iron reduced BDS “total color,” defined as the linear distance from water on a 3-dimensional color quantification spectrum.4 However, the contributions of individual components to specific color hues have not yet been decoupled. In addition, the nature of the interaction between mAbs and color-causing components remains to be elucidated, though the interaction is clearly strong enough to allow co-elution with the mAb through a multi-step purification process exploiting affinity and charge adsorption, as well as membrane-based ultrafiltration and diafiltration (UFDF).
The inter-chain disulfide bonds of mAbs are susceptible to reduction under certain processing conditions, resulting in antibody fragments in the final product (heavy chain, light chain and incomplete combinations of heavy and light chains). The mAb reduction has been attributed to mechanically-induced cell lysis during the harvest step, followed by room temperature storage of the harvested cell culture fluid.9 Upon cell lysis, intracellular contents are released into the mAb-containing culture fluid, and it has been shown that thioredoxin and thioredoxin reductase enzymes act in the presence of nicotinamide adenine dinucleotide phosphate (NADPH) to reduce the antibody disulfides.10 This phenomenon is not typically observed during small scale processing, due to low-shear harvest conditions, and risk-mitigation strategies have been described for large scale manufacturing where high-shear harvest conditions are more frequently encountered.9
During development and material supply for an early-stage clinical program, mAb X was produced in a fed-batch process at different sites and various bioreactor scales. Some BDS lots were colorless to pale yellow at low and high concentrations, while others exhibited red color of varying intensity when concentrated to > 100 mg/mL. To identify process modifications that would improve color consistency across mAb BDS lots, a three-pronged approach was taken. First, basal and feed media formulations were modified to decrease the concentrations of potential color causing components without affecting productivity or product quality. Second, a small-scale process model was developed to elucidate the effect of harvest process conditions and medium components on bulk coloration. Finally, analytical methods were employed to identify medium components that caused the red-colored product. The models and methods were used to assess coloration in mAb X and a second IgG4 product, mAb Y, which had otherwise exhibited consistent, light yellow colored BDS at high concentration under standard processing conditions.
Results
Color quantification
Colorimeter data enabled quantitative distinction between red and yellow final pools in the b* and a* two-dimensional space (Fig. 1), eliminating the potential for bias associated with qualitative assessment. Yellow samples were similar in color to the EP brown color standards B4 to B6, whereas red samples varied in redness (a* value) across the entire range covered by the EP red color series R2 to R7. The vitamin B12 dilution series showed that a concentration range of 2.4x10⁻³ to 4x10⁻² mg/ml had a* values that bracketed the red mAb sample a* values. Vitamin B12 standards with concentrations of 6.0x10⁻⁴ to 2.0x10⁻³ mg/mL were interpreted as water (a* values of -0.2 to 0.8). The lowest vitamin B12 concentration interpreted as red, both quantitatively (a* = 2.2) and by visual inspection, was 5.0x10⁻³ mg/mL. Finally, over the range of 6.0x10⁻⁴ to 4x10⁻² mg/mL vitamin B12, a* values were linearly correlated with vitamin B12 concentration (R2 = 0.999).
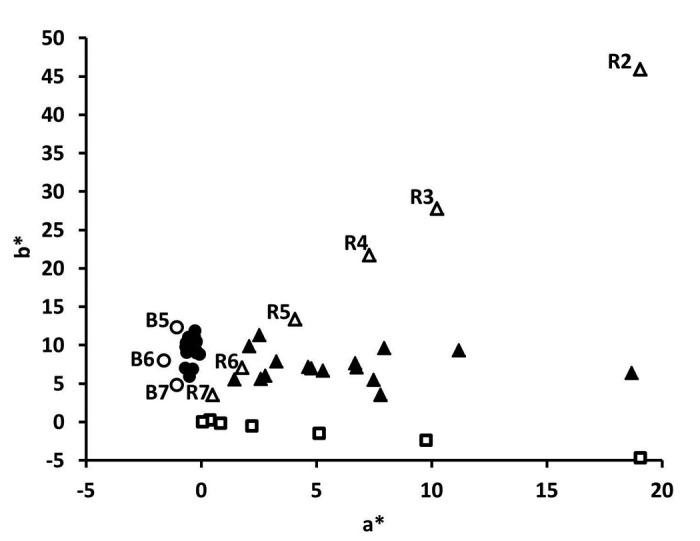
Figure 1. Two-dimensional colorimetry plot for yellow (●) and red (▲) BDS and experimental final pool samples, as well as brown (B, ○) and red (R, Δ) EP color standard series, and vitamin B12 standards with concentrations ranging from 6x10⁻⁴ to 4x10⁻² mg/mL (□).
Media development
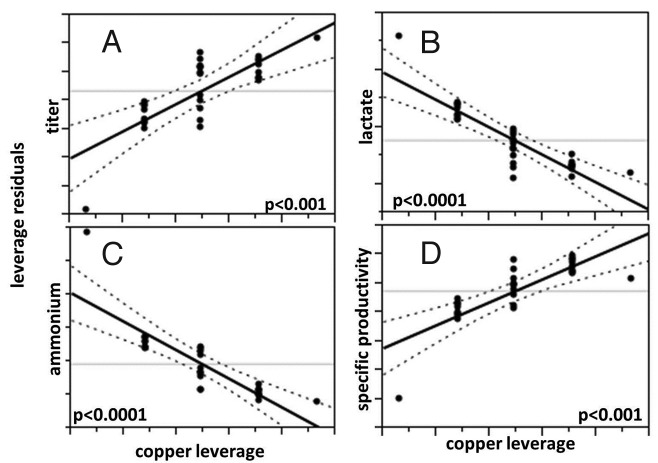
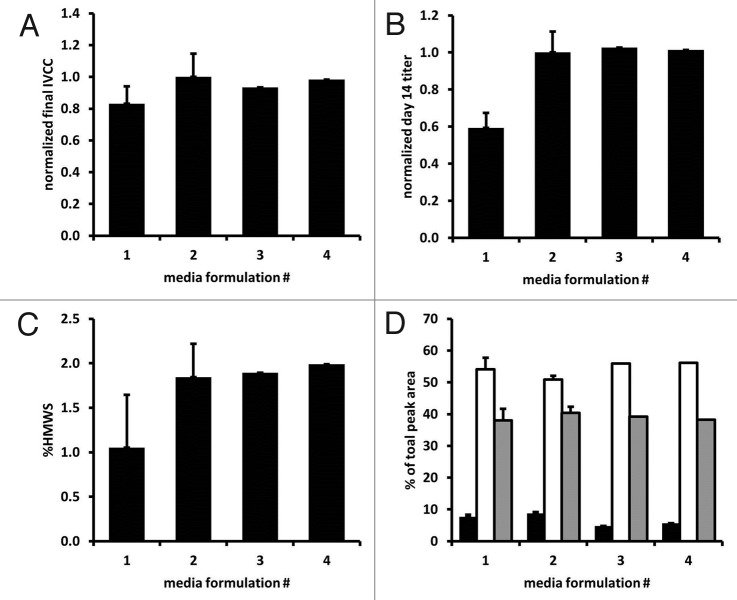
Of the components tested in the shake flask medium screen, only copper concentration significantly affected final titer, primarily via reduced lactate and ammonium accumulation and increased specific productivity (Table 1, Fig. 2). In addition, higher growth (integrated viable cell concentration, IVCC) was correlated with higher vitamin B12 and iron concentrations, and higher viability was correlated with higher vitamin B12 concentration (Table 1). Thus, two final custom basal media formulations were designed that, when used with a custom feed media, resulted in processes with the highest tested concentration of copper and the lowest tested concentrations of iron, vitamin B2 and vitamin B6. These two final combinations of basal and feed media (named media #3 and media #4 in color assessment studies, differing only in the vitamin B12 concentrations) resulted in acceptable culture growth, productivity and product quality in 2 L bioreactor cultures (Fig. 3). Cell culture fluid (CCF) from these 2 L cultures was used alongside media #1 and #2 in the color assessment experiments (see Table 2 and Methods section).
Table 1. Results of shake flask medium component screen for effects on cell culture performance.
| Medium Component | Culture Performance Parameter (Day 14 Value) | |||||
|---|---|---|---|---|---|---|
| Specific Productivity | Viability | Lactate | Ammonium | Titer | IVCC | |
| Copper | 0.0002* | 0.76 | < 0.001* | < 0.0001* | 0.0003* | 0.28 |
| Iron | 0.11 | 0.63 | 0.12 | 0.04* | 0.27 | 0.01* |
| Vitamin B2 | 0.82 | 0.77 | 0.49 | 0.66 | 0.72 | 0.80 |
| Vitamin B6 | 0.48 | 0.42 | 0.21 | 0.01* | 0.55 | 0.98 |
| Vitamin B12 | 0.09 | 0.04* | 0.94 | 0.66 | 0.31 | 0.01* |
For each culture component, the probability of no impact (p-value) is shown for each culture performance parameter. *Effect was considered statistically significant for p-values < 0.05.
Figure 2. Leverage plots demonstrating the effect of copper concentration on final titer (A), final lactate (B), final ammonium (C), and average specific productivity (D) in medium component screen shake flask cultures. Solid black: line of fit; dotted black: confidence lines (α = 0.05); and gray: mean of Y leverage residuals.
Figure 3. Cell culture performance in 2 L bioreactors for media #3 and media #4 relative to typical performance of media #1 (n = 7) and media #2 (n = 7). (A) Final integral viable cell concentration (IVCC), (B) final titer, (C) relative presence of high molecular weight species, and (D) relative charge heterogeneity: acidic (▀), main (□), and basic (▀) species.
Table 2. Summary of processes tested in small scale color assessment model.
| mAb | Media # | Relative [Vitamin B12] | Notes |
|---|---|---|---|
| X | 1 | +++ | • Initial mAb X process media • Variable color observed in manufacturing BDS lots |
| 2 | ++++ | • New mAb X process media • Baseline process for shake flask screen of color-causing components |
|
| 3 | + | • Custom media formulations developed based on media screen • Reduced iron, vitamin B2, vitamin B6, and vitamin B12 relative to media #2 |
|
| 4 | ++ | ||
| Y | 1 | +++ | • mAb Y process • Pale yellow for 2000 L manufacturing BDS lots |
Table note: Vitamin B12 concentrations are not linearly scaled.
Effect of mAb reduction
Because the red-colored large scale manufacturing BDS lots (from the problem statement) also exhibited significant disulfide reduction, we hypothesized that the two phenomena were linked. The small-scale color assessment model was used to confirm that indeed red color occurred only in the presence of mAb reduction for mAb X (in both media #1 and media #2) and mAb Y (Fig. 4). Across all final pools included in this study, positive redness values were observed only in the presence of antibody reduction (Fig. 5). Since the red colored BDS lots were produced in single-use bioreactors, it was also proposed that the red color could be unique to culture in disposables, due to film material components or light exposure during culture and harvest. However, red colored product was reproduced from glass and stainless steel bioreactors using the small-scale model as well. When iodoacetic acid was added as an alkylating agent immediately following homogenization, mAb reduction was prevented (92% intact by microchip capillary electrophoresis) and the product remained yellow (a*150 = -0.4, Fig. 4D). However, when the alkylating agent was added to the reduction-promoting harvested cell culture fluid (RP-HCCF) upon completion of a 7-d storage hold, the mAb remained completely dissociated (0% of product was ~150 kDa) and was intensely red in color (a*150 = 12, Fig. 4H). When a yellow final pool from C-HCCF was reduced completely to heavy and light chain components in the absence of medium components (i.e., by addition of dithiothreitol to final pools), the solution remained yellow. When reduced mAb was generated and isolated from reducing conditions prior to incubation with hydroxocobalamin, it remained red after buffer exchange to remove free hydroxocobalamin (a* = 39 without alkylation, a* = 56 with alkylation), whereas non-reduced BDS treated with hydroxocobalamin was yellow after buffer exchange (a* = 0).
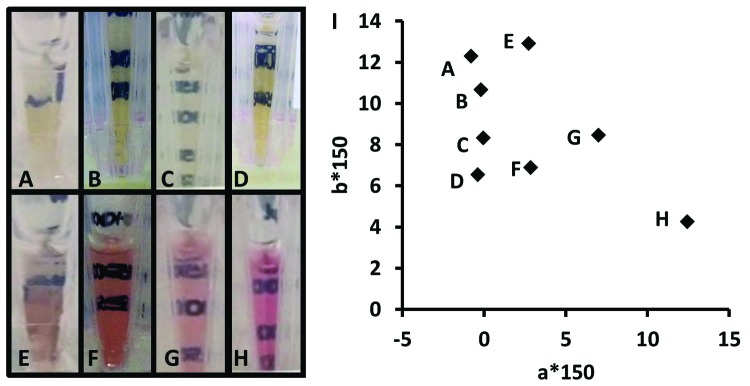
Figure 4. Final pools from color assessment model for mAb X/media #1 (A and E), mAb X/media #2 (B and F), and for mAb Y/media #1 (C and G) generated from control harvest and storage conditions (A-C) or reduction-promoting harvest and storage conditions (D–H). Iodoacetic acid added before (D) or after (H) reduction-promoting HCCF storage. Antibody concentrations were 150 ± 40 mg/mL (mean ± SD). (I) Two-dimensional colorimetry plot for all samples; data point labels indicate corresponding image at left.
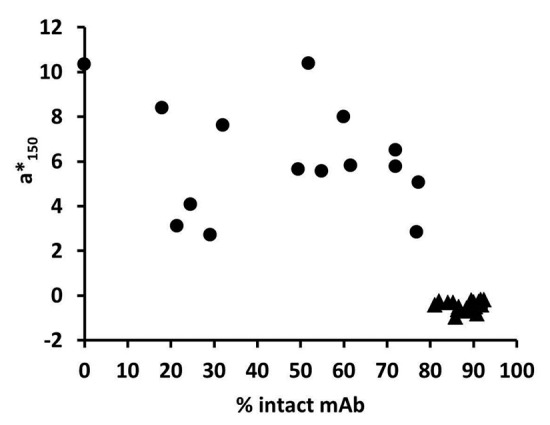
Figure 5. Redness vs. antibody reduction (quantified as % intact) for all red (●) and yellow (▲) final pools from small scale experimentation.
Light exposure
Light exposure during control-harvested cell culture fluid (C-HCCF) storage did not lead to detectable red color (a*150 values of -0.5 and 0.9 with and without light exposure; Fig. 6A, B). Similarly, preventing light exposure during RP-HCCF storage did not prevent red color formation (a*150 values of 9.6 and 7.0 with and without light exposure; Fig. 6C and D). As mentioned above, preventing light exposure of CCF (in 2000 L stainless steel bioreactor) also did not prevent red color when reduction was induced at harvest.
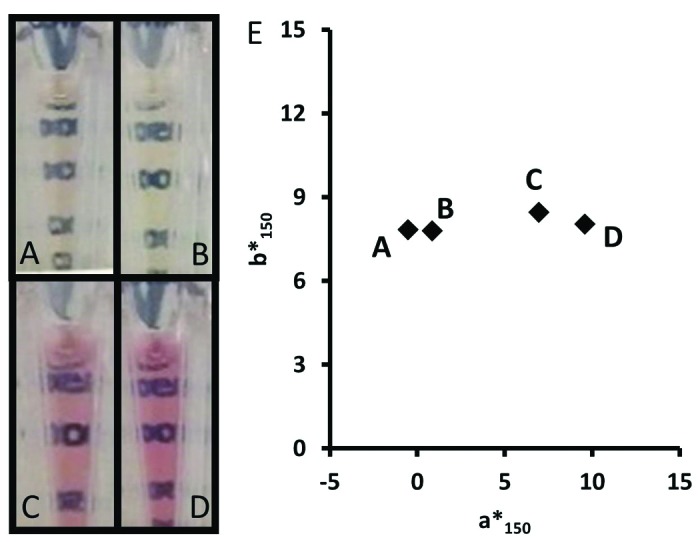
Figure 6. Final pools for mAb Y/media #1 generated from C-HCCF (A and B) or RP-HCCF (C and D) without (A and C) or with (B and D) light exposure during 7 d of HCCF storage. Antibody concentrations in final pools were 172 ± 3 mg/mL (mean ± SD). (E) Two-dimensional colorimetry plot for all samples; data point labels indicate corresponding image at left.
Effect of vitamin B12 in culture medium and HCCF
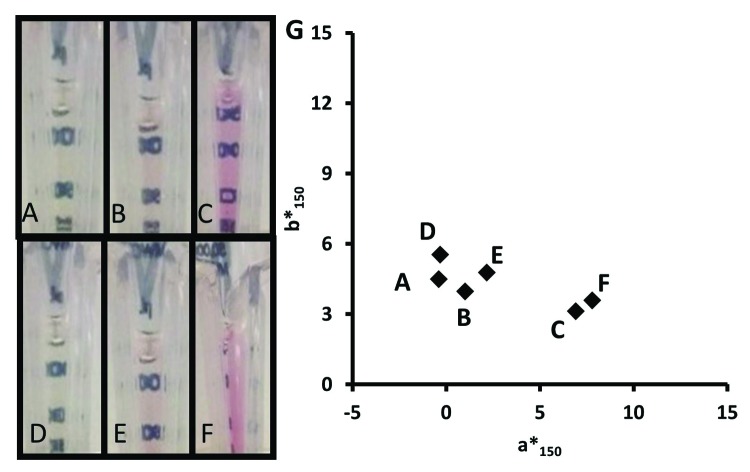
For mAb X in media #3 and media #4 (which have lower relative vitamin B12 concentrations than in medias #1 and #2), final pools from C-HCCF were yellow (a*150 = -0.4, -0.3; respectively; Fig. 7A and D), and pools from RP-HCCF slight red (a*150 = 1.0, 2.2) when vitamin B12 was not added to the HCCF (Fig. 7B and E). When 12 mg/L vitamin B12 was added prior to the RP-HCCF storage step, however, final pools were more intensely red (a*150 = 6.3 for process media #3, 7.8 for media #4) (Fig. 7C and F). Conversely, it was confirmed that addition of vitamin B12 to C-HCCF prior to storage did not result in red color in the final pools (a*150 = -0.3). For mAb X from media #2, which already contained a higher concentration of vitamin B12, adding vitamin B12 prior to RP-HCCF hold further increased final pool redness, with a*150 values of 10.4 and 5.6 with and without added vitamin B12, respectively.
Figure 7. Final pools for mAb X/media #3 (A–C), mAb X/media #4 (D–F) generated from control harvest and storage conditions (A and D) or reduction-promoting harvest and storage conditions (B, C, E and F) with (C and F) or without (A, B, D and E) added vitamin B12 prior to HCCF storage. Antibody concentrations were 182 ± 21 mg/mL (mean ± SD). (G) Two-dimensional colorimetry plot for all samples; data point labels indicate corresponding image at left.
Red color correlated with cobalt concentration
Colorimeter redness value a* was correlated directly to the concentration of cobalt (surrogate for vitamin B12) in the final pools, across all tested samples including both mAbs and from both C-HCCF and RP-HCCF (Fig. 8A). Although copper and iron were detected at low levels (< 0.3 μg/ml) in some final pools, their concentrations did not correlate with redness value. In addition, colorimeter yellowness value b* value did not correlate with the concentration of any of the metals assayed. Notably, mAb Y (media #1) contained more cobalt per mAb than did mAb X (media #2), even though vitamin B12 concentration was lower in media #1 than in medium #2 (Fig. 8B). For mAb X, however, the amount of cobalt remaining in the final pool was dependent on the concentration of vitamin B12 in the culture media (i.e., final pools from media #2 had more vitamin B12 than final pools from media #4, which had more than final pools from media #3). Vitamin B12 concentrations, calculated based on a mass ratio of 23 g hydroxocobalamin per 1 g cobalt, were 0–4 mg/kg mAb for yellow samples, and 50–120 mg/kg for red samples.
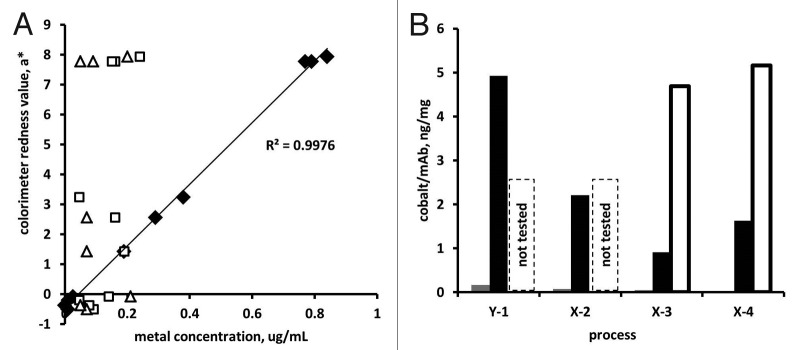
Figure 8. (A) For final pools from mAb X and mAb Y, colorimeter redness value correlated well with cobalt concentration (♦) but not with copper (□) or iron (Δ). Linear fit and R2 value are for a* vs. cobalt concentration. (B) Cobalt concentration in final pools generated from C-HCCF (▀), RP-HCCF (▀), and RP-HCCF with added vitamin B12 (□).
Vitamin B12 presence in red product
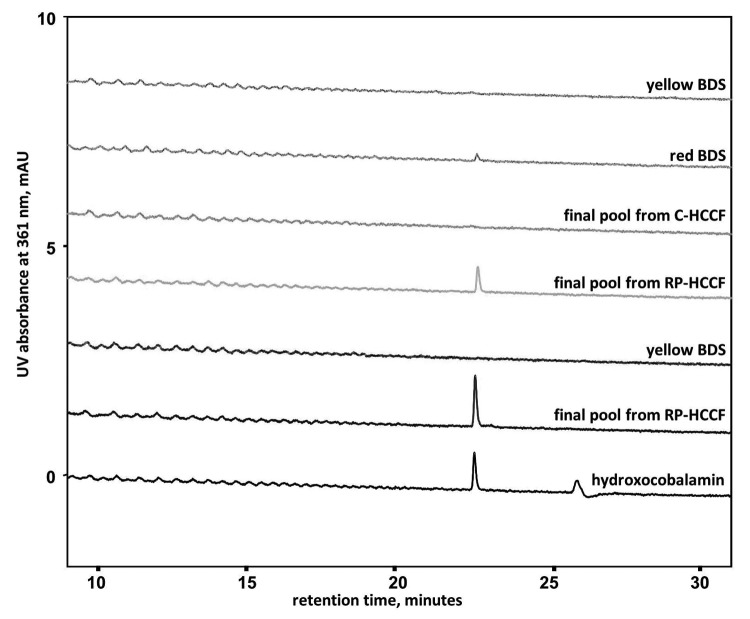
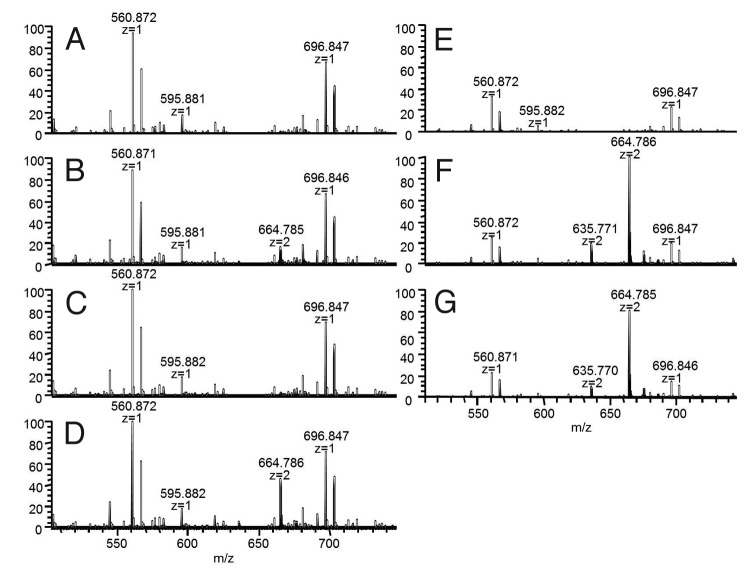
For mAb X, the HPLC UV absorbance at 361 nm (absorbance maximum of vitamin B12) showed a peak at a retention time of 22.5 min for red-colored BDS from large-scale manufacturing and final pools from RP-HCCF, but not for yellow-colored BDS or final pools from C-HCCF. Similarly for mAb Y, yellow-colored BDS did not contain vitamin B12 whereas RP-HCCF final pools did (Fig. 9). The retention time of the vitamin B12 on the HPLC UV chromatogram was the same regardless of whether the mAb was treated with trypsin, endoproteinase Glu-C or without any enzyme, suggesting that the vitamin B12 is not bound to a peptide at the time of elution (data not shown for enzyme-treated samples). The mass to charge ratio (m/z) of this peak eluting at 22.5 min was determined to be 664.785, z = 2; the same m/z observed with a hydroxocobalamin standard (Fig. 10) and as reported previously.11
Figure 9. HPLC chromatograms for red and yellow colored mAb X (gray lines) and Y (black lines) compared with a hydroxocobalamin standard. Peak at ~26 min retention time for hydroxocobalamin standard is due to column wash step.
Figure 10. Full mass scan for the UV 361nm peak at 22.5 min for mAb X and mAb Y: mAb X yellow BDS (A), mAb X red BDS (B), final pools from mAb X C-HCCF (C), final pools from mAb X RP-HCCF (D), mAb Y yellow BDS (E), final pools from mAb Y RP-HCCF (F), hydroxocobalamin standard (G).
Discussion
The small-scale experimental model developed here enabled high-throughput qualitative and quantitative assessment of red color-causing components and process conditions. For these two mAbs, cation exchange pool color was representative of the color of final BDS, whereas concentrated protein A pool color did not directly correlate to that of the fully purified product (data not shown). This suggests that some color-causing components, perhaps not bound or weakly interacting with the mAb, are removed during the cation exchange step, in contrast with a previous report where protein-A pools were representative of final purified product color.4 The final pool concentrations used in this study were high (~150 mg/ml) to enable distinction among processing conditions even at the small path lengths used for color analysis. The linearity of the relationship between vitamin B12 concentration and a* value over the range of vitamin B12 concentrations present in the final pools (6x10⁻⁴ to 2x10⁻² mg/mL) enabled use of the normalized redness value (a*150) to quantitatively compare redness across a large range of mAb concentrations in the final pools.
Vitamin B12 was identified as the medium component causing red colored product, as it was confirmed to be present by liquid chromatography/mass spectroscopy (LC/MS) and inductively coupled plasma (ICP)/MS in red-colored final pools/BDS, but not yellow colored BDS for both mAbs. In addition, the cobalt concentration (surrogate for vitamin B12 concentration) in the final pool was directly correlated with the redness value across all samples assayed by ICP/MS, further supporting the direct relationship between vitamin B12 and red color. Cyanocobalamin is the vitamin B12 form typically included in cell culture media as a cofactor required for DNA synthesis. Under cell culture conditions, however, cyanocobalamin is readily converted to hydroxocobalamin due to light exposure,12 with up to 80% converted after 10 d in culture.13 While both forms of vitamin B12 are red-colored,7 LC/MS results showed that the form remaining in red colored mAb pools is hydroxocobalamin, consistent with a previous report for an IgG2 product.13 Since the majority of the experimental pools were from glass bioreactors exposed to light for the 14 d culture duration, it can be assumed that the hydroxocobalamin form was present in both C-HCCF and RP-HCCF; therefore, hydroxocobalamin availability alone was not sufficient to cause red color for these mAbs. This was also confirmed when reduced mAb, isolated from reducing conditions, enabled red product when incubated with hydroxocobalamin, whereas non-reduced mAb did not. Likewise, light exposure alone during storage of C-HCCF did not induce red color for either product.
For both mAb X (4 separate medium formulations/processes) and mAb Y, mAb reduction in the presence of culture medium components was required for vitamin B12 to cause red colored product. It has been shown previously that one pass through a homogenizer is sufficient to achieve complete cell lysis, releasing thioredoxin and thioredoxin reductase enzymes that, along with their cofactors, reduce inter-chain disulfides to cause mAb dissociation.10 Addition of an alkylating agent to RP-HCCF prior to storage prevented mAb dissociation, likely via alkylation of the free thiols on the thioredoxin and thioredoxin reductase before they had time to reduce the mAb. While the kinetics of this mAb reduction mechanism can vary, this finding of non-instantaneous mAb dissociation following homogenization is consistent with in vitro mAb reduction results demonstrating that significant dissociation became apparent between 0.5 to 19 h post-incubation.10 Alkylation upon completion of RP-HCCF storage, on the other hand, resulted in permanent reduction of the mAb into heavy and light chains, without any re-formation of larger mAb fragments, and the final pool color was intensely red. Together, these alkylation experiments suggest that red colored product was enabled by enzyme-induced antibody reduction and not by any other conditions created by the “RP-HCCF” harvest/storage conditions. Furthermore, in the experiment designed to decouple mAb reduction from reducing conditions, reduce mAb turned red following treatment with hydroxocobalamin, whereas non-reduced mAb did not. This proves that reduced mAb enables hydroxocobalamin-mAb binding, independent of reducing conditions. It should be noted that other reports of intensely-colored mAb BDS have not been correlated with mAb reduction,4,13 suggesting that other mechanisms can lead to co-purification of color-causing components with mAb products as well.
Hydroxocobalamin has been reported to react with thiol compounds to form weak coordination complexes.14 However, when reduced mAb was alkylated, rendering free thiols unavailable, hydroxocobalamin still co-purified with the mAb to create red color. In fact, the red color was more intense (higher a* value) for alkylated than non-alkylated mAb. Therefore, we propose that vitamin B12 non-covalently associates with a region of the mAb that is solvent-exposed when the mAb is reduced, rather than via coordination with free thiol groups. The higher vitamin B12 per mAb for reduced mAb Y compared with reduced mAb X could be due to conformational differences between the two IgG4 molecules that enable more vitamin B12 binding to mAb Y. While the exact binding mechanism remains unknown for both mAbs, the mAb-vitamin B12 bond is weak enough to be broken by the low pH, denaturing liquid chromatography assay conditions, but strong enough to remain intact during typical downstream processing conditions.
Since disulfide reduction-mediated mAb dissociation can be prevented at the manufacturing scale using published methods,9 the risk of red colored product due to this phenomenon can be greatly minimized. We have also shown that the quantity of vitamin B12 in the final pool (and therefore final pool color) can also be modulated via cell culture media vitamin B12 concentration, without affecting culture performance or product quality. Adding vitamin B12 to the HCCF just prior to storage restored the intense red color for the two lower vitamin B12 processes (media #3 and media #4) in the presence of mAb reduction, but did not produce red color for control samples. Also, it was shown that insufficient quantities of vitamin B12 remain in control final pools (< 0.02 μg/mL cobalt by ICP/MS) to cause color even if mAb reduction is induced at this stage of purification. While it has been demonstrated that simultaneously reducing the concentrations of several medium components, including iron and B vitamins, can reduce total color (resulting from all hues), we believe this is the first result isolating the roles of mAb reduction and vitamin B12 in causing red colored product, and demonstrating that this phenomenon is independent of culture vessel type and light exposure.
In conclusion, the color of mAb therapeutics must be consistent to demonstrate process control, and to enable blinded clinical study designs. We have developed a small-scale model to assess the effect of process conditions on final product color. The model was used to demonstrate that for two distinct IgG4 mAbs, the final product solution was yellow in the absence of mAb reduction, and red in the presence of mAb reduction. Vitamin B12 was identified as the component causing red color for both mAbs. Furthermore, the red color intensity can be minimized by reducing the medium concentration of vitamin B12, and eliminated by preventing mAb dissociation.
Materials and Methods
Media development
First, a medium screen was conducted using mAb X production cultures in 500 mL Erlenmeyer flasks to assess the effect of five suspected color-causing components (copper, iron, vitamin B2, vitamin B6, and vitamin B12) on cell culture process performance (growth, lactate accumulation, productivity, and final viability). Color was not assessed during the media screen. Using 32 combinations of basal and feed media with a central composite statistical design, the experiment covered five different concentrations of each component. The highest concentration of each equal to that in media #2 (described below). The study was designed for statistical detection (with 95% confidence) of all main and 2-factor effects.
Based on the media screen results (see results section), two final custom medium formulations were developed to minimize color variability without affecting productivity. These final formulations (media #3 and media #4) were tested for mAb X in 2 L bioreactors and productivity, product quality, and mAb color were assessed.
Cell culture for color assessment model
Two Chinese hamster ovary (CHO) cell lines expressing two different IgG4 mAbs (X and Y) were developed from the same host. Seed trains were maintained in Erlenmeyer flasks (CLS431401–25EA, Sigma Aldrich) in commercially-available, chemically-defined medium (12681–011, Life Technologies, Inc.) without selective pressure in humidified, 37 °C incubators with 7% CO2. Fed-batch production cultures were also conducted in several chemically-defined medium formulations, described below, in 2 L glass (Applikon Biotechnology, Inc.), 100 L single-use (Thermo Scientific, Inc.), and 2000 L stainless steel bioreactors (B. Braun Biotech, Inc.). Temperature, pH, and dissolved oxygen (DO) were monitored and controlled using a DeltaV control system (Bionet, Broadley James, Inc.). Culture pH was controlled with liquid sodium carbonate and carbon dioxide gas additions, and DO was controlled with air and oxygen sparge. On day 14 post-inoculation, CCF was removed from the bioreactor via peristaltic pump and aliquoted as needed for experimental harvest conditions. In the case of 2000 L cultures in stainless steel bioreactors, CCF was obtained via gravity-driven flow through a sample port.
For mAb X, 4 different processes (medium formulations) were tested, including the process from the original problem statement (media #1), a process optimized for productivity (media #2), and the two custom medium formulations developed to minimize color variability as described above (media #3 and media #4). In contrast, mAb Y was produced only in media #1. Table 2 summarizes the media formulations and relative vitamin B12 concentrations used for color assessment for each mAb.
Harvest
Control harvest
CCF was aliquoted into 500 mL conical centrifuge containers. Cells were removed by centrifugation at 3270 rcf for 10 min at 4 °C in a bench top centrifuge (Allegra X-12R, Beckman Coulter) followed by filtration through a 1000 cm2, 0.8/0.2 µm filter (12992, Pall) to create C-HCCF.
Reduction-promoting harvest
CCF was processed through a homogenizer (110L, Microfluidics Inc.) at 9000 psi, at a flowrate of ~400 mL/min to induce cell lysis, which leads to mAb dissociation.10 Complete cell lysis was confirmed by a lactate dehydrogenase assay (11644793001, Roche). Cellular debris was removed from the resultant pool by centrifugation at 3270 rcf for 25 min at 4 °C, and supernatant was pumped through 1000 cm2, 0.8/0.2 µm filters (12992, Pall) to create RP-HCCF.
Harvested Cell Culture Fluid Storage and Experimental Treatments
Harvested cell culture fluid (HCCF) aliquots were stored in 500 mL PETG bottles (WU-06254–40, Thermo Scientific) or custom 500 mL bottles (Optimum Bioprocessing), under reducing conditions for RP-HCCF (21 °C, nitrogen gas flow through headspace at < 5 mL/min) or control conditions for C-HCCF (2–8 °C, air in headspace without gas exchange). Reducing conditions were chosen to mimic a manufacturing scale HCCF hold step without control of temperature or dissolved oxygen. HCCF aliquots were stored 3 to 7 d prior to purification.
Light exposure
To assess the effect of light exposure during HCCF storage, certain aliquots were protected from light exposure via complete coverage of the storage bottle with aluminum foil. These HCCF aliquots were stored for 7 d prior to purification.
Vitamin B12 added prior to storage
Selected aliquots were stored with 12 mg/L vitamin B12 in the cyanocobalamin form (V6629–1G, Sigma Aldrich) added after completion of harvest from a 0.5 M stock solution in water for injection (WFI). These HCCF aliquots were stored for 7 d prior to purification.
Effect of alkylation
Certain aliquots were treated with 14 mM iodoacetic acid (I4386–10G, Sigma Aldrich) from a 0.5 M stock solution in 0.5 M NaOH (from 10 N, 5000–07, JT Baker), either before starting or after completion of storage. HCCF aliquots were stored for 7 d prior to purification.
Purification
HCCF samples were purified by bench-scale affinity column chromatography using a protein A resin (GE Healthcare), standard protein A buffers, and gravity-drip columns. The resultant pools were titrated to pH 5.0 and then processed via cation exchange chromatography (Life Technologies), with proprietary buffers and gravity-drip columns. These pools were then concentrated to ~150 mg/mL using 50 kDa molecular weight cutoff centrifugal filters (UFC905024, Millipore), and buffer-exchanged into proprietary formulation buffer without surfactant to create “final pools” for color analysis and mAb concentration quantification. For qualitative color observation, final pools were imaged prior to removal from filtration devices. Final pools were then transferred from the filtration device into microcentrifuge or cryo-storage tubes and stored at 2–8 °C prior to quantification of mAb concentration and color.
Microchip Capillary Electrophoresis
Microchip capillary electrophoresis (2100 Bioanalyzer, Agilent Technologies) was used to assess mAb reduction in the protein A pools. The pools were analyzed using a Protein 230 Kit and protocol (5067–1517, Agilent Technologies), under non-reducing conditions. Digital images were generated and analyzed to quantify relative abundance of intact mAb (~150 kDa mass) as a percent of all detected molecular weight sizes.
Antibody Concentration and Colorimetry
For the final pools, mAb concentration was determined using an UV spectrophotometer (8453, Agilent Technologies) with a gravimetric-based dilution method. Color was quantified using a colorimeter (UltraScan PRO, Hunter Labs) with 400 µL samples across a 10 mm path length. Color was also quantified in the same way for European Pharmacopoeia (EP) color standards (90232, Sigma Aldrich) of the red (R2-R7) and brown (B5-B7) series. Positive values for the colorimeter output value a* describe redness, and positive b* values describe yellowness.15 Color was also assessed for vitamin B12 standards created by dissolving hydroxocobalamin (157408, MP Biomedicals) in phosphate buffered saline, with concentrations ranging from 6x10⁻⁴ to 4x10⁻² mg/mL. Since colorimeter a* values increased linearly with mAb concentration for a given sample, the a* value expected at 150 mg/mL, a*150, was computed using Equation 1 to enable quantitative comparison of redness across samples.
For dilution series of individual samples, the calculated a*150 varied by at most two a* units over the mAb concentration range of 50 to 250 mg/mL, or ~0.01 a* units per 1 mg/mL mAb.
Liquid Chromatography/Mass Spectrometry
Red- and yellow-colored BDS from 2000 L lots for mAb X, yellow-colored BDS from 2000 L lots for mAb Y and red-colored final pools from the small scale model for mAb X and mAb Y were assessed for the presence of vitamin B12 using liquid chromatography and mass spectrometry. Samples were diluted to a mAb concentration of 0.75 mg/mL in 25 mM Tris and 2 mM CaCl2 at pH 8.2 and incubated at 37 °C for 1 h before being treated with 10% trifluoroacetic acid in water (28901, Thermo) to a final concentration of 0.25% trifluoroacetic acid. Vitamin B12 was separated from the protein by high performance liquid chromatography (HPLC) (1200, Agilent) using a Zorbax SB300-C8 reverse phase chromatography column, (4.6 mm x 150 mm, Agilent, 863973–906) with a gradient elution consisting of mobile phase A: 0.1% trifluoroacetic acid in LC/MS grade water (34978, Fluka) and mobile phase B: 0.08% trifluoroacetic acid (28901, Thermo) in LC/MS grade acetonitrile (34967, Fluka). The gradient elution was executed at 0.75 mL/min as follows: 0.0–5.0 min, isocratic at 1% mobile phase B; 5.0–30.0 min, 1–15% mobile phase B; 30.0–36.0 min, column wash at 95% mobile phase B; 36.0 to 45.0 min return to initial conditions and re-equilibration. UV (UV) detection was set to 361 nm, the maximum absorption wavelength of vitamin B12 forms (cyanocobalamin at 361 nm and hydroxocobalamin at 355 nm),11,12 and where there is minimal absorption by protein. The LC flow was directed to a mass spectrometer (Orbitrap XL, Thermo Scientific). The electrospray ionization conditions were as follows: sheath gas: 55 arbitrary units; sweep gas: 20 arbitrary units; source voltage: 4.5 kV; capillary voltage: 46 V; capillary temperature: 275 °C; tube lens: 175 V; resolving power: 60,000; automatic gain control target: 1x10⁶; max injection time of 500 ms; full mass scan range: 250–2000 m/z. Hydroxocobalamin acetate (157408, MP Biomedicals) and cyanocobalamin (V6629–1G, Sigma Aldrich) were used as vitamin B12 standards. To assess whether vitamin B12 was covalently bound to a particular peptide, other samples of red mAb X and mAb Y BDS were prepared as described previously16 and buffer exchanged into 25 mM Tris, 2 mM CaCl2, pH 8.0 for tryptic digests or 50 mM ammonium bicarbonate, pH 8.0 for endoproteinase Glu-C digests. Trypsin (Roche Applied Science) was added at an enzyme to mAb ratio of 1:10 (w/w) and incubated for 4 h at 37 °C. Endoproteinase-Glu-C (Promega, V1651) was added at 1:50 (w/w) enzyme to mAb and incubated for 4 h at 37 °C prior to analysis by liquid chromatography-mass spectrometry.
Inductively Coupled Plasma/Mass Spectrometry
Selected final pools were analyzed for iron, copper, and cobalt concentration by inductively coupled plasma-mass spectrometry (Exova, Inc.). Detection limit was 0.005 μg/g for copper and cobalt, and 0.03 μg/g for iron. Cobalt was considered a surrogate for vitamin B12 presence, as there is one cobalt atom per vitamin B12 molecule.
Reduced mAb vs. Reducing Conditions
To confirm that reduced mAb alone was sufficient to enable red product (as opposed to reducing conditions enabling red product), yellow mAb X BDS was reduced using 65 mM DTT (91050, Biotium), followed by sequential buffer exchange into formulation buffer using 30 kDa molecular weight cutoff filters to reduce DTT concentration to < 0.05 mM, thus isolating the reduced mAb from reducing conditions. To gain insight into the nature of the hydroxocobalamin-mAb binding, a portion of the DTT-containing mAb sample was alkylated with 0.25 M iodoacetic acid (I4386–10G, Sigma Aldrich) prior to buffer exchange to create an irreversibly reduced mAb sample with covalently modified thiol groups. The reduced mAb samples and a control non-reduced BDS sample were incubated with 3 mg/L hydroxocobalamin (157408, MP Biomedicals) for 72 h, followed by buffer exchange with formulation buffer to remove free hydroxocobalamin, and color was assessed.
Disclosure of Potential Conflicts of Interest
No potential conflicts of interest were disclosed.
Acknowledgments
The authors thank Roberto Flores for experimental assistance, and Scott Sellers, Carlos Garcia, and Michael Molony for helpful discussion.
Glossary
Abbreviations:
- BDS
bulk drug substance (in this case derived from a manufacturing scale process)
- CCF
cell culture fluid
- C-HCCF
control harvested cell culture fluid
- DO
dissolved oxygen
- DTT
dithiothreitol
- EP
European Pharmacopoeia
- HCCF
harvested cell culture fluid
- HPLC
high performance liquid chromatography
- ICP/MS
inductively coupled plasma/mass spectrometry
- IgG4
immunoglobulin subclass 4
- LC/MS
liquid chromatography/mass spectroscopy
- mAb
monoclonal antibody
- NADPH
nicotinamide adenine dinucleotide phosphate
- RP-HCCF
reduction-promoting harvested cell culture fluid
- UFDF
ultrafiltration/diafiltration
- UV
ultraviolet
- WFI
water for injection
Footnotes
Previously published online: www.landesbioscience.com/journals/mabs/article/28257
References
- 1.Shire SJ, Shahrokh Z, Liu J. Challenges in the development of high protein concentration formulations. J Pharm Sci. 2004;93:1390–402. doi: 10.1002/jps.20079. [DOI] [PubMed] [Google Scholar]
- 2.Neergaard MS, Kalonia DS, Parshad H, Nielsen AD, Møller EH, van de Weert M. Viscosity of high concentration protein formulations of monoclonal antibodies of the IgG1 and IgG4 subclass - prediction of viscosity through protein-protein interaction measurements. Eur J Pharm Sci. 2013;49:400–10. doi: 10.1016/j.ejps.2013.04.019. [DOI] [PubMed] [Google Scholar]
- 3.Parenteral Drug Association PDA comments: ICH Q6A; draft guidance on specifications. PDA J Pharm Sci Technol. 1998;52:232–3. [PubMed] [Google Scholar]
- 4.Vijayasankaran N, Varma S, Yang Y, Mun M, Arevalo S, Gawlitzek M, Swartz T, Lim A, Li F, Zhang B, et al. Effect of cell culture medium components on color of formulated monoclonal antibody drug substance. Biotechnol Prog. 2013 doi: 10.1002/btpr.1772. In press. [DOI] [PubMed] [Google Scholar]
- 5.Zhu X, Wentworth P, Jr., Kyle RA, Lerner RA, Wilson IA. Cofactor-containing antibodies: crystal structure of the original yellow antibody. Proc Natl Acad Sci U S A. 2006;103:3581–5. doi: 10.1073/pnas.0600251103. [DOI] [PMC free article] [PubMed] [Google Scholar]
- 6.Color ASL. United States Food and Drug Administration, 2009. http://www.fda.gov/forindustry/coloradditives/coloradditiveinventories/ucm115641.htm
- 7.Pamidi PV, DeAbreu M, Kim D, Mansouri S. Hydroxocobalamin and cyanocobalamin interference on co-oximetry based hemoglobin measurements. Clin Chim Acta. 2009;401:63–7. doi: 10.1016/j.cca.2008.11.007. [DOI] [PubMed] [Google Scholar]
- 8.Gagnon P. Production of Biobetter IgG wtih Enhanced Wash and Elution of Protein A. BIT 2nd International Congress of Antibodies. Beijing, China, 2010. [Google Scholar]
- 9.Trexler-Schmidt M, Sargis S, Chiu J, Sze-Khoo S, Mun M, Kao YH, Laird MW. Identification and prevention of antibody disulfide bond reduction during cell culture manufacturing. Biotechnol Bioeng. 2010;106:452–61. doi: 10.1002/bit.22699. [DOI] [PubMed] [Google Scholar]
- 10.Kao YH, Hewitt DP, Trexler-Schmidt M, Laird MW. Mechanism of antibody reduction in cell culture production processes. Biotechnol Bioeng. 2010;107:622–32. doi: 10.1002/bit.22848. [DOI] [PubMed] [Google Scholar]
- 11.Schwertner HA, Valtier S, Bebarta VS. Liquid chromatographic mass spectrometric (LC/MS/MS) determination of plasma hydroxocobalamin and cyanocobalamin concentrations after hydroxocobalamin antidote treatment for cyanide poisoning. J Chromatogr B Analyt Technol Biomed Life Sci. 2012;905:10–6. doi: 10.1016/j.jchromb.2012.07.012. [DOI] [PubMed] [Google Scholar]
- 12.Juzeniene A, Nizauskaite Z. Photodegradation of cobalamins in aqueous solutions and in human blood. J Photochem Photobiol B. 2013;122:7–14. doi: 10.1016/j.jphotobiol.2013.03.001. [DOI] [PubMed] [Google Scholar]
- 13.Prentice KM, Gillespie R, Lewis N, Fujimori K, McCoy R, Bach J, Connell-Crowley L, Eakin CM. Hydroxocobalamin association during cell culture results in pink therapeutic proteins. MAbs. 2013;5:972–9. doi: 10.4161/mabs.25921. [DOI] [PMC free article] [PubMed] [Google Scholar]
- 14.Adler N, Medwick T, Poznanski T. Reaction of hydroxocobalamin with thiols. J Am Chem Soc. 1966;88:5018–20. doi: 10.1021/ja00973a044. [DOI] [Google Scholar]
- 15.HunterLab. The Basics of Color Perception and Measurement. 2001. www.elscolab.nl/pdf/color.pdf
- 16.Yu XC, Joe K, Zhang Y, Adriano A, Wang Y, Gazzano-Santoro H, Keck RG, Deperalta G, Ling V. Accurate determination of succinimide degradation products using high fidelity trypsin digestion peptide map analysis. Anal Chem. 2011;83:5912–9. doi: 10.1021/ac200750u. [DOI] [PubMed] [Google Scholar]


