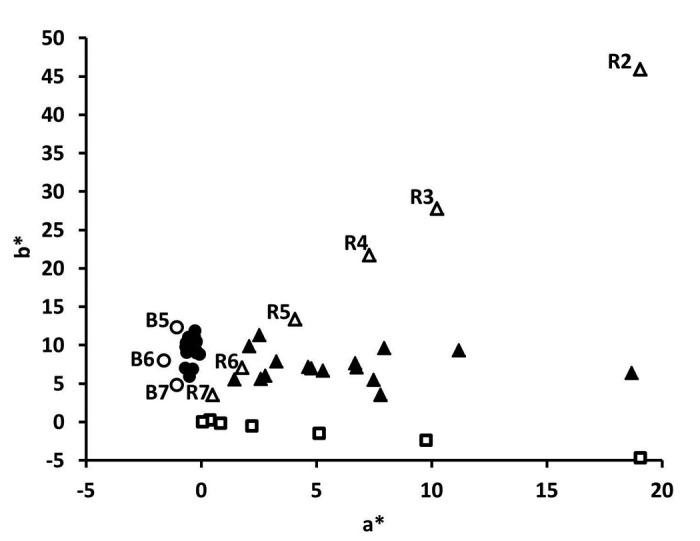
Figure 1. Two-dimensional colorimetry plot for yellow (●) and red (▲) BDS and experimental final pool samples, as well as brown (B, ○) and red (R, Δ) EP color standard series, and vitamin B12 standards with concentrations ranging from 6x10⁻⁴ to 4x10⁻² mg/mL (□).
