

Abstract
Dysfunctional insulin signaling may affect brain metabolism or amyloid deposition. We investigated the associations of type 2 diabetes with amyloid accumulation measured using 11C-Pittsburgh Compound B (PiB) and brain hypometabolism measured using 18F-fluorodeoxyglucose (FDG) positron emission tomography (PET).
Methods
We studied a sample of non-demented participants from the population-based Mayo Clinic Study of Aging. All subjects underwent MRI, amyloid PET and FDG PET. Alzheimer’s disease (AD) signature and region of interest (ROI) measures for PiB retention ratio and FDG ratio were measured. Diabetes was assessed from the Rochester Epidemiology Project medical records-linkage system.
Results
Among 749 participants (median age 79.0 years; 56.5% male, 81.0% cognitively normal; 20.6% diabetics), FDG hypometabolism (FDG ratio < 1.31) in the AD signature meta-ROI was more common in diabetics (48.1%) than in non-diabetics (28.9%; p <0.001). The median FDG ratio was lower in diabetics vs. non-diabetics in the AD signature meta-ROI (1.32 vs. 1.40, p < 0.001), and in the angular (1.40 vs. 1.48, p < 0.001) and posterior cingulate gyri ROIs (1.63 vs. 1.72, p < 0.001). The odds ratio (OR [95% confidence interval]) for abnormal AD signature FDG hypometabolism was elevated (OR, 2.28 [1.56, 3.33]) in diabetics vs. non-diabetics after adjustment for age, sex, and education, and after additional adjustment for Apolipoprotein ε4 allele, glycemic level, and cognitive status (OR, 1.69 [1.10, 2.60]). However, AD signature PiB retention ratio was similar in diabetics vs. non-diabetics (OR, 1.03 [0.71, 1.51]; p = 0.87). In post-hoc analyses in non-diabetics, a 1% increase in HBA1c was associated with greater AD signature hypometabolism in cognitively normal subjects (OR, 1.93 [1.03, 3.62; p = 0.04]) and in the total cohort (OR 1.59 [0.92, 2.75; p = 0.10).
Conclusion
Diabetes and poor glycemic control in non-diabetics may enhance glucose hypometabolism in AD signature regions. These factors should be investigated in longitudinal studies for their role in detecting onset of symptoms in AD.
Keywords: Diabetes, cerebral glucose metabolism, FDG- and PiB-PET imaging, hemoglobin A1c, amyloid accumulation
Introduction
Several studies have reported associations of type 2 diabetes with cognitive impairment, Alzheimer’s disease (AD), or vascular dementia (1–5). The exact mechanisms underlying the association of diabetes with AD remains incompletely understood, but studies suggest that ischemic cerebrovascular disease and hippocampal atrophy are involved (6–10). Other potential mechanisms including global and regional brain hypometabolism (6, 10) and amyloid deposition have been hypothesized (11), but require further investigation. Neuropathological studies, which provide the gold standard for AD pathology, have been inconsistent; some studies have reported greater amyloid-related pathology in diabetic brains (11) whereas others have not (3, 7, 12, 13). Given the dysfunctional insulin signaling in type 2 diabetes, we hypothesized abnormal cerebral glucose metabolism in diabetics may lead to neuronal injury and cognitive impairment (14). Positron emission tomography (PET) offers the opportunity to study in vivo markers of both abnormal brain metabolism and amyloid accumulation.
The objective of our study, therefore, was to specifically examine the association of type 2 diabetes with in vivo markers of amyloid accumulation and cerebral glucose metabolism measured using 11C-Pittsburgh Compound B [PiB-PET]) and 18F-fluorodeoxyglucose [FDG-PET]), in a subset of participants from the population-based Mayo Clinic Study of Aging (MCSA).
MATERIALS AND METHODS
Study Participants
The study design and methodology have previously been published (15). Briefly, participants were Olmsted County, MN residents aged 70 – 89 on October 1, 2004, who were randomly selected from an enumeration of the population using the Rochester Epidemiology medical records linkage system, and invited to participate in the MCSA (16). Starting in 2008, additional subjects were recruited continually to maintain the sample size. Participants were invited to undergo magnetic resonance imaging (MRI) of the brain in 2005 and PET imaging in 2006. All subjects signed a written informed consent that included the Health Insurance Portability and Accountability Act authorization to use and disclose protected health information. The Mayo Clinic and Olmsted Medical Center Institutional Review Boards approved all study protocols.
Assessment of Cognitive Status
Each participant underwent a nurse/study coordinator interview, a physician evaluation, and cognitive testing by a psychometrist. The interview included questions about memory (participant) and the Clinical Dementia Rating Scale (CDR) (17) and Functional Activities Questionnaire (FAQ) (18) (informant). The physician evaluation included the Short Test of Mental Status (19) and a neurological examination. The cognitive testing used 9 tests to assess performance in memory, executive function, language, and visuospatial skills domains. Cognitive domain scores were computed from age-adjusted test scores that were scaled (mean, 10; SD, 3), then summed within domains, and scaled (15, 20, 21).
MCI criteria were defined as: cognitive concern (subject, informant, nurse, or physician); impairment in ≥ 1 cognitive domains; essentially normal functional activities; and no dementia (15, 21, 22). Dementia was based on the Diagnostic and Statistical Manual of Mental Disorders, 4th edition [DSM-IV] criteria. Subjects who performed within the range for cognitively normal subjects from the population and did not meet criteria for MCI or dementia were considered cognitively normal (CN) (15, 21, 22).
Ascertainment of Type 2 Diabetes
Type 2 diabetes was abstracted from the medical records (16) as: treatment for diabetes (oral anti-diabetic agents, insulin), or a fasting blood glucose ≥ 126 mg/dl reported two or more times, or a physician diagnosis (23).
Other Covariates
Date of birth and years of education were assessed by interview. HBA1c level at enrollment was assessed from the medical record (16). APOE genotype was performed at baseline, and blood glucose was measured just prior to PET imaging.
FDG-PET and PiB-PET Acquisition
MRI was performed at 3T with a 3-dimensional volumetric T1-D-MPRAGE (magnetization-prepared rapid gradient–echo) sequence previously described (24). PET images were acquired using a PET/CT scanner operating in 3-dimensional mode (25). A CT image was obtained for attenuation correction. The 11C PiB-PET scan consisted of four 5-minute dynamic frames acquired 40–60 minutes after injection (26). Subjects were injected with 18Fluorodeoxyglucose (18F-FDG) 1 hour after the PiB scan and imaged after 30–38 minutes, for an 8-minute image acquisition of 4, 2-minute dynamic frames (26, 27). An in-house fully automated image processing pipeline was used for quantitative image analysis for PiB and FDG. Each subject’s PET images were registered to his/her MRI which had been labeled with our parcellation atlas (26). An AD signature cortical PiB-PET meta-region of interest (meta-ROI) retention ratio was calculated from the median uptake over voxels in the prefrontal, orbitofrontal, parietal, temporal, anterior cingulate, and posterior cingulate/precuneus ROIs normalized to the cerebellar gray matter ROI of the atlas (25). An AD-signature FDG-PET ratio was calculated in a similar manner based on glucose metabolic rates from an “Alzheimer signature” meta-ROI and consisted of the average bilateral angular gyri, posterior cingulate/precuneus, and inferior temporal cortical ROIs from both hemispheres normalized to pons uptake (28–30).
Statistical Analyses
We defined an abnormal AD signature meta-ROI PiB retention ratio (standardized uptake value ratio) as >1.50 and an abnormal AD signature meta-ROI FDG ratio as <1.31, corresponding to the 90% sensitivity in AD dementia (27, 31). For PiB-PET, where higher biomarker values are worse, the cutpoint corresponding to 90% sensitivity was at the 10th percentile of the AD distribution. For FDG-PET where lower biomarker values are worse, the cutpoint was at the 90th percentile of the AD distribution. We examined the association of diabetes with abnormal AD signature PiB-PET ratio and FDG-PET ratio using logistic regression models adjusted for age and sex. Given that FDG ratio varies with cognitive status, we performed analyses for the total sample, MCI, and cognitively normal [CN]. (29). We examined potential confounding and effect modification (interaction) by APOE ε4 allele, blood glucose at PET imaging, and cognitive status. We selected comparison non-AD regions as the primary sensorimotor regions and global whole brain (based on 35 ROIs), computed unadjusted and glucose-adjusted means of FDG ratio, and examined their associations with diabetes using linear regression models. We conducted post-hoc analyses in non-diabetes to determine whether glycemic control (HBA1c) was also associated with hypometabolism. All analyses were conducted using SAS v.9.3. (SAS, Cary, North Carolina). P-values were considered significant at an alpha < 0.05 (two-tailed tests).
RESULTS
Table 1 shows the characteristics of 749 participants without dementia who underwent PET imaging (2006–2012). The frequency of an abnormal AD signature meta-ROI FDG ratio was significantly higher among diabetics; the median was lower in diabetics vs. non-diabetics in both CN and MCI subjects (Fig 1, top panel) and in the total sample (not shown). FDG hypometabolism was found in all three subregions of the AD signature meta-ROI. Unadjusted means for AD signature FDG ratio for sensorimotor regions and whole brain and were significantly different in diabetics vs. non-diabetics, but glucose-adjusted means did not differ (Supplemental Table 1).
TABLE 1.
Characteristics of participants by type 2 diabetes
| Characteristic | Type 2 diabetes, n = 154 | No diabetes, n = 595 | p |
|---|---|---|---|
| Age, yr | 80.3 (75.8, 84.1) | 78.9 (75.0, 83.5) | 0.18 |
| Male Sex, | 96 (62.3) | 327 (55.0) | 0.10 |
| Education, yr | 13 (12, 16) | 14 (12, 16) | 0.04 |
| APOE ε4 carriera | 40 (26.0) | 160 (26.9) | 0.81 |
| PET studies | |||
| AD signature meta-ROI FDG < 1.31b | 74 (48.1) | 172 (28.9) | <0.001 |
| AD signature meta-ROI FDG ratio | 1.32 (1.25,1.46) | 1.40 (1.29, 1.49) | 0.0001 |
| Posterior cingulate | 1.63 (1.53, 1.75) | 1.72 (1.59, 1.83) | <0.001 |
| Temporal gyrus | 1.10 (1.00, 1.23) | 1.15 (1.04, 1.26) | 0.05 |
| Angular gyrus | 1.40 (1.30, 1.53) | 1.48 (1.37, 1.60) | <0.001 |
| Whole Brain FDG meta-ROI ratio | 1.38 (1.31, 1.44) | 1.43 (1.36, 1.49) | <0.001 |
| AD signature meta-ROI PiB >1.50 | 56 (36.4) | 209 (35.1) | 0.77 |
| AD signature meta-ROI PiBc ratio | 1.39 (1.33, 1.75) | 1.39 (1.31, 1.75) | 0.30 |
| Anterior cingulate | 1.49 (1.41, 1.90) | 1.45 (1.37, 1.83) | 0.01 |
| Posterior cingulate/precuneus | 1.48 (1.39, 1.94) | 1.45 (1.36, 1.87) | 0.07 |
| Whole Brain PiB meta-ROI ratio | 1.39 (1.34, 1.67) | 1.39 (1.32, 1.66) | 0.14 |
| Fasting blood glucose, mg/dl | 114.5 (101, 131) | 97 (90, 105) | <0.001 |
| Years in study | 4.04 (2.53, 6.35) | 4.04 (2.56, 6.49) | 0.36 |
| MCI, n (%) | 40 (29.9) | 102 (19.2) | 0.007 |
Estimates are n (%) or median (interquartile range).
Abbreviations: AD = Alzheimer’s disease; APOE = apolipoprotein E; MCI = mild cognitive impairment.
One subject in no diabetes group had missing data.
AD signature FDG ratio.
AD signature PiB ratio.
FIGURE 1.

Box plots for FDG and PiB retention ratio in AD signature regions by diabetes mellitus (DM) in cognitively normal and MCI subjects. Women (filled circles) and men (open circles).
In the total sample, AD signature meta-ROI FDG ratio was significantly lower in younger diabetics vs. non-diabetics (Fig 2A and 2B), in men and in women (Fig 2C and 2D), and in APOE ε4 non-carriers but not in carriers (Fig 2E and 2F); the findings were consistent for CN and MCI (not shown). In representative scans, AD signature FDG hypometabolism was absent in subjects with no diabetes and no MCI (Fig 3A), minimal in non-diabetics with MCI (Fig 3B), and worst in diabetics with MCI (Fig 3C and 3D).
FIGURE 2.

Box plots of FDG ratio in AD signature regions in the total sample by diabetes (DM) status stratified by age (A: 70–79 years, B: 80 – 89 years), sex (C: women, D: men), and apolipoprotein ε4 allele (E: ε4 carrier, F: ε4 non-carrier). Women (filled circle), men (open circles).
FIGURE 3.
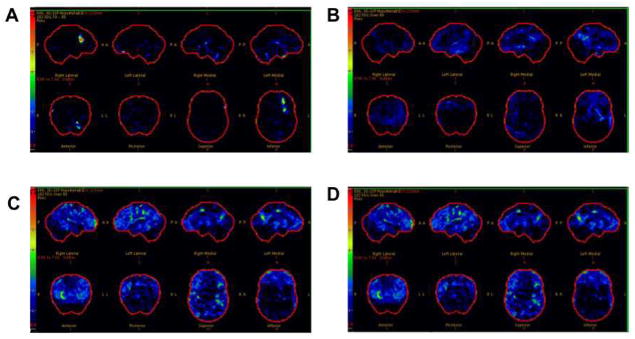
FDG scans for participants without diabetes (A, cognitively normal; B, MCI) and with diabetes (C and D; both with MCI). Each image set represents 3-D SSP regional hypometabolism normalized to age appropriate normal subjects and displayed as a Z-score; upper boundary as 7.0 (red) and the lower boundary as 0.0 (black). A Z-score of 1.5 (medium blue) or greater would be considered significant.
By contrast, the proportion of diabetics versus non-diabetics with an abnormal AD signature meta-ROI PiB ratio did not differ (Table 1). The median AD signature meta-ROI PiB ratio was similar for diabetics vs. non-diabetics (Table 1) among CN and MCI (Fig 1, bottom panel).
Association of Diabetes with AD Signature FDG Uptake
Diabetes was significantly associated with AD signature meta-ROI FDG hypometabolism of the range seen in AD dementia (Table 2). The OR decreased slightly after adjustment for glucose, but remained significant for the total sample and MCI cases for the fully-adjusted models. Diabetes was associated with decreased FDG ratio in the sensorimotor ROIs and the whole brain and but the associations were not significant after adjustment for glucose (Supplemental Table 2). There were no significant interactions of diabetes with age, sex, or APOE ε4; the OR for diabetes and hypometabolism was significant for subjects with glucose levels < 126 mg/dl (OR, 1.72 95%CI, 1.11, 2.69; p = 0.02) (Supplemental Table 3)
TABLE 2.
Association of type 2 diabetes with abnormal FDG-PET ratioa in AD signature meta-ROI
| Odds ratios (95% CI): column headings represent covariates included in each model | |||||||
|---|---|---|---|---|---|---|---|
| Age and Sex | Education | APOE ε4 | Glucose | Cognition | Full model 1b | Full model 2b | |
| Total sample | |||||||
| OR (95% CI) | 2.24 (1.54, 3.27) | 2.28 (1.56, 3.33) | 2.26 (1.55, 3.30) | 1.73 (1.13, 2.63) | 2.17 (1.48, 3.18) | 1.78 1.17, 2.72) | 1.69 (1.10, 2.60) |
| P value | <0.001 | <0.001 | <0.001 | .01 | <0.001 | 0.008 | 0.02 |
| Cognitively normal | |||||||
| OR (95% CI) | 2.21 (1.42, 3.43) | 2.22 (1.43, 3.45) | 2.20 (1.42, 3.41) | 1.50 (0.91, 2.49) | N/A | 1.50 (0.91, 2.49) | N/A |
| P value | 0.0004 | 0.0004 | 0.0005 | 0.12 | 0.12 | ||
| MCI | |||||||
| OR (95% CI) | 2.02 (0.93, 4.41) | 2.22 (1.00, 4.92) | 2.31 (1.03, 5.18) | 1.96 (0.85, 4.51) | N/A | 2.62 (1.08, 6.38) | N/A |
| P value | 0.08 | 0.05 | 0.04 | 0.11 | 0.03 | ||
Abbreviations: AD = Alzheimer’s disease; MCI = mild cognitive impairment.
AD signature meta-ROI FDG ratio < 1.31.
All models include adjustment for age and sex; each column shows the variable added separately to a model with age and sex. Full model 1 is adjusted for age, sex, education, APOE ε4 allele, and glucose level. Full model 2 includes variables in full model 1 and cognition (MCI or normal cognition).
Association of Diabetes with AD Signature PiB
In contrast to unadjusted estimates, the OR for abnormal AD signature meta-ROI PiB was significantly reduced in subjects with MCI after adjustment for age, sex, and education, but not after adjustment for APOE e4 allele (Table 3).
TABLE 3.
Associations of type 2 diabetes with abnormal PiB-PET retention ratioa in AD signature meta-ROI
| OR (95% CI): column headings represent covariates included in each modelb | ||||
|---|---|---|---|---|
|
| ||||
| Age and Sex | Education | APOE ε4 | Full model | |
| Total sample | ||||
| OR (95% CI) | 1.02 (0.70, 1.49) | 1.03 (0.71, 1.51) | 1.05 (0.70, 1.57) | 1.06 (0.71, 1.59) |
| P value | 0.91 | 0.87 | 0.82 | 0.78 |
| Cognitively normal | ||||
| OR (95% CI) | 1.26 (0.82, 1.95) | 1.28 (0.83, 1.97) | 1.26 (0.80, 1.99) | 1.28 (0.81, 2.02) |
| P value | 0.30 | 0.27 | 0.32 | 0.29 |
| MCI | ||||
| OR (95% CI) | 0.39 (0.17, 0.88) | 0.39 (0.17, 0.90) | 0.46 (0.18, 1.16) | 0.46 (0.18, 1.16) |
| P value | 0.02 | 0.03 | 0.10 | 0.10 |
Abbreviations: AD = Alzheimer’s disease; MCI = mild cognitive impairment.
AD signature PiB ratio > 1.50.
All models include adjustment for age and sex; each column shows the variable added separately to a model with age and sex. Full model is adjusted for age, sex, education, and APOE ε4 allele.
HbA1c and AD signature FDG hypometabolism
In CN non-diabetics, the OR for hypometabolism in the AD signature meta-ROI increased with each 1% increase in HBA1c after adjustment for age, sex, and education (OR, 1.93 [1.03, 3.62]; p = 0.04]), and after additional adjustment for APOE ε4 allele (OR, 1.89 [1.00, 3.57]; p = .049).
DISCUSSION
In this elderly persons sample, cohort, diabetes was associated with FDG hypometabolism. This association persisted in the AD signature region for the total sample and MCI cases even after controlling for serum glucose, but not in sensorimotor cortex. By contrast, diabetes was not associated with increased PiB retention ratio (amyloid accumulation) in AD signature meta- ROIs for the total sample, or for CN subjects, but the OR was significantly reduced in subjects with MCI in models that did not include APOE e4.
Glucose hypometabolism in diabetics suggests that diabetes impacts cerebral energy metabolism independently of amyloid deposition, possibly through mechanisms that cause neuronal injury (32). This hypometabolism in CN diabetics suggests that neuronal injury is present even before symptomatic evidence of cognitive impairment. The loss of significance in the CN group after adjustment for glucose level, however, suggests that the effect of diabetes may be small in CN or below the threshold for sustained effect, such that a larger sample of CN is required to detect a significant difference. Alternately, the findings in CN may be due to a more generalized “diabetes effect” rather than a specific AD meta-ROI effect. The persistence of significant associations for the total sample and for MCI cases, even after adjustment for glucose, suggests the effect may be real. The stronger association for MCI subjects suggests that hypometabolism may be in the causal pathway for cognitive impairment in diabetics. Finally, the absence of an effect in multivariable models for the sensorimotor cortex suggests that the associations are not entirely explained by a competitive inhibition of labeled glucose uptake by elevated serum glucose in diabetics.
Our subgroup analyses showed stronger associations of diabetes with hypometabolism for APOE ε4 non-carriers, younger subjects, and men. The stronger OR for APOE ε4 non-carriers suggests that APOE ε4 allele effects might share some mechanistic commonalities with diabetes, and that are independent of APOE ε4-related amyloidosis (33). The stronger association in 70 – 79 year olds may relate to earlier diabetes onset, age-related differences in diabetes effects, non-participation in older subjects, or to potential survival bias. The stronger OR in men suggests etiologic differences as observed for amnestic MCI in our previous studies (21, 34). Follow-up of the cohort will provide greater power to detect significant interactions.
Our findings for HBA1c in non-diabetics support our hypothesis that altered glycemic control is associated with neuronal injury, and are consistent with other studies. In CN adults with newly diagnosed pre-diabetes or diabetes, increasing insulin resistance was associated with greater FDG hypometabolism in AD regions (35), and higher fasting glucose levels CN in non-diabetics were associated with FDG hypometabolism (36). These findings suggest that markers of pre-diabetes should be examined for early detection of brain hypometabolism.
The analyses reported here did not use partial volume correction. When we applied partial volume correction, our findings changed somewhat. Significant associations persisted with adjustment for age- and sex-adjusted models in AD signature regions. However, glucose-adjusted models were not significant. This difference in results may mean that the FDG changes we observed may in part, reflect loss of brain volume due either to diabetes or to other etiology. Alternately, we recognize that if diabetes and related hyperglycemia contributes to structural as well as metabolic changes, controlling for blood glucose may result in over-controlling.
The absence of an association of diabetes with PiB retention ratio in AD signature regions in CN subjects is consistent with findings from several studies (3, 7, 12, 13, 37). In one study, diabetes was associated with cerebral infarctions but not with AD pathology (7); another study found no difference in AD pathology among diabetics and non-diabetics (3). A third study reported that diabetic APOE ε4 carriers had a lower amyloid beta load compared to non-diabetics (12). In contrast, one study reported that diabetic APOE ε4 carriers had greater AD pathology (11), and another reported greater plaque density with longer duration of diabetes (3).
Absence of an association of diabetes with AD signature PiB ratio and significantly AD signature PiB in diabetic MCI subjects, are inconsistent with the hypothesis that diabetes contributes to increased amyloid deposition (38, 39). However, they are consistent with other studies (40). In the Baltimore Longitudinal Study of Aging, diabetes-related parameters were not associated with AD pathology.(40). It is possible that diabetes may have greater effects on neuronal injury and brain atrophy than on amyloid accumulation in elderly persons (8, 9). The null association may also be due to interactions of timing of onset of vascular pathology with amyloid deposition in diabetics. By contrast, subjects with diabetes and PiB deposition occurring independently at earlier ages may progress more rapidly from MCI to dementia, and may be less likely to be captured in our cohort since we did not initially enroll demented subjects to imaging studies. The absence of a significant difference in AD signature PiB ratio for MCI diabetics and non-diabetics (Figure 1, lower panel) vs. the significant association observed in multivariable models suggests possible confounding; the association was significant after adjustment for age, sex, and education, but not APOE ε4 allele. This indicates the need to account for potential confounders when comparing FDG ratio across regions.
One potential limitation of our study is that we cannot assess causality due to the cross-sectional design. The absence of associations of diabetes with AD signature FDG ratio in APOE ε4 carriers and with AD signature PiB retention ratio could be due to under-representation of diabetics, lower participation of diabetics with more severe or longer disease duration, or to lower frequency of APOE ε4 allele in this older age-group. HBA1c was assessed at enrollment and not at the time of imaging; however, the findings support our hypothesis that impaired glucose metabolism impacts brain metabolism. Ongoing recruitment should increase the number of diabetics in our sample. Finally, over 98% of our cohort is of northern European ancestry, thus our findings should be confirmed in other ethnicities.
Our study has several important strengths. Participants were randomly selected from the population; thus, our findings are less subject to selection or volunteer bias. The diagnosis of diabetes was reliably ascertained using the medical records linkage system and not subject to recall bias as occurs with self-report. We had a large sample size of subjects with PET imaging that provides more reliable estimates than studies of small sample size.
CONCLUSION
In elderly persons, diabetes and impaired glucose metabolism in CN, might contribute to neuronal injury. These factors should be examined in future longitudinal studies for their potential role in detecting onset of AD symptoms.
Supplementary Material
Acknowledgments
Funding sources: This work was supported by NIH grants U01 AG006786, P50 AG16574, K01 AG028573, K01 MH68351, R01 AG011378, R01 AG041851, the Robert H. and Clarice Smith and Abigail Van Buren Alzheimer’s Disease Research Program, Center for Individualized Medicine of Mayo Clinic, Minnesota Partnership for Biotechnology and Medical Genomics, GE Health Care, the Elsie and Marvin Dekelboum Family Foundation, and was made possible by the Rochester Epidemiology Project (R01 AG034676).
Footnotes
Potential Conflicts of Interest
None.
Disclosures
Dr. Roberts: research support - NIH, Abbvie Health Economics and Outcomes Research, Walter S. and Lucienne Driskill Foundation.
Dr. Knopman: Deputy Editor for Neurology®; Data Safety Monitoring Boards for Lilly Pharmaceuticals, Lundbeck Pharmaceuticals, DIAN study. Consultant to TauRx Pharmaceuticals through 2012. Investigator for clinical trials by: Baxter and Elan Pharmaceuticals, TauRx. Research support: NIH, Lucienne Driskill Foundation.
Ms. Cha, Dr. Pankratz, and Dr. Geda: no disclosures.
Dr. Mielke: research support, Walter S. and Lucienne Driskill Foundation.
Dr. Kantarci: Data Safety Monitoring Board for Takeda Global Research & Development Center, Inc. Dr. Boeve: Consultant to GE Healthcare; publishing royalties for The Behavioral Neurology of Dementia (Cambridge University Press, 2009); research support, Cephalon, Inc., Allon Therapeutics, Inc., the NIH/NIA, the Alzheimer’s Association, and the Mangurian Foundation.
Dr. Petersen: Scientific advisory boards - Pfizer, Inc., Janssen Alzheimer Immunotherapy, Elan Pharmaceuticals, GE Healthcare; CME lecture for Novartis, Inc.; royalties Mild Cognitive Impairment (Oxford University Press, 2003).
Dr. Jack: Consultant for Janssen, Bristol-Meyer-Squibb, General Electric, Siemens, and Johnson and Johnson; investigator - Allon and Baxter, Inc. clinical trials; research funding – NIH, Alexander Family Alzheimer’s Disease Research Professorship.
Dr. Lowe: Scientific Advisory Boards for Bayer Schering Pharma, GE Healthcare; research support - GE Healthcare, Siemens Molecular Imaging, NIH, MN Partnership for Biotechnology and Medical Genomics, Leukemia & Lymphoma Society.
References
- 1.Akomolafe A, Beiser A, Meigs JB, et al. Diabetes mellitus and risk of developing Alzheimer disease: results from the Framingham Study. Arch Neurol. 2006;63:1551–1555. doi: 10.1001/archneur.63.11.1551. [DOI] [PubMed] [Google Scholar]
- 2.Arvanitakis Z, Wilson RS, Bienias JL, Evans DA, Bennett DA. Diabetes mellitus and risk of Alzheimer disease and decline in cognitive function. Arch Neurol. 2004;61:661–666. doi: 10.1001/archneur.61.5.661. [DOI] [PubMed] [Google Scholar]
- 3.Janson J, Laedtke T, Parisi JE, O’Brien P, Petersen RC, Butler PC. Increased risk of type 2 diabetes in Alzheimer disease. Diabetes. 2004;53:474–481. doi: 10.2337/diabetes.53.2.474. [DOI] [PubMed] [Google Scholar]
- 4.MacKnight C, Rockwood K, Awalt E, McDowell I. Diabetes mellitus and the risk of dementia, Alzheimer’s disease and vascular cognitive impairment in the Canadian Study of Health and Aging. Dement Geriatr Cogn Disord. 2002;14:77–83. doi: 10.1159/000064928. [DOI] [PubMed] [Google Scholar]
- 5.Luchsinger JA, Tang MX, Stern Y, Shea S, Mayeux R. Diabetes mellitus and risk of Alzheimer’s disease and dementia with stroke in a multiethnic cohort. Am J Epidemiol. 2001;154:635–641. doi: 10.1093/aje/154.7.635. [DOI] [PubMed] [Google Scholar]
- 6.Debette S, Seshadri S, Beiser A, et al. Midlife vascular risk factor exposure accelerates structural brain aging and cognitive decline. Neurology. 2011;77:461–468. doi: 10.1212/WNL.0b013e318227b227. [DOI] [PMC free article] [PubMed] [Google Scholar]
- 7.Arvanitakis Z, Schneider JA, Wilson RS, et al. Diabetes is related to cerebral infarction but not to AD pathology in older persons. Neurology. 2006;67:1960–1965. doi: 10.1212/01.wnl.0000247053.45483.4e. [DOI] [PubMed] [Google Scholar]
- 8.Marchant NL, Reed BR, Sanossian N, et al. The aging brain and cognition: contribution of vascular injury and aβ to mild cognitive dysfunction. JAMA neurology. 2013;70:488–495. doi: 10.1001/2013.jamaneurol.405. [DOI] [PMC free article] [PubMed] [Google Scholar]
- 9.Chui HC, Zarow C, Mack WJ, et al. Cognitive impact of subcortical vascular and Alzheimer’s disease pathology. Ann Neurol. 2006;60:677–687. doi: 10.1002/ana.21009. [DOI] [PMC free article] [PubMed] [Google Scholar]
- 10.Cherbuin N, Sachdev P, Anstey KJ. Higher normal fasting plasma glucose is associated with hippocampal atrophy: The PATH Study. Neurology. 2012;79:1019–1026. doi: 10.1212/WNL.0b013e31826846de. [DOI] [PubMed] [Google Scholar]
- 11.Peila R, Rodriguez BL, Launer LJ. Type 2 diabetes, APOE gene, and the risk for dementia and related pathologies: The Honolulu-Asia Aging Study. Diabetes. 2002;51:1256–1262. doi: 10.2337/diabetes.51.4.1256. [DOI] [PubMed] [Google Scholar]
- 12.Alafuzoff I, Aho L, Helisalmi S, Mannermaa A, Soininen H. Beta-amyloid deposition in brains of subjects with diabetes. Neuropathol Appl Neurobiol. 2009;35:60–68. doi: 10.1111/j.1365-2990.2008.00948.x. [DOI] [PubMed] [Google Scholar]
- 13.Heitner J, Dickson D. Diabetics do not have increased Alzheimer-type pathology compared with age-matched control subjects. A retrospective postmortem immunocytochemical and histofluorescent study. Neurology. 1997;49:1306–1311. doi: 10.1212/wnl.49.5.1306. [DOI] [PubMed] [Google Scholar]
- 14.Duarte AI, Moreira PI, Oliveira CR. Insulin in central nervous system: more than just a peripheral hormone. Journal of aging research. 2012;2012:384017. doi: 10.1155/2012/384017. [DOI] [PMC free article] [PubMed] [Google Scholar]
- 15.Roberts RO, Geda YE, Knopman DS, et al. The Mayo Clinic Study of Aging: design and sampling, participation, baseline measures and sample characteristics. Neuroepidemiology. 2008;30:58–69. doi: 10.1159/000115751. [DOI] [PMC free article] [PubMed] [Google Scholar]
- 16.St Sauver JL, Grossardt BR, Yawn BP, Melton LJ, 3rd, Rocca WA. Use of a medical records linkage system to enumerate a dynamic population over time: the Rochester Epidemiology Project. Am J Epidemiol. 2011;173:1059–1068. doi: 10.1093/aje/kwq482. [DOI] [PMC free article] [PubMed] [Google Scholar]
- 17.Morris JC. The Clinical Dementia Rating (CDR): current version and scoring rules. Neurology. 1993;43:2412–2414. doi: 10.1212/wnl.43.11.2412-a. [DOI] [PubMed] [Google Scholar]
- 18.Pfeffer RI, Kurosaki TT, Harrah CH, Jr, Chance JM, Filos S. Measurement of functional activities in older adults in the community. J Gerontol. 1982;37:323–329. doi: 10.1093/geronj/37.3.323. [DOI] [PubMed] [Google Scholar]
- 19.Kokmen E, Smith GE, Petersen RC, Tangalos E, Ivnik RC. The short test of mental status. Correlations with standardized psychometric testing. Arch Neurol. 1991;48:725–728. doi: 10.1001/archneur.1991.00530190071018. [DOI] [PubMed] [Google Scholar]
- 20.Ivnik RJ, Malec JF, Smith GE, et al. Mayo’s Older Americans Normative Studies: WAIS-R, WMS-R and AVLT norms for ages 56 through 97. The Clinical Neuropsychologist. 1992;6:1–104. [Google Scholar]
- 21.Petersen RC, Roberts RO, Knopman DS, et al. Prevalence of mild cognitive impairment is higher in men: the Mayo Clinic Study of Aging. Neurology. 2010;75:889–897. doi: 10.1212/WNL.0b013e3181f11d85. [DOI] [PMC free article] [PubMed] [Google Scholar]
- 22.Petersen RC. Mild cognitive impairment as a diagnostic entity. J Intern Med. 2004;256:183–194. doi: 10.1111/j.1365-2796.2004.01388.x. [DOI] [PubMed] [Google Scholar]
- 23.Report of the expert committee on the diagnosis and classification of diabetes mellitus. Diabetes Care. 2003;26:5S–20. doi: 10.2337/diacare.20.7.1183. [DOI] [PubMed] [Google Scholar]
- 24.Jack CR, Jr, Bernstein MA, Fox NC, et al. The Alzheimer’s Disease Neuroimaging Initiative (ADNI): MRI methods. J Magn Reson Imaging. 2008;27:685–691. doi: 10.1002/jmri.21049. [DOI] [PMC free article] [PubMed] [Google Scholar]
- 25.Lowe VJ, Kemp BJ, Jack CR, Jr, et al. Comparison of 18F-FDG and PiB PET in cognitive impairment. J Nucl Med. 2009;50:878–886. doi: 10.2967/jnumed.108.058529. [DOI] [PMC free article] [PubMed] [Google Scholar]
- 26.Jack CR, Jr, Lowe VJ, Senjem ML, et al. 11C PiB and structural MRI provide complementary information in imaging of Alzheimer’s disease and amnestic mild cognitive impairment. Brain. 2008;131:665–680. doi: 10.1093/brain/awm336. [DOI] [PMC free article] [PubMed] [Google Scholar]
- 27.Knopman DS, Jack CR, Jr, Wiste HJ, et al. Short-term clinical outcomes for stages of NIA-AA preclinical Alzheimer disease. Neurology. 2012;78:1576–1582. doi: 10.1212/WNL.0b013e3182563bbe. [DOI] [PMC free article] [PubMed] [Google Scholar]
- 28.Landau SM, Harvey D, Madison CM, et al. Associations between cognitive, functional, and FDG-PET measures of decline in AD and MCI. Neurobiol Aging. 2011;32:1207–1218. doi: 10.1016/j.neurobiolaging.2009.07.002. [DOI] [PMC free article] [PubMed] [Google Scholar]
- 29.Jagust WJ, Landau SM, Shaw LM, et al. Relationships between biomarkers in aging and dementia. Neurology. 2009;73:1193–1199. doi: 10.1212/WNL.0b013e3181bc010c. [DOI] [PMC free article] [PubMed] [Google Scholar]
- 30.Landau SM, Harvey D, Madison CM, et al. Comparing predictors of conversion and decline in mild cognitive impairment. Neurology. 2010;75:230–238. doi: 10.1212/WNL.0b013e3181e8e8b8. [DOI] [PMC free article] [PubMed] [Google Scholar]
- 31.Jack CR, Knopman DS, Weigand SD, et al. An operational approach to National Institute on Aging–Alzheimer’s Association criteria for preclinical Alzheimer disease. Ann Neurol. 2012;71:765–775. doi: 10.1002/ana.22628. [DOI] [PMC free article] [PubMed] [Google Scholar]
- 32.Knopman DS, Jack CR, Jr, Wiste HJ, et al. Brain injury biomarkers are not dependent on β-amyloid in normal elderly. Ann Neurol. 2013;73:472–480. doi: 10.1002/ana.23816. [DOI] [PMC free article] [PubMed] [Google Scholar]
- 33.Jagust WJ, Landau SM. Apolipoprotein E, not fibrillar beta-amyloid, reduces cerebral glucose metabolism in normal aging. The Journal of neuroscience : the official journal of the Society for Neuroscience. 2012;32:18227–18233. doi: 10.1523/JNEUROSCI.3266-12.2012. [DOI] [PMC free article] [PubMed] [Google Scholar]
- 34.Roberts RO, Geda YE, Knopman DS, et al. The incidence of MCI differs by subtype and is higher in men: The Mayo Clinic Study of Aging. Neurology. 2012;78:342–351. doi: 10.1212/WNL.0b013e3182452862. [DOI] [PMC free article] [PubMed] [Google Scholar]
- 35.Baker LD, Cross DJ, Minoshima S, Belongia D, Watson GS, Craft S. Insulin resistance and Alzheimer-like reductions in regional cerebral glucose metabolism for cognitively normal adults with prediabetes or early type 2 diabetes. Arch Neurol. 2011;68:51–57. doi: 10.1001/archneurol.2010.225. [DOI] [PMC free article] [PubMed] [Google Scholar]
- 36.Burns CM, Chen K, Kaszniak AW, et al. Higher serum glucose levels are associated with cerebral hypometabolism in Alzheimer regions. Neurology. 2013;80:1557–1564. doi: 10.1212/WNL.0b013e31828f17de. [DOI] [PMC free article] [PubMed] [Google Scholar]
- 37.Petrovitch H, White LR, Izmirilian G, et al. Midlife blood pressure and neuritic plaques, neurofibrillary tangles, and brain weight at death: the HAAS. Honolulu-Asia aging Study. Neurobiol Aging. 2000;21:57–62. doi: 10.1016/s0197-4580(00)00106-8. [DOI] [PubMed] [Google Scholar]
- 38.Qiu WQ, Folstein MF. Insulin, insulin-degrading enzyme and amyloid-beta peptide in Alzheimer’s disease: review and hypothesis. Neurobiol Aging. 2006;27:190–198. doi: 10.1016/j.neurobiolaging.2005.01.004. [DOI] [PubMed] [Google Scholar]
- 39.Hoyer S. The brain insulin signal transduction system and sporadic (type II) Alzheimer disease: an update. J Neural Transm. 2002;109:341–360. doi: 10.1007/s007020200028. [DOI] [PubMed] [Google Scholar]
- 40.Thambisetty M, Metter EJ, Yang A, et al. Glucose intolerance, insulin resistance, and pathological features of Alzheimer disease in the Baltimore Longitudinal Study of Aging. JAMA neurology. 2013;70:1167–1172. doi: 10.1001/jamaneurol.2013.284. [DOI] [PMC free article] [PubMed] [Google Scholar]
Associated Data
This section collects any data citations, data availability statements, or supplementary materials included in this article.