Abstract
A fast shear compounding method was developed in this study using only one shear wave push-detect cycle, such that the shear wave imaging frame rate is preserved and motion artifacts are minimized. The proposed method is composed of the following steps: 1. applying a comb-push to produce multiple differently angled shear waves at different spatial locations simultaneously; 2. decomposing the complex shear wave field into individual shear wave fields with differently oriented shear waves using a multi-directional filter; 3. using a robust two-dimensional (2D) shear wave speed calculation to reconstruct 2D shear elasticity maps from each filter direction; 4. compounding these 2D maps from different directions into a final map. An inclusion phantom study showed that the fast shear compounding method could achieve comparable performance to conventional shear compounding without sacrificing the imaging frame rate. A multi-inclusion phantom experiment showed that the fast shear compounding method could provide a full field-of-view (FOV), 2D, and compounded shear elasticity map with three types of inclusions clearly resolved and stiffness measurements showing excellent agreement to the nominal values.
Keywords: shear compounding, shear wave elastography, 2D shear wave speed, directional filter, comb-push, acoustic radiation force
INTRODUCTION
Spatial compounding techniques are widely used in ultrasound to suppress speckle noise and improve image quality (Jespersen et al. 1998; Tanter et al. 2002; Bercoff et al. 2004). Ultrasound spatial compounding coherently sums the backscattered signals from ultrasound insonifications with different incident angles (Jespersen et al. 1998). Similarly, shear compounding coherently compounds the shear elasticity maps from shear wave fields that are illuminated by shear waves with different incident angles (Bercoff et al. 2004). Shear compounding improves the signal-to-noise-ratio (SNR) of shear elasticity maps because random noise can be suppressed by averaging multiple reconstructed maps. Shear compounding also improves the contrast of shear elasticity maps for inclusions with complex geometries and various inhomogeneities, because differently angled shear waves can illuminate and produce good elasticity maps of different parts of the inclusion, which can then be compounded to obtain a robust elasticity map of the whole inclusion.
In practice, however, there are some challenges involved with shear compounding. First, shear compounding requires multiple cycles of transmission and detection of differently angled shear waves in several separate events (Bercoff et al. 2004). This can significantly reduce the frame rate of shear wave imaging and substantially compromise the efficacy of shear compounding for in vivo applications because of the non-negligible amount of gross physiological motion between separate data acquisitions. Second, when the shear wave is angled and thus oblique, one can no longer assume that the shear wave propagates in a direction parallel to the lateral dimension of the ultrasound imaging field. Therefore, conventional shear wave speed estimation methods that assume a lateral propagation direction produce biased estimates of shear wave speed (Palmeri et al. 2008; Tanter et al. 2008; Rouze et al. 2010; Wang et al. 2010). To address these challenges, this study proposes a fast shear compounding method that: 1. uses a comb-push (Song et al. 2012; Song et al. 2013) to produce multiple differently angled shear waves simultaneously to achieve shear compounding with only one push-detect data acquisition, so that shear wave imaging frame rate is preserved and motion artifacts are minimized; 2. uses a multi-directional filter to isolate shear waves with different propagation directions and a robust two-dimensional (2D) shear wave speed calculation method to accurately reconstruct 2D shear wave speed maps from each direction which are then compounded into a final map.
The paper is structured as follows: we describe (1) a validation study of the proposed robust 2D shear wave speed calculation method on a homogeneous phantom, (2) an inclusion phantom study that systematically compares the performance of the proposed fast shear compounding method to the conventional shear compounding method, and finally (3) demonstration of the fast shear compounding to reconstruct a full FOV 2D shear wave speed map with multiple different types of inclusions with different stiffness. We close the paper with discussion and conclusions.
MATERIALS AND METHODS
Robust 2D Shear Wave Speed Calculation
To realize shear compounding using acoustic radiation force excitation, shear waves with different propagation angles need to be induced and detected. When the shear wave propagates at an oblique angle from wave front 1 to 2 to 3 as shown in Fig. 1(a), the actual shear wave speed cs is a/Δt, where Δt is the time interval from 1 to 2 and 2 to 3. However if we only measure the shear wave speed along the x-direction as in Fig. 1(a), the apparent shear wave speed cs′ will be b/Δt, which is higher than the real shear wave speed cs. Therefore, when the measurement direction is not aligned with the shear wave propagation direction, the estimated shear wave speed will be biased high. To measure the correct shear wave speed, a 2D calculation is needed, as shown in Fig. 1(b). Let the shear wave signal detected at pixels a, b, and c be Sa(t), Sb(t), and Sc(t), respectively, where t is time. Let tab be the time delay between Sa(t) and Sb(t) (calculated by finding the delay associated with the peak of the cross-correlation of Sa(t) and Sb(t)), and tac the time delay between Sa(t) and Sc(t) (calculated by finding the delay associated with the peak of the cross-correlation of Sa(t) and Sc(t)). Let the distance between pixels a and c be Lac, and between pixels a and b be Lab. Then VX = Lac/tac, and VZ = Lab/tab. Considering the dimensions of the triangle defined by a, b, and c, the true shear wave speed V can be calculated by:
| (1) |
or
Fig. 1.
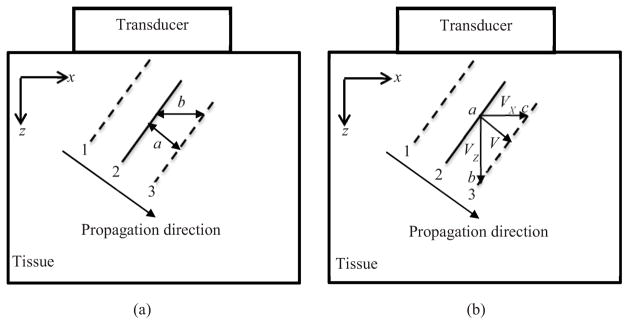
2D shear wave speed calculation. (a) Schematic plot of shear wave propagating at an oblique direction that can bias the shear wave speed measurement. (b) Shear wave speeds along both the VX and VZ directions are calculated to obtain the true shear wave speed V.
| (2) |
Equation (2) is more stable than Eq. (1) when either tac or tab is zero (if the wave propagation direction is aligned with axis z or x). This 2D vector shear wave speed calculation given by Eqs. (1) and (2) does not require a priori knowledge of the direction of shear wave propagation, which can be difficult to know in practice. Note that a similar approach for 2D shear wave speed calculation was used for crawling waves generated by external mechanical shakers (Hoyt et al. 2008). Note also that such 2D methods still assume that the wave propagation is in the imaging plane, and a similar bias will result if some component of the wave propagation is out of the imaging plane (Zhao et al. 2011).
Two methods were developed to increase the robustness of the 2D shear wave speed calculation method while preserving the spatial resolution of the shear wave speed maps. First, an algorithm used in numerical differential calculation developed by Anderssen and Hegland (Anderssen and Hegland 1999) was adapted to calculate local shear wave speed. Conventional local shear wave speed measurement techniques as introduced in (Tanter et al. 2008) are performed by cross-correlating two shear wave signals from two imaging pixels (denoted by S(m−w/2,n,t) and S(m+w/2,n,t), where m is the lateral dimension, n is the axial dimension, t is the slow time dimension, and w is the window size) that are a fixed distance apart (distance is equal to window size w), as shown in Fig. 2(a), to estimate the shear wave speed of the center pixel at location (m,n). The normalized cross-correlation is calculated by (Pinton et al. 2006):
| (3) |
where CC is normalized correlation coefficient and M is number of shear wave signal data points along slow time direction. Temporal delay (Δt) between the two shear wave signals is then given by
Fig. 2.
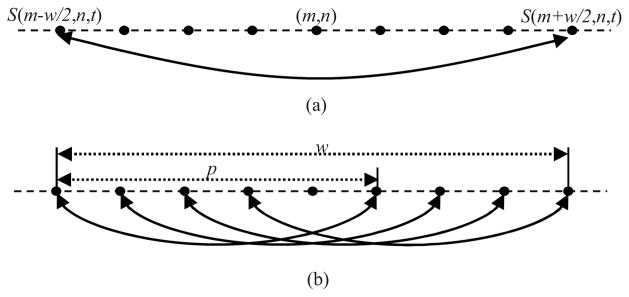
(a) Conventional local shear wave speed recovery method. One cross-correlation is calculated between shear wave signals from the left-edge pixel and right-edge pixel of the window. (b) Proposed local shear wave speed estimation method. Multiple normalized cross-correlations are calculated. The final shear wave speed at the center pixel is given by summing these speed estimates with weights based on their normalized cross-correlation coefficients.
| (4) |
where PRF is the pulse repetition frequency. Local shear wave speed V of the center pixel at location (m,n) is given by
| (5) |
where Δx is the spatial resolution of the imaging pixels.
A more robust approach as introduced in (Anderssen and Hegland 1999) uses a sliding patch of size p that is smaller than the window size w to calculate normalized cross-correlations between each pair of shear wave signals at spatial locations that are p pixels apart, as shown in Fig. 2(b). A window size w of 8 and patch size p of 5 were used throughout this study. Each pair of signals for which normalized cross-correlation is applied produces an estimate of local shear wave speed with a corresponding normalized cross-correlation coefficient. The final shear wave speed at the center pixel (V(m,n)) is then given by the weighted sum of these speed estimates (V(k,n)) by their normalized correlation coefficients (CC(k,n)):
| (6) |
Equation (6) can be used along both the x-axis (lateral dimension) and the z-axis (axial dimension) to obtain VX and VZ, which can then be substituted into Eq. (2) to get the true 2D shear wave speed V, as shown in Fig. 3(a) (the blue triangles indicate VX and the green squares indicate VZ).
Fig. 3.
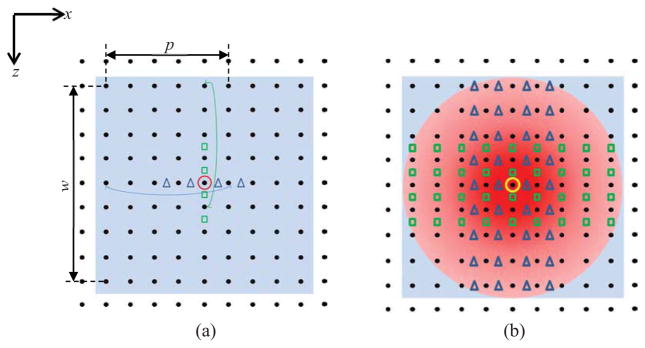
(a) Conventional 1D processing window. The algorithm shown in Fig. 2(a) is used along both axial and lateral directions to get VX and VZ, respectively. The green curve indicates the pair of pixels used to get the shear wave speed estimate for the upmost square. The blue curve indicates the pair of pixels used to get the shear wave speed estimate for the leftmost triangle. Note that only pixels on lines that cross the center pixel (indicated by the red circle) are used. (b) All pixels within the blue shaded area are used to get estimates of VX and VZ. The blue triangles indicate the spatial locations of estimated VX. The green rectangles indicate the spatial locations of estimated VZ. The red gradient shading indicates the distance weighting: higher weights are assigned to estimates that are closer to the center pixel (indicated by darker red).
The second method for increasing the robustness of the 2D shear wave speed calculation is to use a 2D processing window instead of one-dimensional (1D) processing lines, again as in (Anderssen and Hegland 1999). Conventional methods use 1D processing lines to calculate shear wave speed, as shown in Fig. 3(a), where only the pixels on the lines that cross the center pixel (indicated by the red circle) are used. In the 2D window processing technique, as shown in Fig. 3(b), all pixels within the 2D window (shaded area in light blue in Figs. 3(a) and (b)) are used to estimate shear wave speeds VX along the x-direction (indicated by blue triangles) and VZ along the z-direction (indicated by green squares). The final VX and VZ at the center pixel (m,n) indicated by the yellow circle are given by combining these estimates (triangles and squares) weighted by the square of cross-correlation coefficients and the reciprocal of distance r to the center pixel of the 2D window:
| (7) |
where
| (8) |
The final 2D shear wave speed at the center pixel V(m,n) can be obtained by substituting Eq. (7) into Eq. (1). The final correlation coefficient of the center pixel CC(m,n) is given by the minimum of CCX and CCZ, where CCX and CCZ are the average of all normalized correlation coefficients along the x and z directions, respectively. A 2D shear wave speed map and 2D correlation-coefficient map can be obtained by iterating the calculations through all imaging pixels.
Generation and Detection of Multiple Differently Angled Shear Waves
Because the shear wave propagates in a direction that is perpendicular to its polarization direction (Sarvazyan et al. 1998), a steered push beam is needed to produce angled shear waves for shear compounding. In this study a curved linear array transducer C5-2v (Verasonics Inc., Redmond, WA, center frequency = 3 MHz) was used to produce differently angled shear waves by using different parts of the curvature of the probe. A comb-push technique as introduced in (Song et al. 2012; Song et al. 2013) was used to transmit multiple push beams simultaneously at different parts of the curvature of the probe so that multiple differently angled shear waves can be produced in the FOV at the same time. A Verasonics ultrasound system (Verasonics Inc., Redmond, WA) was used to produce the ultrasound push beam and track the resulting shear wave motion. The push pulse center frequency was 2.5 MHz and the duration was 600 μs. The Verasonics system immediately switched to ultrafast plane wave imaging mode with all transducer elements to track shear wave motion after transmitting the push beam. A plane wave imaging compounding method was used to improve the SNR of shear wave displacement tracking (Tanter et al. 2002). Three different steering angles (−4°, 0°, 4°) were used for plane wave detection compounding in this study, producing an effective frame rate of shear wave tracking of 2.77 kHz given the original frame rate of 8.31 kHz (effective frame rate = original frame rate/number of compounding angles). The pixel oriented beamforming by the Verasonics (Daigle 2009) was used to beamform the plane wave signal. The spatial resolution (both axial and lateral) was given by the transmission wavelength, which was equal to 0.51 mm given a transmission frequency of 3 MHz and an ultrasound speed of 1540 m/s. The shear wave particle velocity signals (vSW) caused by shear wave propagation were used as the shear wave motion signal in this study, which was calculated from in-phase/quadrature (IQ) data of consecutive frames using a 1D autocorrelation method (Kasai et al. 1985). The raw shear wave motion signal was averaged using three pixels in the axial spatial dimension and two sampling points in the slow time direction. A 3 × 3 pixel spatial median filter (1.53 mm × 1.53 mm) was finally used on each frame of the shear wave signal to remove noise spike points.
Multi-directional Filtering and Fast Shear Compounding
To decompose the complex shear wave field with multiple differently angled shear waves produced by the comb-push, a multi-directional filter was designed corresponding to each direction of the shear wave propagation. The details of the directional filter design are given in (Manduca et al. 2003). The power of the spatially directional component of the directional filter was 3, which controls the angular width of the filter. After directional filtering, the original shear wave data set was decomposed into Ω separate data sets with Ω shear waves propagating in Ω different directions. For each direction, a 2D shear wave speed map (MSW) at each pixel (m,n) can be reconstructed using the 2D shear wave speed calculation method introduced above. A final shear wave speed map can then be reconstructed by weighted summing these Ω maps:
| (9) |
where CC is the correlation coefficient map and SE is the shear wave energy in each direction. SE is given by the sum of the squares of the shear wave particle velocity signal (vSW) over total time duration (T) at each imaging pixel (Deffieux et al. 2012):
| (10) |
Note that all shear wave speed maps presented in this paper were not smoothed by any spatial smoothing filters.
RESULTS
Validation Study for the Robust 2D Shear Wave Speed Calculation
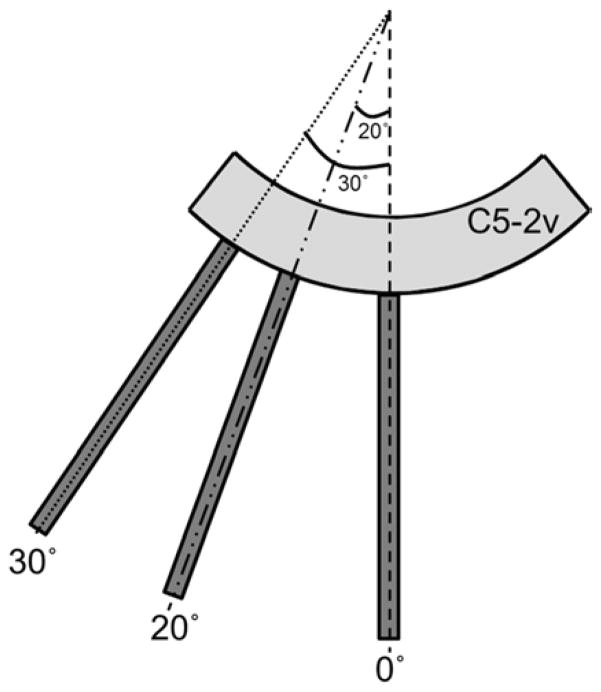
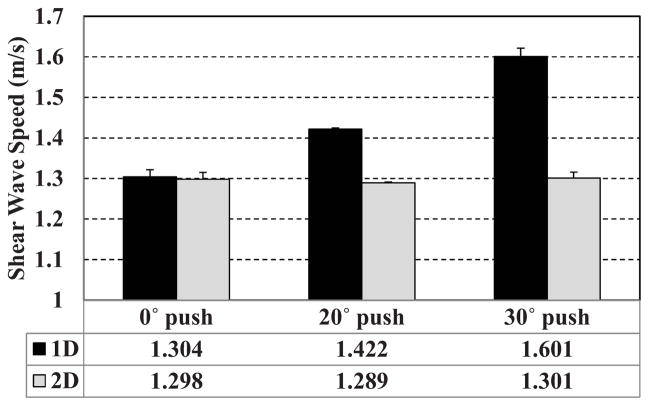
A homogeneous elasticity phantom (CIRS Inc., Norfolk, VA) was used to validate the proposed robust 2D shear wave speed calculation method. The C5-2v curved array was used to transmit three differently angled shear waves (0°, 20°, 30°) separately using an unfocused ultrasound push beam (Zhao et al. 2012) for a planar shear wave, as shown in Fig. 4. For each push beam angle, 5 measurements were taken at 5 different locations of the phantom to test repeatability. Both conventional 1D shear wave speed calculation (i.e. VX only) and the proposed 2D robust shear wave speed calculation (i.e. V) were used to reconstruct 2D shear wave speed maps from these differently angled shear waves. The 0° push beam was regarded as the ground truth because the resulting shear wave is not angled and therefore both 1D and 2D methods were expected to give the same shear wave speed estimates. The 2D maps reconstructed by the 1D and 2D methods using the 30° push beam are shown in Fig. 5. One can clearly see elevated biased estimate of shear wave speed in the 1D method compared with the 2D method, which can be explained by the phenomenon described in Fig. 1 above. Regions-of-interest (ROIs) with a spatial dimension of 25 mm × 25 mm were used to analyze all shear wave speed maps reconstructed from various angled shear waves using the two different methods. The mean and standard deviation values of shear wave speed calculated from the 5 independent tests are shown in Fig. 6. Student’s t-tests were conducted on the shear wave speed measurements and the p values are summarized in Table I. Results from Fig. 6 and Table I demonstrate a few things: Given a 0° push beam, 1D and 2D measurements are very similar because the shear wave is not oblique and thus the dominant component of V is VX; When the push beam is steered and the resulting shear waves are angled, the measurements by the 1D method are statistically significantly different from the 2D measurements and the ground truth measurements (0°), while the 2D measurements are not significantly different from ground truth. These results validated the proposed robust 2D shear wave speed calculation method as an effective tool of correctly estimating shear wave speed when the shear wave propagation is angled and oblique.
Fig. 4.
Schematic plot of the differently angled unfocused push beams (0°, 20°, 30°). Each unfocused push beam was transmitted by 12 transducer elements.
Fig. 5.

2D shear wave speed maps reconstructed from the 30° push beam (indicated by the black dashed rectangles which were superimposed on the image). (a) 2D shear wave speed map reconstructed using the conventional 1D shear wave speed calculation method. (b) 2D shear wave speed map reconstructed using the proposed robust 2D shear wave speed calculation method. The red dashed boxes indicate the ROIs used for shear wave speed analyses. The ROIs were placed on the right hand side of each push beam (about 5 mm from the closest point of the push beam to the left edge of the ROI) shown in Fig. 4.
Fig. 6.
Bar plots of the mean and standard deviation values of shear wave speed measured by 1D and 2D methods from 5 independent tests at 5 different locations in the phantom. The error bars were plotted from the standard deviation values from the 5 trials for each method.
Table I.
p values of Student’s t-tests for shear wave speed measurements
| t-test 1 | 0° push 2D | ||
| 0° push 1D | p = 0.31 | ||
| t-test 2 | 20° push 2D | 0° push 1D | 0° push 2D |
| 20° push 1D | p < 0.001 | p < 0.001 | p < 0.001 |
| 20° push 2D | p = 0.07 | p = 0.15 | |
| t-test 3 | 30° push 2D | 0° push 1D | 0° push 2D |
| 30° push 1D | p < 0.001 | p < 0.001 | p < 0.001 |
| 30° push 2D | p = 0.40 | p = 0.38 |
Comparison of the Proposed Fast Shear Compounding Method to the Conventional Method
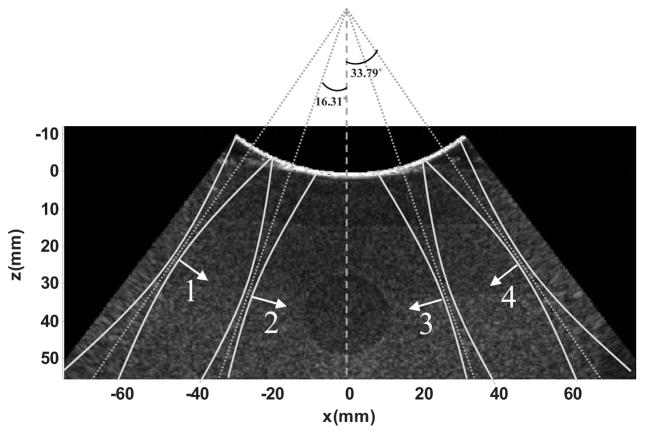
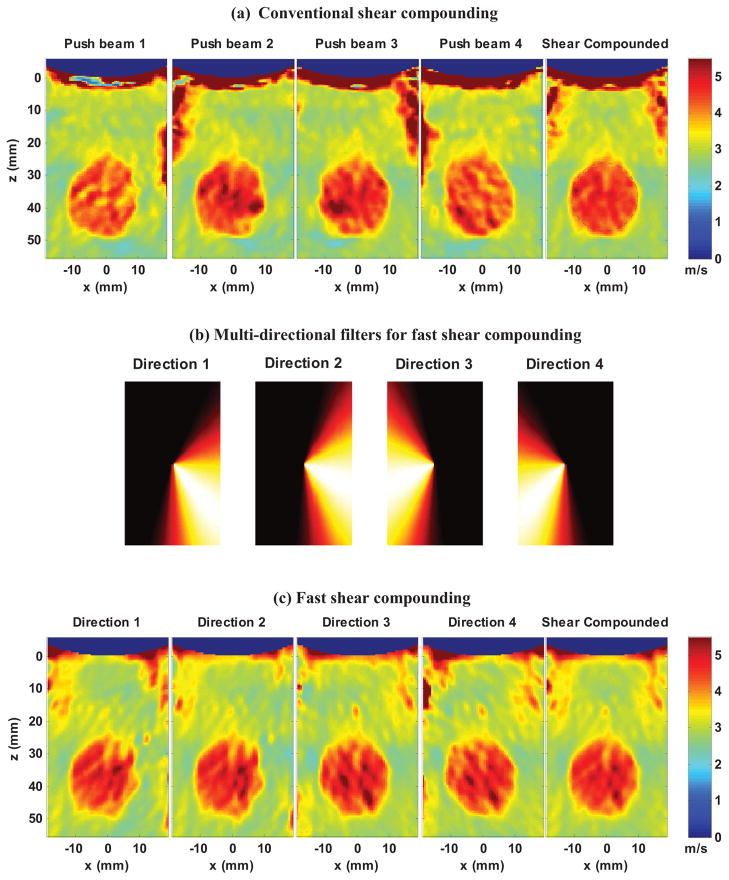
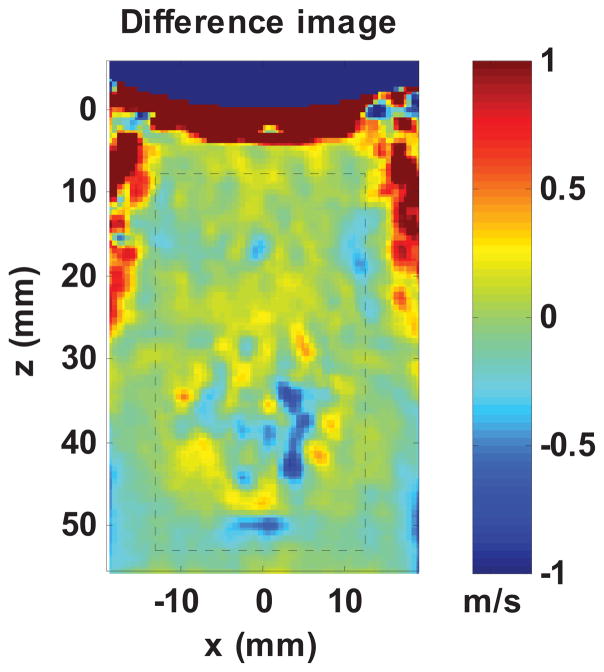
A CIRS elasticity QA phantom (Model 049, CIRS Inc., Norfolk, VA) with different types of spherical inclusions was used to systemically compare the performance of the proposed fast shear compounding method to the conventional method. The type IV inclusion with a diameter of 20 mm was imaged, as shown in Fig. 7. For the conventional method, four focused push beams (focal depth = 40 mm, F/# = 2.63) with angles of −33.79°, −16.31°, 16.31° and 33.79° were separately transmitted (Fig. 7) and the resulting shear waves of each push beam were separately detected, which brought the total data acquisition time to 4 × 44 ms = 176 ms. The shear wave speed from each push beam was reconstructed using the 2D calculation method and the 2D shear wave speed maps are shown in Fig. 8(a). A final compounded shear wave speed map was reconstructed using Eq. (9), as shown in Fig. 8(a). For the fast shear compounding method, the same four angled push beams were transmitted simultaneously and the resulting shear waves of all push beams were detected all at once, which brought the total data acquisition time to 44 ms (4X less than the conventional method). Four directional filters were designed for the four shear wave propagation directions and decompose the original shear wave data into 4 sets of data with differently angled shear waves, as shown in Fig. 8(b). Shear wave speed maps were reconstructed from each direction and compounded to get a final map (Fig. 8(c)). Both the conventional shear compounding method and the fast shear compounding method could reconstruct the inclusion well with sharp boundaries and excellent contrast to the background. One can clearly observe the shape change of the inclusion with respect to the direction of the shear wave propagation and the improved inclusion shape in the compounded images. The shear wave speed of the inclusion within the indicated ROI is 4.49 ± 0.26 m/s for the conventional compounding method, and 4.55 ± 0.34 m/s for the fast compounding method, both agreeing well with the nominal value of 5.16 ± 0.52 m/s. Figure 9 shows the difference image between the conventional compounded and fast compounded images; the mean squared error (MSE) within the ROI is 0.03 m2/s2, which is very small. These results indicate that the fast shear compounding method can achieve comparable performance to the conventional shear compounding method while preserving the shear wave imaging frame rate by using only one cycle of shear wave generation and detection.
Fig. 7.
Plot of the push beam setup on top of the B-mode image of the inclusion phantom. Four focused push beams with different angles were transmitted separately and simultaneously for the conventional shear compounding method and the fast shear compounding method, respectively. Four shear waves with different directions (numbered 1, 2, 3, and 4) were produced to propagate through the inclusion area. The red arrows indicate the shear wave propagation direction.
Fig. 8.
Comparisons of conventional shear compounding method to the fast shear compounding method. (a) 2D shear wave speed maps reconstructed from each push beam as shown in Fig. 7 and the final compounded shear wave speed map. The black dashed circle indicates the ROI used for shear wave speed measurement. (b) Multi-directional filters designed to fit each propagation direction of shear waves from the 4 ultrasound push beams. Direction 1 is for the right-going shear wave no. 1; direction 2 is for the right-going shear wave no. 2; direction 3 is for the left-going shear wave no. 3; direction 4 is for the left-going shear wave no. 4. The lateral dimension of the plots corresponds to the horizontal direction of shear wave propagation; the axial dimension corresponds to the vertical direction of shear wave propagation. All plots were normalized to the scale of 0 to 1. (c) 2D shear wave speed maps reconstructed from each directional filtered shear wave data and the final compounded shear wave speed map.
Fig. 9.
Difference image between the compounded images from the conventional method and the fast shear compounding method. The black dashed box indicates the ROI used for mean squared error (MSE) estimation.
Fast Shear Compounding for Multiple Inclusions
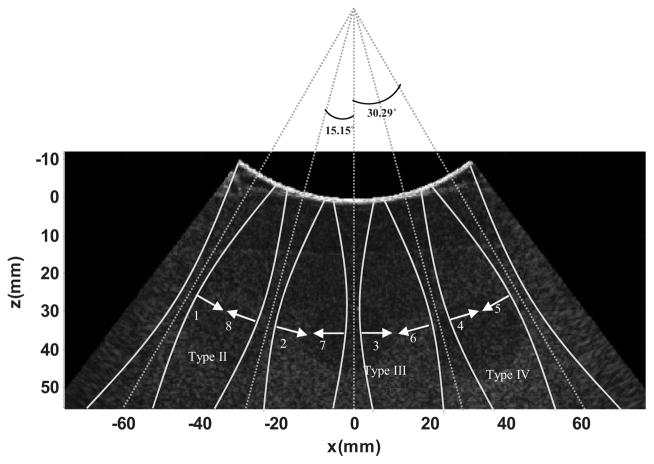
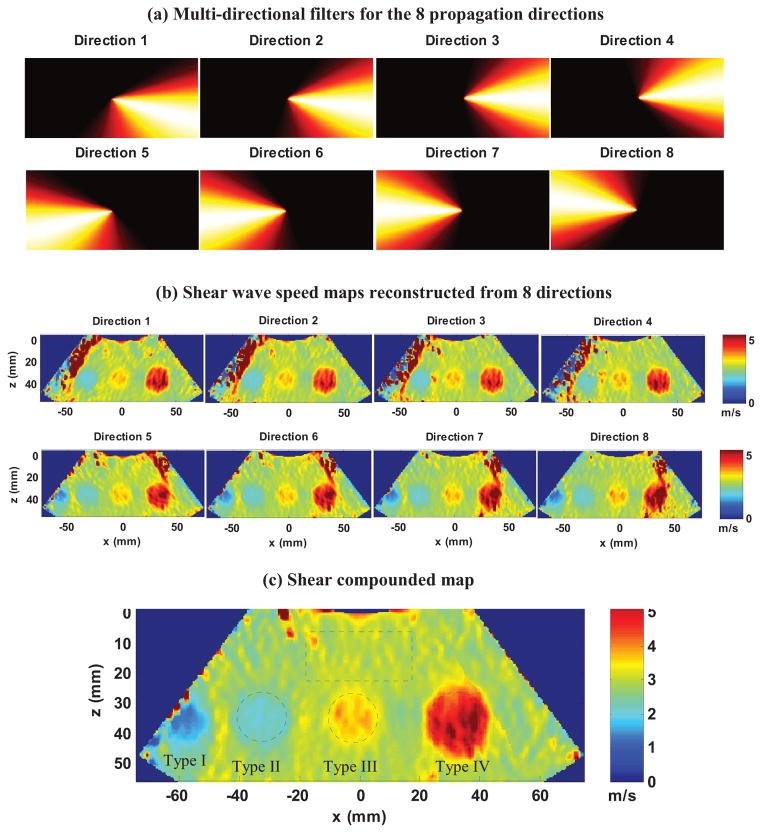
The same CIRS inclusion phantom as used in the previous example was used to test the capability of the proposed fast shear compounding method for reconstructing multiple inclusions with different stiffness with only one push-detect cycle. The type II, III, and IV inclusions with diameters of 20 mm were located and imaged. The B-mode image is shown in Fig. 10. Five focused push beams (focal depth = 40 mm, F/# = 3.23) with different angles (−30.29°, −15.15°, 0°, 15.15°, 30.29°) were simultaneously transmitted to produce 8 shear waves with 8 different propagation directions, as shown in Fig. 10, so that each inclusion would experience multiple differently angled shear waves. All shear waves were detected together and the total data acquisition time was 44 ms. Corresponding to the 8 propagation directions, 8 directional filters were designed to fit each propagation direction (Fig. 11(a)) and used to decompose the original shear wave data into 8 data sets. Shear wave speed maps were reconstructed using each data set and the results are shown in Fig. 11(b). These maps were then compounded into a final map using Eq. (9), as shown in Fig. 11(c). In Fig. 11(c), one can clearly resolve the three targeted inclusions with good contrast to the background and sharp boundaries. The type I inclusion was even resolvable from the compounded map although it was not discernible from the B-mode image. ROIs were selected to measure the shear wave speed of the inclusions and background, which were then converted to Young’s modulus by E=3ρV2, where ρ is density and was assumed to be 1000 kg/m3. The results are listed in Table II. All measurements showed good agreements with the nominal values of the phantom.
Fig. 10.
Plot of the push beam setup on top of the B-mode image of the multiple-inclusion phantom. Five focused push beams with different angles were transmitted simultaneously, which produced 8 shear waves with 8 different propagation directions (numbered 1 to 8). The red arrows indicate the shear wave propagation direction.
Fig. 11.
(a) Multi-directional filters designed for the 8 propagation directions of shear waves. The numbering of the filters is the same as that of the shear waves in Fig. 10. (b) Shear wave speed maps reconstructed from the 8 directions. (c) Final shear compounded map. The dashed box and circles indicate the ROIs selected for shear wave speed measurements.
Table II.
Young’s modulus measurements of the CIRS inclusion phantom
| Measured values (kPa) | Nominal values (kPa) | |
|---|---|---|
| Type II | 14.95 ± 1.50 | 14 ± 4 |
| Type III | 40.96 ± 3.07 | 45 ± 5 |
| Type IV | 72.84 ± 11.02 | 80 ± 8 |
| Background | 27.10 ± 2.54 | 25 ± 4 |
DISCUSSION
This paper presents a fast shear compounding method to realize shear compounding while preserving the shear wave imaging frame rate and minimizing motion artifacts. The proposed fast shear compounding method uses a comb-push to transmit multiple differently angled shear waves simultaneously into the tissue, a multi-directional filter to break down the complex shear wave field into different propagation directions, and a robust 2D shear wave speed calculation method to correctly estimate the speed of the angled shear waves and reconstruct 2D shear wave speed maps. The homogeneous phantom experiment validated the proposed 2D robust shear wave speed method as an effective tool to correct for the overestimate bias caused by oblique shear wave propagation. The first inclusion phantom study showed that the proposed fast shear compounding method could achieve comparable performance to the conventional method in reconstructing a well-shaped inclusion image while preserving the shear wave imaging frame rate by reducing the total data acquisition time by a factor of 4. The second inclusion phantom experiment showed that the proposed fast shear compounding method could accurately reconstruct multiple different types of inclusions with good contrast and shape preservations, thanks to the multiple differently angled shear waves that enabled shear compounding at each inclusion. This experiment was also done with only one push-detect data acquisition (duration = 44 ms), preserving the shear wave imaging frame rate.
Ideally, shear waves from all directions surrounding the inclusion are needed for shear compounding to reconstruct a well-shaped inclusion. However, this is not feasible in reality due to limited amount of beam steering of ultrasound probes and some inaccessible directions such as from the bottom of the inclusion. If shear wave sources other than acoustic radiation force are used, which allow shear waves to be simultaneously generated surrounding the inclusion, the proposed fast shear compounding principles should still apply and may perform even better.
The 2D shear wave speed calculation method introduced in (Hoyt et al. 2008) was implemented on a continuous crawling wave pattern based on a phase estimator approach. While the same principle of 2D calculation was used in this study, the robust 2D shear wave speed calculation method presented here integrated the cross-correlation and the Anderssen-Hegland methods into the algorithm to robustly estimate the speed of transient shear waves induced by acoustic radiation force, which is different from the method presented in (Hoyt et al. 2008).
For the validation study of the 2D shear wave speed calculation, note that given the case of a homogeneous medium and known push beam angle, one can use the angle correction technique as used in spectral Doppler (Cobbold 2007) to obtain the true shear wave speed. Also if the tracking beam is adjusted to be parallel to the push beam and the resulting shear wave, then the overestimate bias can be corrected as well. However, in the case of inhomogeneous media such as tissues with lesions and inclusion phantoms, the shear wave propagation angle can vary significantly from one location to another due to wave deflection and reflection, which: 1) undermines the angle correction based approach since the shear wave angle is different and unknown at different spatial locations; 2) makes it very challenging to locally adjust the tracking beam direction to ensure parallel tracking of the shear waves. The proposed 2D shear wave speed calculation approach, however, does not need a priori knowledge of the shear wave propagation angle or the tracking beam to be parallel to the push beam and shear wave, and therefore can robustly handle locally variant shear wave angles, which is a more flexible and reliable approach than the angle correction method and the adjusting tracking beam method.
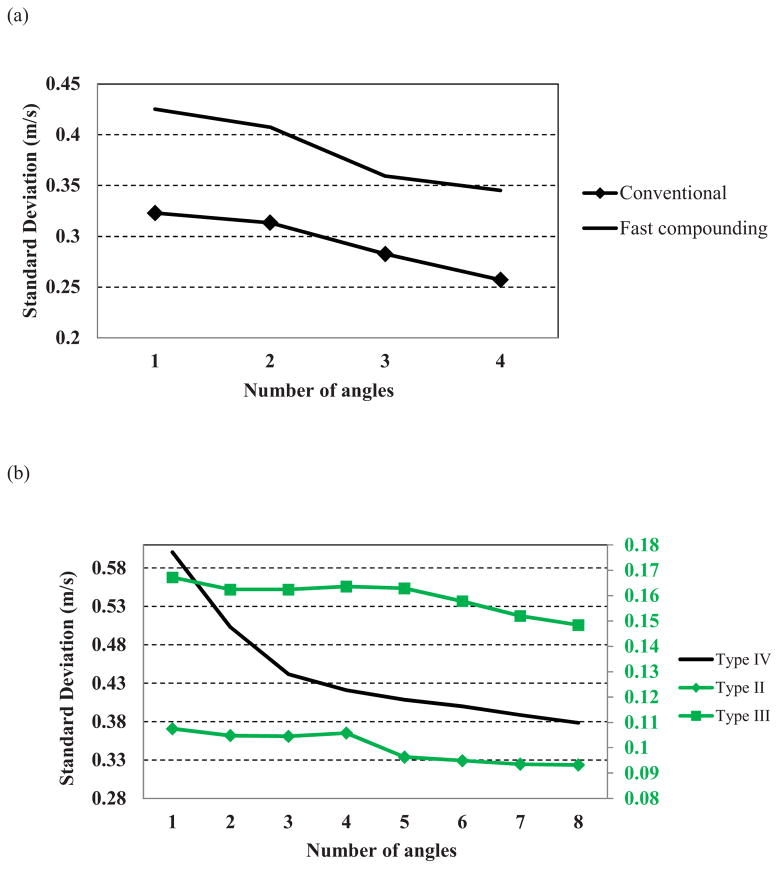
Figure 12 shows the standard deviation values of the shear wave speed of the inclusion versus number of compounding angles for both the comparison study (Fig. 12 (a)) and the multi-inclusion phantom study (Fig. 12 (b)). As shown in Fig. 12, the standard deviation of the shear wave speed estimate decreases with increased number of compounding angles for all inclusions. A comprehensive analysis of noise deduction for shear compounding will be conducted in future studies, because as suggested by (Deffieux et al. 2012), noise modeling for shear wave reconstruction is rather complicated.
Fig. 12.
(a) Plot of standard deviation of the shear wave speed value of the inclusion indicated by the ROI in Fig. 8(a) versus number of compounding angles for both the conventional and fast shear compounding methods. (b) Plot of standard deviation of the shear wave speed value of the inclusions indicated by the ROIs in Fig. 11(c) versus number of compounding angles for the three types of inclusions. Note that plots for Type II and Type III inclusions are on the secondary axis colored in green.
Another important function of shear compounding is to remove the structural artifacts caused by shear wave propagation direction and therefore reconstruct better shaped inclusions. As shown in Figs. 8 (a) and (c) and Fig. 11 (b) and (c), the shape of the inclusion changes with the incident angle of the shear waves, causing unwanted deformation of the inclusion. After shear compounding, one can see an improved shape of all inclusions. This feature of shear compounding is different from ultrasound spatial compounding and is another benefit of this technology.
This study used a curved linear array to produce differently angled shear waves thanks to the various beam angles at various locations of the probe. To obtain more flexible control of the beam angle, one can steer the ultrasound push beam by adjusting the phase delay profile of the aperture. Beam steering is necessary for linear array and phased array probes to produce differently angled shear waves for shear compounding. Note that with beam steering on the linear array there is a chance for grating lobes. With the phased array, this should not occur. Push beam steering will be investigated in future works.
For the multi-directional filter used in this study, we empirically chose a power of 3 to balance the tradeoff between the directionality of the filter and the “streaking” artifact in a direction that is perpendicular to the filter direction. As introduced in (Manduca et al. 2003), the higher the power of the filter, the narrower the angular width of the filter and thus the stronger the directionality. However, if a very narrow directional filter is used, high frequency components along perpendicular direction will be filtered out and an artificial vertical streak along the perpendicular direction will be created. If the filter is too wide, the directionality will be bad and shear waves from different directions will not be separated. To overcome this limitation in filter design, ideally we would like to have push beam angles that are sufficiently separated so that design of directional filters that have little or no overlap is possible, and therefore each directional filter can output independent shear waves with different angles. In practice, however, this would require further steering the push beams in addition to the angles provided by the curvature of the probe. As mentioned above, push beam steering will be investigated in future work to provide more flexibility of the angle of the shear waves.
The number of shear waves of different directions that can be produced in a single comb-push cycle is limited by the transducer aperture size if a focused comb-push is used, which transmits multiple focused push beams simultaneously (Song et al. 2013), as used in this study. Given a certain push beam F/# and probe aperture size, shallower depth allows a higher number of push beams than deeper depth, and therefore a higher number of different directional shear waves in shallower depth than in deeper depth. If a marching comb-push is used where push beams at different angles are transmitted sequentially (Song et al. 2013), one can transmit a higher number of different directional shear waves at deeper depths compared to using focused comb-push. In this case the limiting factor to the number of push beams and number of different directional shear waves would be heating on the overlapping transducer elements that are being excited multiple times. This study was using focused comb-push as a proof of concept for the proposed fast shear compounding method. Future studies will be conducted to test the feasibility of using marching comb-push for shear compounding.
The processing speed of fast shear compounding is faster than the conventional compounding method. On a general desktop PC with Intel Core2 Duo CPU at 3 GHz, the time cost for conventional compounding (Fig. 8(a)) was about 125 seconds, while for fast shear compounding it was about 90 seconds in MATLAB (The Mathworks, Natick, MA). The reason why post-processing for fast shear compounding is faster is because: 1) as in Fig. 8(a), the conventional method also requires calculating same number of differently angled shear wave fields (in this case 4 different angles) as the fast compounding method; 2) the conventional compounding method extracts shear wave motion from separate sets of IQ data from multiple data acquisitions (in this case 4 data acquisitions), while the fast compounding method only needs to do this once; 3) a directional filter is also needed for the conventional method to remove the reflected shear waves from the inclusion for each shear wave field, as introduced in (Deffieux et al. 2011). With more advanced programming (e.g. C++) and parallel processing (e.g. graphical processing unit (GPU)), the processing time is expected to be substantially reduced. Our initial tests show a typical processing time around 0.25 ~ 0.5 sec for the fast shear compounding method.
One limitation of this study is that only phantoms were used to test the proposed method. Real tissues typically cause more shear wave attenuation than phantoms, which means some of the differently angled shear waves would attenuate before reaching a given position. For example, in the multi-inclusion phantom experiment, shear wave no. 1 (Fig. 10) may not have been able to reach the rightmost type IV inclusion due to attenuation. Thus, the rightmost type IV inclusion would not have experienced as many differently angled shear waves as in the phantom case. Thus, if this experiment had been done in real tissues, the overall shear compounding efficacy may have been compromised. Nevertheless, each inclusion would still have experienced at least two differently angled shear waves thanks to the multiple push beam sources. Moreover, because the compounding is achieved with only one push-detect cycle, motion artifacts caused by breathing and other physiological motions are minimized, which is a substantial improvement over the conventional shear compounding method.
CONCLUSIONS
This paper presented a fast shear compounding method capable of achieving shear compounding while preserving the shear wave imaging frame rate, thus minimizing motion artifacts. The fast compounding method combines comb-push, multi-directional filtering, and a robust 2D shear wave speed calculation technique to realize transmission and processing of multiple differently angled shear waves simultaneously, and reconstructing accurate 2D shear wave speed maps from each direction. Comparable performances to the conventional method were achieved using the fast shear compounding method while the total acquisition time was reduced by a factor of 4. Multiple inclusions with different stiffness values could be simultaneously resolved in a full FOV 2D map using the proposed method, while only one push-detect cycle of shear waves was needed. Future study includes implementing the fast shear compounding technique for investigation of in vitro and in vivo tissues.
Acknowledgments
This work was supported by NIH grants EB002167, DK082408 and DK 092255.
Footnotes
The content is solely the responsibility of the authors and does not necessarily represent the official views of NIH. Mayo and some of the authors have financial interest in the technology described here, which has been licensed. The authors thank Randall Kinnick for his experimental assistance.
Publisher's Disclaimer: This is a PDF file of an unedited manuscript that has been accepted for publication. As a service to our customers we are providing this early version of the manuscript. The manuscript will undergo copyediting, typesetting, and review of the resulting proof before it is published in its final citable form. Please note that during the production process errors may be discovered which could affect the content, and all legal disclaimers that apply to the journal pertain.
References
- Anderssen RS, Hegland M. For numerical differentiation, dimensionality can be a blessing! Math Comput. 1999;68:1121–41. [Google Scholar]
- Bercoff J, Tanter M, Fink M. Supersonic shear imaging: a new technique for soft tissue elasticity mapping. IEEE Trans Ultrason Ferroelectr Freq Control. 2004;51:396–409. doi: 10.1109/tuffc.2004.1295425. [DOI] [PubMed] [Google Scholar]
- Cobbold RSC. Foundations of Biomedical Ultrasound. New York: Oxford University Press; 2007. [Google Scholar]
- Daigle RE. Ultrasound Imaging System with Pixel Oriented Processing. 20090112095. United States Patent No. 2009
- Deffieux T, Gennisson JL, Bercoff J, Tanter M. On the effects of reflected waves in transient shear wave elastography. IEEE Trans Ultrason Ferroelectr Freq Control. 2011;58:2032–5. doi: 10.1109/TUFFC.2011.2052. [DOI] [PubMed] [Google Scholar]
- Deffieux T, Gennisson JL, Larrat B, Fink M, Tanter M. The variance of quantitative estimates in shear wave imaging: theory and experiments. IEEE Trans Ultrason Ferroelectr Freq Control. 2012;59:2390–410. doi: 10.1109/TUFFC.2012.2472. [DOI] [PubMed] [Google Scholar]
- Hoyt K, Castaneda B, Parker KJ. Two-dimensional sonoelastographic shear velocity imaging. Ultrasound Med Biol. 2008;34:276–88. doi: 10.1016/j.ultrasmedbio.2007.07.011. [DOI] [PubMed] [Google Scholar]
- Jespersen SK, Wilhjelm JE, Sillesen H. Multi-angle compound imaging. Ultrason Imaging. 1998;20:81–102. doi: 10.1177/016173469802000201. [DOI] [PubMed] [Google Scholar]
- Kasai C, Namekawa K, Koyano A, Omoto R. Real-Time Two-Dimensional Blood-Flow Imaging Using an Auto-Correlation Technique. Ieee T Son Ultrason. 1985;32:458–64. [Google Scholar]
- Manduca A, Lake DS, Kruse SA, Ehman RL. Spatio-temporal directional filtering for improved inversion of MR elastography images. Med Image Anal. 2003;7:465–73. doi: 10.1016/s1361-8415(03)00038-0. [DOI] [PubMed] [Google Scholar]
- Palmeri ML, Wang MH, Dahl JJ, Frinkley KD, Nightingale KR. Quantifying hepatic shear modulus in vivo using acoustic radiation force. Ultrasound Med Biol. 2008;34:546–58. doi: 10.1016/j.ultrasmedbio.2007.10.009. [DOI] [PMC free article] [PubMed] [Google Scholar]
- Pinton GF, Dahl JJ, Trahey GE. Rapid tracking of small displacements with ultrasound. IEEE Trans Ultrason Ferroelectr Freq Control. 2006;53:1103–17. doi: 10.1109/tuffc.2006.1642509. [DOI] [PubMed] [Google Scholar]
- Rouze NC, Wang MH, Palmeri ML, Nightingale KR. Robust estimation of time-of-flight shear wave speed using a radon sum transformation. IEEE Trans Ultrason Ferroelectr Freq Control. 2010;57:2662–70. doi: 10.1109/TUFFC.2010.1740. [DOI] [PMC free article] [PubMed] [Google Scholar]
- Sarvazyan AP, Rudenko OV, Swanson SD, Fowlkes JB, Emelianov SY. Shear wave elasticity imaging: a new ultrasonic technology of medical diagnostics. Ultrasound Med Biol. 1998;24:1419–35. doi: 10.1016/s0301-5629(98)00110-0. [DOI] [PubMed] [Google Scholar]
- Song P, Urban MW, Manduca A, Zhao H, Greenleaf JF, Chen S. Comb-Push Ultrasound Shear Elastography (CUSE) With Various Ultrasound Push Beams. IEEE Trans Med Imaging. 2013;32:1435–47. doi: 10.1109/TMI.2013.2257831. [DOI] [PMC free article] [PubMed] [Google Scholar]
- Song P, Zhao H, Manduca A, Urban MW, Greenleaf JF, Chen S. Comb-push ultrasound shear elastography (CUSE): a novel method for two-dimensional shear elasticity imaging of soft tissues. IEEE Trans Med Imaging. 2012;31:1821–32. doi: 10.1109/TMI.2012.2205586. [DOI] [PMC free article] [PubMed] [Google Scholar]
- Tanter M, Bercoff J, Athanasiou A, Deffieux T, Gennisson JL, Montaldo G, Muller M, Tardivon A, Fink M. Quantitative assessment of breast lesion viscoelasticity: initial clinical results using supersonic shear imaging. Ultrasound Med Biol. 2008;34:1373–86. doi: 10.1016/j.ultrasmedbio.2008.02.002. [DOI] [PubMed] [Google Scholar]
- Tanter M, Bercoff J, Sandrin L, Fink M. Ultrafast compound imaging for 2-D motion vector estimation: application to transient elastography. IEEE Trans Ultrason Ferroelectr Freq Control. 2002;49:1363–74. doi: 10.1109/tuffc.2002.1041078. [DOI] [PubMed] [Google Scholar]
- Wang MH, Palmeri ML, Rotemberg VM, Rouze NC, Nightingale KR. Improving the robustness of time-of-flight based shear wave speed reconstruction methods using RANSAC in human liver in vivo. Ultrasound Med Biol. 2010;36:802–13. doi: 10.1016/j.ultrasmedbio.2010.02.007. [DOI] [PMC free article] [PubMed] [Google Scholar]
- Zhao H, Song P, Urban MW, Greenleaf JF, Chen S. Shear wave speed measurement using an unfocused ultrasound beam. Ultrasound Med Biol. 2012;38:1646–55. doi: 10.1016/j.ultrasmedbio.2012.05.015. [DOI] [PMC free article] [PubMed] [Google Scholar]
- Zhao H, Song P, Urban MW, Kinnick RR, Yin M, Greenleaf JF, Chen S. Bias observed in time-of-flight shear wave speed measurements using radiation force of a focused ultrasound beam. Ultrasound Med Biol. 2011;37:1884–92. doi: 10.1016/j.ultrasmedbio.2011.07.012. [DOI] [PMC free article] [PubMed] [Google Scholar]


