

Abstract
Neuroimaging has rapidly advanced investigations into dysfunction both within and emanating from the hippocampus in early Alzheimer’s disease. Focusing on prodromal subjects, we will discuss structural changes to hippocampal subregions, alterations to functional activity both within the hippocampus and elsewhere in the cortex, as well as changes to structural white matter connectivity and changes to functionally correlated patterns during memory performance. We present ample evidence that asymptomatic subjects demonstrate substantial identifiable brain changes before the onset of cognitive decline, but suggest there is significant work yet to be accomplished before applying these findings to individual patients.
Keywords: Medial temporal lobe, hippocampus, magnetic resonance imaging, diffusion tensor imaging, functional magnetic resonance imaging, APOE
Introduction
Extensive effort has been invested into identifying how the brain is altered during the course of Alzheimer’s disease (AD), with some evidence suggesting changes are evident up to decades before the onset of cognitive symptoms and irreversible neuronal death (Tyas et al. 2007; Shaw et al. 2007). Integrity of the medial temporal lobe (MTL) is known to be necessary for the formation and retrieval of novel episodic events (Penfield & Milner 1958; Squire et al. 2004; Staresina et al. 2013). Thus, the MTL was an initial target for investigations as to the underlying cause of memory impairment during early stages of the disease, before neural damage spreads to other brain regions (Apostolova et al. 2012). Morphological change within the MTL remains a well-established imaging biomarker in preclinical AD (de Toledo-Morrell et al. 2000). However, investigating other imaging metrics in early AD to improve diagnostic specificity and sensitivity before significant cognitive decline remains a critical tool in clinical AD research. This paper will both review early MRI research from our laboratory that focused on subjects at elevated risk for AD, as well as present novel data from our lab using functional MRI data in a psychophysiological interaction (PPI) analysis. Based on evidence of damage to the ERC in preclinical AD, some of which we present in this paper, we hypothesized that a similar population of at-risk subjects would show altered functional coupling during a task that requires engaging the ERC for successful task completion.
Although previous investigations into subtle dysfunction of the MTL in early Alzheimer’s disease progression were restricted by technical limitations as to what could be visualized in vivo (Toga et al. 2012), newer brain mapping techniques can show time-lapse maps of cortical atrophy as it spreads from limbic and temporal cortices to higher-order association and ultimately primary sensorimotor areas (Eskildsen et al. 2013; Thompson et al. 2007). These imaging studies visually highlight the crucial role of the MTL in early stages of Alzheimer’s disease. Given the important role that the MTL has early on in the disease, and the increasing likelihood that interventions will be successful during this time period when pathological damage may be more restricted to the MTL, we focus this article on dysfunction within this region. First, we highlight structural differences in the MTL of prodromal populations and, next, we present novel data about functional (PPI) and structural (DTI) connectivity differences in at-risk subjects using the hippocampus as a seed. Taken together, the results we highlight here add to the body of evidence that neural degeneration in AD pathology occurs before the onset of overt dementia and severe cognitive impairment (Risacher & Saykin 2013). These results also focus on recent advances in neuroimaging techniques, which have allowed the detection of subtle brain changes early in the timecourse of the disease. Historically, the focus on early AD began with discovery of the e4 variant of the APOE gene, a genetic risk factor that increases risk for the disease and lowers the age of onset. Although focusing studies on ε4 carriers who are at elevated risk for future cognitive decline increases the probability of observing pre-clinical brain changes associated with AD, the problem remains that while APOE confers added risk for AD, it is neither necessary nor sufficient to ensure disease onset (Corder et al. 1993; Piaceri et al. 2013). Thus, the ε4 variant remains uniquely useful for clinical research of AD in a group setting, but cannot alone predict the pathological progression of AD.
Identifying differences in the MTL of ε4 carriers at higher risk for the disease is a formidable task due to the convoluted nature of the hippocampus as well as the technical challenge of obtaining high quality images of this area of the brain, which is particularly susceptible to loss of magnetic resonance signal. However, technological advances have allowed for improved visibility and greater detection of magnetic resonance imaging (MRI) signal.
The main question this paper addresses is how impairment in a critical node for early AD, the entorhinal cortex (ERC), affects connected structures within the MTL such as the hippocampus, as well as across the entire brain. The binding of novel inputs and shuttling the information through the hippocampus to long-term storage in cortical regions is moderately impaired in early disease stages (Collie & Maruff 2000; Bondi et al. 2008) and ultimately compromised to such an extent as to prohibit the activities of daily living (Förstl & Kurz 1999). The ERC acts as a gateway to this process (Lepage et al. 1998) and damage in this area has long been known to alter the functional dynamics relevant to human memory performance (Penfield & Milner 1958). Initially, one might expect to see changes in the strategy subjects use to maintain function, as well as downstream effects on functional connectivity from this early pathological target. This node, therefore, became the primary focus early on of many imaging studies in at-risk, but cognitively intact subjects at elevated risk for future cognitive decline in AD.
First, we will review studies that used high-resolution imaging combined with novel computational techniques in order to investigate the structural architecture and functional activity patterns of the hippocampus. Additionally, our group used the hippocampus as a seed to investigate how the connectivity between this region and the rest of the brain is altered during early disease stages. Finally, because connectivity in the brain during task performance may differ from connectivity patterns during rest, we will present new data of how brain areas are functionally correlated with one another during completion of a memory task.
Structural integrity of the MTL in risk for AD
The two main risk factors for developing AD are possession of the e4 variant of the APOE gene and age. However, whether structural changes are identifiable in asymptomatic, cognitively-intact individuals at increased genetic risk for the disease has been a source of intense focus for the past decade (den Heijer et al. 2010; Achterberg et al. 2013; Chételat & Fouquet 2013). Very early in the disease progression, before the onset of clinically apparent symptoms, individual layers, rather than whole regions of cortex, show marked loss of neurons. A study by Gomez-Isla and colleagues of a group of subjects with very mild AD (CDR = 0.5), revealed a 60% reduction in cell count in layer II of the ERC compared to controls (Gomez-Isla et al. 1996). The marked decrement of neuronal density was sufficient to differentiate even the mildest stage of AD from normal aging in this study. Thus, we hypothesized that a technique that assessed cortical thickness, or the distance between inner and outer-gray matter boundaries, would be more sensitive to pathological changes limited to specific cortical laminae in subjects at genetic risk for Alzheimer’s disease. Other studies also suggest that cortical thickness is the better choice over volumetric measurements when assessing the link between phenotype and genetic variant (Winkler et al. 2010) in asymptomatic subjects (Doré et al. 2013).
Cortical unfolding was first applied to visual cortex (Van Essen & Drury 1997; Dale et al. 1999; Fischl et al. 1999) before it was adapted and applied to the MTL (Zeineh et al. 2000; Zeineh et al. 2003) in order to investigate cortical thickness within this convoluted brain region. For an extensive description of the methodology, see Ekstrom et al. 2009. Briefly, the strip of convoluted gray matter across multiple sequential images is stretched and flattened into a 2-dimensional (2D) flat map, maintain nearest neighbor relationships from 3-dimensional (3D) space to 2D maps. While sequential MRI slices can separate areas across images, this technique allows for entire functional areas to be grouped together (i.e. – ERC to be completely encased across multiple images) so each subregion may be evaluated as a single entity rather than viewed as pieces separated across multiple MRI slices. Based on anatomical atlases and histological studies, (Amaral & Insausti 1990; Duvernoy 1998) we calculated cortical thickness for each of the following subregions in the MTL; cornu ammonis (CA) fields 1, 2, and 3, the dentate gyrus (DG), subiculum (SUB), ERC, perirhinal cortex (PRC), parahippocampal cortex (PHC), and the fusiform gyrus (FUS). For each 2D flat voxel, we took the maximum distance values of the corresponding 3D voxels across all layers, effectively extracting this middle layer that is equidistant from the adjacent white matter and cerebrospinal fluid (CSF) and multiplying it by two in order to arrive at a thickness value (see Figure 1).
Figure 1.
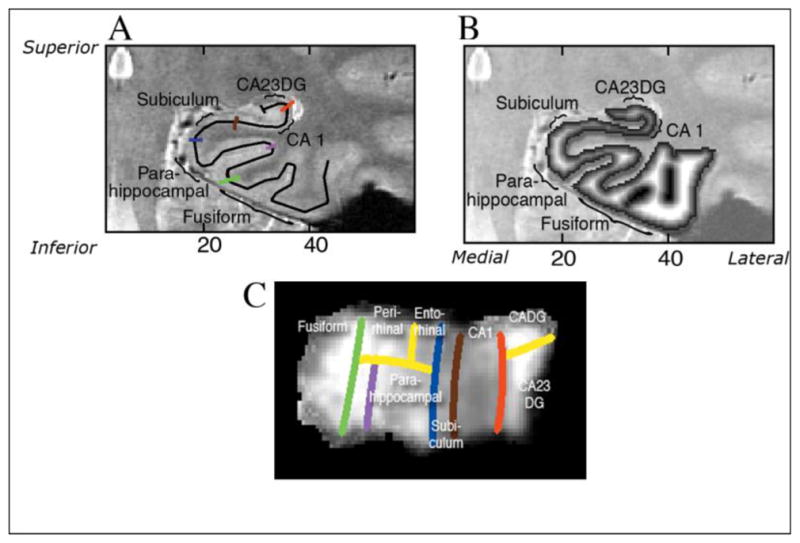
(Adapted with permission from Burggren et al., 2008): A). Regional boundaries on the in-plane are shown in color: lateral aspect of the collateral sulcus (green), the deepest point of the collateral sulcus (CoS) which separates the fusiform from the parahippocampal cortex (purple), the horizontal, medial aspect of the parahippocampal gyrus which forms the border between parahippocampal cortex and the subiculum (blue), the border between CA1 and subiculum, just inferior to the most medial extent of the CA3 and dentate gyrus of the hippocampal body (brown), the border between CA1 and CA2, drawn from the end of the hippocampal fissure to the lateral ventricle, with a 45° angle with respect to the horizontal axis of the subject. B). Coronal slice through 3-D thickness map of one subject, superimposed on an anatomical image. C). An averaged cortical thickness map in flat map space for the left hippocampus of APOE-4 subjects. Gray scale intensity represents cortical thickness, in millimeters, as denoted by the grayscale bar on the right side of the image. The boundary lines are color-coded to match the corresponding line from Figure 1B.
Among the thirty cognitively intact subjects enrolled in this study, the subjects who carried a single copy of the ε4 variant demonstrated, on average, close to a 15% reduction in ERC cortical thickness and almost 13% lower subicular cortical thickness (Burggren et al. 2008). Other studies using sensitive brain mapping tools have also found structural brain differences in cognitively intact ε4 carriers (Lu et al. 2011) as well as found similar results in children (Shaw et al. 2007), and infants (Knickmeyer et al. 2013) carrying the at-risk variant. Additionally, healthy ε4 carriers show accelerated rates of cortical thinning over time (Jak et al. 2007; Donix et al. 2010), suggesting the impact of the ε4 variant may have both a congenital effect on gray matter as well as predispose people to greater rates of cortical change during their lifespan. Donix and colleagues investigated cortical thinning in cognitively normal subjects in their 60’s over a two-year period and showed that subjects carrying the ε4 variant had a 7% greater decrease in Sub thickness and 4% greater decrease in ERC thickness compared to non-carriers (Donix et al. 2010).
Additionally, we used this cortical unfolding technique in subjects with mild cognitive impairment (MCI) to investigate how well subregional difference in the MTL predicted changes in cognitive performance over time. Measurements of longitudinal change metrics have better accuracy at predicting outcomes than static assessments. Annually, approximately 10–15% of MCI patients progress to develop AD (Petersen et al. 2001). Therefore, MCI subjects are typically considered a high-risk population for progression to the disease. Jack and colleagues reported that in MCI patients, subjects carrying the ε4 variant had greater rates of hippocampal volume loss and that rate of change metrics were superior to static cross-sectional measurements (Jack et al. 2008). In amnestic MCI patients (aMCI), Yassa and colleagues reported smaller CA3/dentate and CA1 volumes using hippocampal subfield-level region of interest analyses (Yassa et al. 2010). The authors concluded that the structural changes in hippocampal subfields contributed to the deficits in episodic memory observed in aMCI patients.
Because anterior structures, such as ERC, degrade early in the progression of AD (Braak & Braak 1991), and evidence indicating the hippocampus exhibits a rostrocaudal differentiaton of activations during episodic encoding and retrieval (Schacter & Wagner, 1999; Zeineh et al., 2003), we wanted to investigate whether thinner ERC, an anterior MTL subregion, would predict decline in tests of episodic encoding over a two-year period to a greater extent than those of delayed memory performance. We created a Z-score for multiple neuropsychological test measures of memory performance, including scores specific to memory encoding (‘Memory Encoding Domain’) and retrieval (‘Delayed Memory Domain’). Our results showed that ERC thickness predicted decline specifically within the Memory Encoding Domain (r=0.34, p=0.003) but not within the Delayed Memory Domain (Burggren et al., 2011). Therefore, structural thinning in regions affected in the early stages of AD pathology was predictive of cognitive decline on cognitive tests shown to involve these same regions. These results suggest that investigating the regional specificity of the structural differences within the MTL in early stages of AD is crucial to furthering our understanding of the disease’s pathological progression. Overall, the existing literature suggests that longitudinal MRI studies, particularly of the ERC and the hippocampus, are predictive of conversion from AD to MCI and that structural deficits in both prodromal and early stages of AD are greater among ε4 carriers.
Changes in functional activity within MTL subregions
MTL function is intimately tied to episodic memory performance (Schacter & Wagner 1999; Eichenbaum 2000; Squire et al. 2004). Dysfunction in this region is typically among the earliest functional deficits detectable in the progression of AD. However, because functional MRI (fMRI) requires that subjects be actively engaged and participating in the task, its use is limited in more severely demented subjects. In cognitively normal ε4 carriers, initial findings of increased, compensatory blood-oxygen-level-dependent (BOLD) patterns by Bookheimer et al (Bookheimer et al. 2000) have been replicated by others using similar paradigms that engage memory systems (Han et al. 2007; Bondi et al. 2005; Dickerson et al. 2004), but not during tasks that typically remain unaffected in early AD stages (Burggren et al., 2002; Lind et al., 2006). The tasks used in these studies were a digit span task (Burggren et al. 2002), which did not require the encoding of novel episodic events, and a semantic categorization task (Lind et al. 2006). However, variation in study design and methods have made it difficult to clarify the effect of the ε4 variant on the BOLD signal at different stages of the disease in different populations (Trachtenberg et al. 2010). While increased activity may not seem the likely manifestation of advancing disease pathology, some argue that increased BOLD signal in broadly distributed cortical regions reflects the subjects’ increased effort to maintain cognitive performance, before the neural circuit is no longer able to compensate for disease progression and manifests outward symptoms (Bookheimer et al., 2000, Bondi et al., 2005; Dickerson et al., 2004; Han et al., 2007). In the future, the most successful method for investigating the effects of specific risk variants will be longitudinal assessment such that the imaging metric is not simply discriminating between people with different genes, but may predict which people will eventually go on to develop the disease. Taken together these results suggest that the pathophysiological progression of AD specifically damages memory circuits early in the disease, even before the manifestation of memory deficits (Sperling et al. 2010).
However, the hippocampus contains several functionally unique subregions, each of which have been documented to play distinct roles in the processing of novel episodic events (Zeineh et al., 2003; Squire et al., 2004). Using high-resolution imaging combined with the same cortical unfolding algorithm detailed previously in this article, Suthana and colleagues were able to measure activity during a paired associates word task, similar to that used in Bookheimer et al. (Bookheimer et al. 2000), in hippocampal subregions (CA fields 1,2,3; DG and subiculum) and compare patterns in cognitively intact at-risk carriers of the ε4 variant, to non-carriers (Suthana et al. 2010). These results revealed reduced left CA2, 3 and dentate gyrus activity in cognitively intact APOE-4 carriers (Figure 2). The results were somewhat surprising given that more widespread cortical regions showed increased activity during an identical presentation of the task to a similar, yet different, group of genetically at-risk, cognitively-intact subjects. However, the authors suggested that the reduced neural activity within hippocampal subfields may underlie the compensatory patterns outside of the MTL as subjects attempt to compensate for subtle neural dysfunction and cell loss within the hippocampus. Similarly, others groups also found reduced hippocampal activity during the encoding phase of a task in cognitively normal subjects carrying the ε4 variant (Adamson et al., 2011, Trivedi et al., 2006). Notably the activity changes in both the Suthana et al. study and the Adamson et al. study were not accompanied by any memory decline, as demonstrated by the equivalent performance of these subjects on both a pretest of the paired associates word task presented before the scan as well as scoring on the neuropsychological test battery. These findings suggest that the pathological process of AD exerts specific deleterious effects on memory circuits, even before the onset of cognitively apparent deficits in memory performance.
Figure 2.
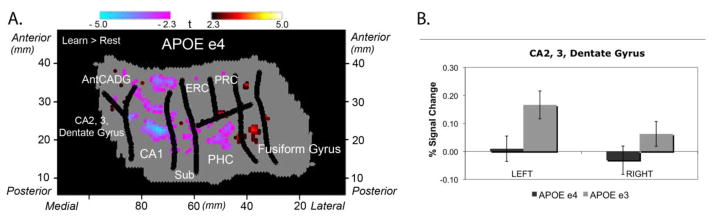
(Adapted from Suthana et al., 2010): On the left is group voxel based-mixed effects unfolded t-test maps (statistical maps of significantly activated and deactivated regions; learn > rest; −2.3 > t > 2.3, p < 0.05 corrected) in 32 subjects (n=16 ε4 carriers). While both groups showed significant increases and decreases compared to baseline during the encoding phase of the task, 4 carriers did not show the increased activation in CA23DG that non-carriers demonstrated. Direct comparison of the % signal change in both genetic risk groups is shown on the right.
Connectivity pattern differences in subjects at increased risk for AD
Although the link between ε4 possession and alterations to functional brain network activity have been documented, the relationship of this variant to whole brain structural network and white matter structure remains less clear. However, a growing body of research points to the disconnection between major regions in AD (Delbeuck et al. 2003), white matter degradation that is concomitant with gray matter loss (Stricker et al. 2009; Salat et al. 2010), and the resulting demyelination that reduces communication between different brain regions (Bartzokis et al. 2007). Using Diffusion tensor imaging (DTI) can quantify the density of white matter bundles connecting different brain regions and, by extension, describe the macroscopic whole brain “structural” network Recent studies report reduced structural network connectivity in AD (Lo et al. 2010). Our lab has examined structural network properties in aging, non-demented APOE ε4 carriers and non-carriers, (Brown et al. 2011). For this study, we enrolled 55 cognitively-normal subjects (25 ε4 carriers) in order to derive whole brain structural graphs using fiber tractography, and then applied graph theory to assess structural network properties (see Figure 3). Relative to non-carriers, subjects with the ε4 variant demonstrated an accelerated age-related loss of mean local interconnectivity (r=−0.64, P≤ 0.01) and regional local interconnectivity decreases in the precuneus (r=−0.64), medial orbitofrontal cortex (r=−0.5), and lateral parietal cortex (r=−0.52, all P<0.05), (see Figure 4). All of these regions are part of the default mode network (DMN; Damoiseaux, Prater, et al. 2012). Frequent findings of reduced DMN connectivity in functional data have been found across a range of populations (Damoiseaux, Seeley, et al. 2012; Damoiseaux, Prater, et al. 2012; Buckner et al. 2009) and may reflect a reduced ability to switch on and off as related to task performance in advance of incipient AD. An additional finding of our structural network study was that the mean clustering coefficient and mean cortical thickness losses were accelerated with advancing age in ε4 carriers compared to ε3 carriers. Overall in these cognitively intact ε4 carriers, at both the local and global level, ε4 carriers showed neural loss and reduced connectivity that increased with advancing age, predicted cognitive decline with age, and altered the structure of large-scale memory networks.
Figure 3.
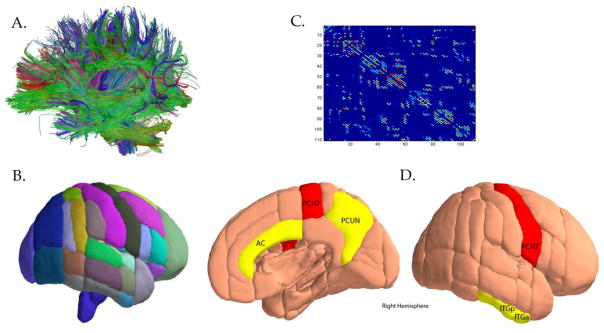
A). Fiber tractography was used to derive whole brain structural graphs; B). Graph theory was then applied to assess structural network properties for each region based on the Harvard-Oxford subcortical and probabilistic atlases; C). Connectivity matrices were created for every region’s connectedness to other brain regions; D). Adapted from Brown et al. PNAS 2011 with permission: Nodes with significant negative APOE-4 x age interaction for clustering coefficient (P < 0.05 corrected; FDR corrected), while nodes colored in red indicated the same measure at an exploratory threshold (P < 0.005, uncorrected). The abbreviations for nodes include: FORB (frontal orbital cortex), AC, anterior cingulate; ITGa, inferior temporal gyrus (anterior); PCUN, precuneus (posterior); PCNT, precentral gyrus; ITGp, SUBC, subcallosal cortex (part of the ventromedial prefrontal cortex); inferior temporal gyrus; and SMGp, supramarginal gyrus (posterior).
Figure 4.
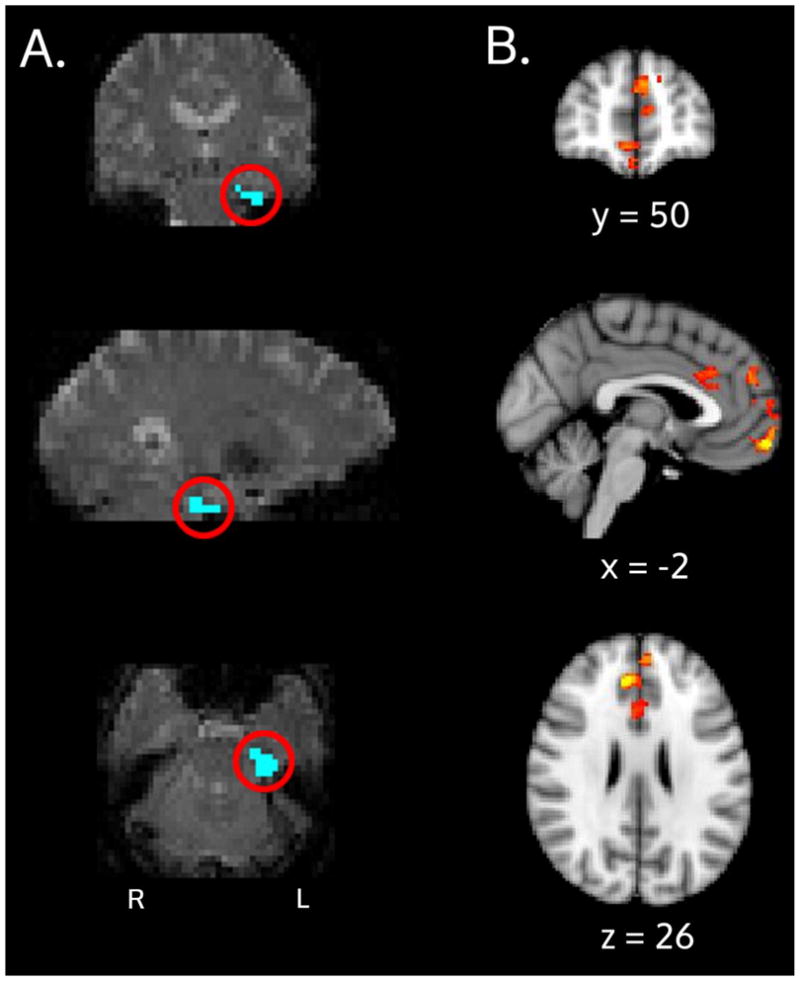
PPI Interaction results: A) The ERC seed (blue, circled in red) for an example subject is shown and overlaid on an individual subject’s fMRI space. B) Group-level results for the APOE x age interaction. These medial prefrontal areas are regions where ε4 carriers showed decreased correlation with the ERC seed and ε3 carriers showed increased correlation, during the retrieval portion of the task.
Numerous other groups have used DTI to detect early pathological changes in healthy adults at increased risk for AD. One DTI study reported that nondemented APOE ε4 carriers over 60 years old had lower fractional anisotropy values in the left medial temporal lobe (Honea et al., 2009). Bendlin and colleagues used DTI to healthy older subjects with elevated CSF biomarkers such as P-Tau and P-Tau/Aβ42 levels and found these CSF biomarkers were related to DTI metrics of white matter microstructure (Bendlin et al. 2012). A DTI study in APOE ε2 carriers showed that these individuals had higher FA values in the superior longitudinal fasciculus, right thalamus and the bilateral anterior limbs of the internal capsule, in addition to the posterior cingulum and corpus callosum, suggesting that subjects with the e2 variant have more robust white matter integrity that may be associated with decreased vulnerability to developing AD (Chiang et al. 2012). Taken together, these results suggest that even before cognitive symptoms become outwardly apparent, subjects whose risk for AD is altered have a pattern of white matter connectivity differences that correlate to AD-related pathology.
Functional connectivity alterations across the brain
Functional connectivity analyses have traditionally used resting state fMRI to investigate whether whole-brain connectivity is disrupted in cognitively-intact subjects at increased risk for the disease. Several studies have documented alterations in the functional brain connectome of cognitively normal at-risk subjects (Jinhui et al. 2013; Patel et al. 2013; Wang et al. 2012; Machulda et al. 2011; Haase et al. 2013; Damoiseaux, et al. 2012). Standard functional connectivity analyses such as these typically calculate a correlation between the BOLD timeseries for a seed region of interest and the rest of the brain. For this study, we performed a psycho physiological interaction (PPI) analysis, where a seed region of interest is created and used to find those regions that are functionally correlated with it during one portion of the task (e.g. “learning” phase of task) but not during another phase (e.g. “rest” phase). The purpose of this technique is to isolate task specific modulations of functional connectivity. Such transient couplings during cognitive challenge in a vulnerable domain (e.g., episodic memory) may be more sensitive to incipient disease than are intrinsic functional connections. Methods: We enrolled 35 non-demented subjects, 17 of whom carried a single copy of the ε4 variant. All subjects were screened for major psychiatric or medical conditions, including hypertension or cardiovascular disease, which might confound results. There were no significant differences in any of the demographic characteristics detailed in Table 1. We used a paired associates task that simultaneously presented pairs of unrelated words (e.g. “window” and “book” or “message” and “order”). This task has been used previously in our lab with results published elsewhere (Bookheimer et al. 2000; Suthana et al. 2010). Subjects were presented with these pairs seven times using headphones and goggles for both aural and visual presentation during the encoding portion of the task. A 30-second baseline block was used where subjects were presented with a symbol (“+” or “o”) and asked to press a button each time the symbol changed. The retrieval portion of the task presented subjects with the first word of each pair and asked subjects to silently recall the second word. The “retrieval portion” refers to the fMRI block during the scan, and, therefore, the fMRI analysis of “recall” is intended to assess immediate recall. If subjects believed they correctly recalled the missing word during the “retrieval” block, they were asked to push a button inside the scanner. A total of six blocks of encoding and retrieval sessions were presented over the duration of the scan. Performance was immediately assessed inside the scanner after completion of the task by prompting subjects with the first word from each pair and asking for the missing word in order. This post-scan test was meant to ensure subjects were attending to the task and successfully able to retrieve the missing word when prompted with the first word from each pair. Just prior to scanning, subjects were also evaluated outside of the scanner with an alternate version of the paired words task in order to expose them to the task parameters. The alternate version of the task also included 6 learning and recall blocks to assess learning and retrieval of the 7 word pairs.
Table 1. Demographic Information.
Demographic and clinical characteristics of the subject groups: Values shown are groups means + standard deviation.
| APOE e3 (n=18) | APOE e4 (n=17) | |
|---|---|---|
| Age | 60.3±7.1 | 63.9±8.4 |
| Gender (%=male) | 33.3 | 44.4 |
| Family History of AD(%)* | 44.4 | 52.9 |
| Years of Education | 15.8±2.3 | 16.8±2.4 |
| MMSE | 29.3±.9 | 28.7±1.4 |
Family history is defined as having had at least one first-degree relative afflicted with AD. None of the characteristics were found to be significantly different between the groups.
• Structural image analysis
MRI scans were collected on a Siemens Allegra 3T scanner (Siemens AG) with an eight-channel coil at the UCLA Center for Cognitive Neurosciences. Using the same hippocampal segmentation and cortical unfolding procedure described in detail above and elsewhere (Zeineh et al. 2003; Ekstrom et al. 2009), we manually traced gray matter, white matter and CSF regions on in-plane hippocampal high-resolution (HHR) images. Subregional boundaries were created using anatomical landmarks (Duvernoy 1998; Amaral & Insausti 1990) for the following ROI’s: CA1, CA23DG, ERC, PRC, PHC, FUS, and SUB. CA1, CA23DG and SUB were further divided into anterior and posterior portions where the head of the hippocampus transitioned to the tail. These ROI’s were aligned to the functional images with a 6-degree-of-freedom (DOF) transformation ad downsampled to HHR fMRI resolution with the FMRIB Software Library’s Linear Image Registration Tool (FLIRT; http://fsl.fmrib.ox.ac.uk/fsl/fslwiki/). Using similar methods detailed above (Burggren et al. 2008; Ekstrom et al. 2009), cortical thickness was calculated in each individual subregion. For registration of the HHR scan to the whole brain (WB) fMRI scan, we used a multi-stage registration process. 1) First, we registered the HHR structural scan to the WB structural (using 6 DOF; a bounding box was used to cover the majority of the brain in coronal sections in order to compensate for the limited field of view in the HHR images); 2) next we registered the WB structural to the WB matched bandwidth scan (Echo-planar imaging optimized Boundary Based Registration in FSL); 3) Last, we registered the EB matched bandwidth scan to the WB functional scan using 6 DOF. We used FSL BET to skull strip all scans and only used linear registration during all registration processes.
• Functional image pre-processing
We used FSL FEAT to analyze WB fMRI data for functional activation. The data were motion corrected using MCFLIRT, smoothed with a 5mm Gaussian kernel and skull-stripped. A high-pass filter was applied with a cut-off of 100s.
• Functional activity
We analyzed functional data for individual subjects using a general linear model in FEAT, which included regressors for the encoding and retrieval portions of the task, convolved with a double-gamma shaped hemodynamic response. Next, we constructed a regressor for the seed timeseries of left ERC, which was the mean of all voxel’s timeseries within the seed region. Lastly, the psychophysiological interaction (PPI) was calculated as the scalar product of each convolved task (‘psych’) and the ROI timeseries (‘phys’). This method has been shown to improve both specificity and sensitivity in PPI modeling. We used a generalized form of context-dependent PPI (gPPI; http://www.nitrc.org/projects/gppi), which incorporated both the “learn” and “recall” conditions of our tasks into the same PPI model. By more comprehensively modeling the by spanning the entire experimental space, this method has been shown to improve specificity and sensitivity in PPI modeling (McLaren et al. 2012).
First, a PPI analysis was run for individual subjects without thresholding, which was reserved for the group level. A group-level model was created that included age, APOE-4 status, APOE x age interaction, gender, years of education and family history of dementia. The group-level analysis was run with FEAT using the FLAME-1 modeling option with cluster thresholding of Z=2.3 and p=0.05 using automatic outlier downweighting. Using the FSL Harvard-Oxford cortical/subcortical atlas and the FSL MNI152 cerebellum atlas, we then created a pre-thresholding mask that included cortical gray matter, subcortical nuclei, and the cerebellum.
• Results & Conclusions
There was a significant APOE-3 x age interaction for clusters that had greater PPI during retrieval. Specifically, the left ERC correlation to these regions during recall was significantly higher with age for the APOE-3 carriers than subjects carrying the ε4 allele (See Table 2).
Table 2. Cluster Index results for the PPI analysis.
Clusters that had significantly higher functional connectivity with the ERC seed during the retrieval portion compared to the rest phase of the task, using an APOE x age interaction model.
| Cluster Index | Z | x | y | z | Region |
|---|---|---|---|---|---|
| 2 | 4.14 | −2 | 58 | −12 | Frontal Pole |
| 2 | 3.5 | 0 | 64 | −6 | Frontal Pole |
| 2 | 3.3 | −4 | 50 | 28 | Superior Frontal Gyrus |
| 2 | 3.11 | 6 | 50 | −10 | Frontal Medial Cortex |
| 2 | 3.03 | 2 | 66 | 2 | Frontal Pole |
| 2 | 2.96 | 10 | 62 | 0 | Frontal Pole |
| 1 | 4.27 | 8 | 38 | 26 | Paracingulate Gyrus |
| 1 | 3.47 | 4 | 20 | 28 | Anterior Cingulate Gyrus |
| 1 | 3.03 | −4 | 28 | 30 | Anterior Cingulate Gyrus |
| 1 | 2.76 | 0 | 28 | 20 | Anterior Cingulate Gyrus |
| 1 | 2.65 | 8 | 44 | 16 | Paracingulate Gyrus |
| 1 | 2.48 | 6 | 14 | 30 | Anterior Cingulate Gyrus |
APOE ε3 carriers showed more MTLprefrontal cortical engagement with increasing age, potentially reflecting an age-related compensatory cognitive mechanism to complete the task while ε4 carriers showed less MTL-prefrontal coupling with increasing age.
Discussion
It is evident that AD predominantly affects the temporal lobes, especially in early stages of the disease, and this pathology is clinically supported by episodic memory impairment; the hallmark clinical symptom of the disease. However, damage to the hippocampus is unlikely to be contained locally without having widespread, detrimental or compensatory effects elsewhere in the brain. We are just beginning to understand the magnitude that local damage to the hippocampus may have in damaging neural circuitry as the disease progresses. Recent advances in non-invasive neuroimaging techniques applied to earlier stages of the disease, even in asymptomatic, genetically at-risk individuals, have shown alterations to activity patterns within the hippocampus, more widespread alterations to activity patterns in cortical regions, and alterations to functional and structural connectivity. Although the brain changes that precede cognitive symptoms may be subtle and require sensitive neuroimaging techniques to identify them, the possibility that ongoing advances in neuroimaging may soon allow us to predict which individuals are at the highest risk for subsequent decline and the onset of AD is becoming a more realistic goal. Clearly, morphological changes within the ERC and hippocampus may have large-scale effects in the brain and are identifiable before the onset of cognitive changes.
Predictably, the structural changes within ERC and the hippocampus in asymptomatic, but genetically at-risk subjects, may lead to changes in task-related brain activation such as decreased activity in the MTL (Suthana et al. 2010), as well as increased, possibly compensatory activity in the cortex (Bookheimer et al., 2000; Bondi et al., 2005; Dickerson et al., 2004; Han et al., 2007), as well as alter the structural (Brown et al. 2011) and functional (new PPI data presented here) networks both locally in the MTL and across the brain. Results by Brown et al demonstrated decreased local clustering across the brain of these aging, non-demented, genetically at-risk subjects, while decreased functional coupling with advancing age was evidenced by the new PPI data.
These results underscore the debate of how AD pathology spreads in the brain in early stages of the disease. A primary model posits a trans-synaptic model of spreading pathology, originating in the ERC before spreading to the hippocampus proper, posterior cingulate and cortical regions. Recent publications have highlighted the model that tau pathology propagates from ERC to downstream neurons in the synaptic circuit and subsequently spreads along anatomically connected networks (Liu et al. 2012; de Calignon et al. 2012). The network diffusion model, however, suggests that there is no point of origin for disease spread; rather, certain subnetworks demonstrate early collective atrophy resulting from the burden of elevated metabolic activity across the lifespan (Raj et al. 2012; Buckner et al. 2009). These findings highlight the crucial role of the ERC in early stages of AD, and it is the only region in the very earliest disease stage of both models that is affected. Future investigations will continue to delineate which model represents the spreading pathology of AD.
Research is ongoing as to whether these early functional and structural alterations will be useful clinically in predicting insipient cognitive decline. The most crucial addition would be to clearly define the changing structural and functional patterns longitudinally in a single group of subjects. However, these studies are only now being conducted due to recent advances in fMRI technology that have made it possible to investigate subregional hippocampal changes as well as alterations to functional and structural networks connected to this region. It is likely that the most successful neuroimaging investigations of the relationship between genetics and AD pathology will combine most, if not all, of the techniques described here, especially as the disease progresses through different brain regions and neural networks.
In the new data presented here using psychophysiological interaction to find regions more functionally correlated with one another during a portion of a task, but not during other portions of a task, we found a significant interaction of APOE and age. Specifically, by using the ERC as a seed during the retrieval portion of a memory task, and correcting for age and gender, we found significantly decreased correlation with the seed in prefrontal areas of APOE ε4 carriers while ε3 subjects demonstrated increased correlation of these areas. These findings suggest that the ε4-variant may lead to decreased functional coupling during memory retrieval with increasing age.
In the evidence presented above, it is argued that asymptomatic individuals demonstrate ample identifiable brain changes before the advent of cognitive decline. The predictive nature of these findings is only beginning to be understood and applied to asymptomatic populations without real application to individual patients. The utility of these alterations is mainly restricted to understanding how the temporal lobe and its connectedness throughout the rest of the brain is altered in the decade before the onset of clinical, cognitive symptoms. Clearly the expense of applying neuroimaging in a clinical setting and the lack of a clear picture of every stage along the timecourse of disease progress is a major drawback for expanding these techniques to the general population. However, the advances made in the last decade of identifying alterations to MTL structure and function are clearly crucial in furthering our understanding of how these crucial brain structures are affected and suggesting ways that this pathological progression may be slowed or, hopefully, stopped completely. As new treatments are developed and made available, neuroimaging offers the hope of identifying prodromal patients before cognitive decline and enabling successful intervention before fatal brain damage.
Acknowledgments
The authors thank Ms. Natacha Donoghue and Ms. Jacqueline Martinez for help in subject recruitment, data management, and study coordination.
Funding support: Supported by NIH grants P01-AG025831, R01-AG13308, P50-AG 16570, MH/AG58156, MH52453; AG10123; M01-RR00865, General Clinical Research Centers Program, the Fran and Ray Stark Foundation Fund for Alzheimer’s Disease Research; the Larry L. Hillblom Foundation. No company provided support of any kind for this study.
Footnotes
Financial Disclosure: The primary investigator has no financial interests that could conflict with the current study.
References
- Adamson MM, et al. Reduced hippocampal activity during encoding in cognitively normal adults carrying the APOE ε 4 allele. [Accessed March 5, 2013];Neuropsychologia. 2011 49(9):2448–55. doi: 10.1016/j.neuropsychologia.2011.04.022. Available at: http://dx.doi.org/10.1016/j.neuropsychologia.2011.04.022. [DOI] [PMC free article] [PubMed] [Google Scholar]
- Amaral DG, Insausti R. In: Hippocampal Formation. Praxinos EG, editor. San Diego: Academic Press; 1990. pp. 711–755. [Google Scholar]
- Apostolova LG, et al. Hippocampal atrophy and ventricular enlargement in normal aging, mild cognitive impairment (MCI), and Alzheimer Disease. [Accessed September 18, 2013];Alzheimer disease and associated disorders. 26(1):17–27. doi: 10.1097/WAD.0b013e3182163b62. Available at: http://www.pubmedcentral.nih.gov/articlerender.fcgi?artid=3286134&tool=pmcentrez&rendertype=abstract. [DOI] [PMC free article] [PubMed] [Google Scholar]
- Bartzokis G, Lu PH, Mintz J. Human brain myelination and amyloid beta deposition in Alzheimer’s disease. [Accessed June 30, 2010];Alzheimer’s & dementia: the journal of the Alzheimer’s Association. 2007 3(2):122–5. doi: 10.1016/j.jalz.2007.01.019. Available at: http://www.pubmedcentral.nih.gov/articlerender.fcgi?artid=2442864&tool=pmcentrez&rendertype=abstract. [DOI] [PMC free article] [PubMed] [Google Scholar]
- Bendlin BB, et al. CSF T-Tau/Aβ42 predicts white matter microstructure in healthy adults at risk for Alzheimer’s disease. [Accessed April 22, 2013];PloS one. 2012 7(6):e37720. doi: 10.1371/journal.pone.0037720. Available at: http://www.pubmedcentral.nih.gov/articlerender.fcgi?artid=3368882&tool=pmcentrez&rendertype=abstract. [DOI] [PMC free article] [PubMed] [Google Scholar]
- Bondi MW, et al. fMRI evidence of compensatory mechanisms in older adults at genetic risk for Alzheimer disease. Neurology. 2005;64(3):501–508. doi: 10.1212/01.WNL.0000150885.00929.7E. Available at: http://www.ncbi.nlm.nih.gov/entrez/query.fcgi?cmd=Retrieve&db=PubMed&dopt=Citation&list_uids=15699382. [DOI] [PMC free article] [PubMed] [Google Scholar]
- Bondi MW, et al. Neuropsychological contributions to the early identification of Alzheimer’s disease. [Accessed March 1, 2013];Neuropsychology review. 2008 18(1):73–90. doi: 10.1007/s11065-008-9054-1. Available at: http://www.pubmedcentral.nih.gov/articlerender.fcgi?artid=2882236&tool=pmcentrez&rendertype=abstract. [DOI] [PMC free article] [PubMed] [Google Scholar]
- Bookheimer SY, et al. Patterns of brain activation in people at risk for Alzheimer’s disease. N Engl J Med. 2000;343(7):450–456. doi: 10.1056/NEJM200008173430701. Available at: http://www.ncbi.nlm.nih.gov/entrez/query.fcgi?cmd=Retrieve&db=PubMed&dopt=Citation&list_uids=10944562. [DOI] [PMC free article] [PubMed] [Google Scholar]
- Braak H, Braak E. Neuropathological stageing of Alzheimer-related changes. Acta Neuropathol (Berl) 1991;82(4):239–259. doi: 10.1007/BF00308809. Available at: http://www.ncbi.nlm.nih.gov/entrez/query.fcgi?cmd=Retrieve&db=PubMed&dopt=Citation&list_uids=1759558. [DOI] [PubMed] [Google Scholar]
- Brown JA, et al. Brain network local interconnectivity loss in aging APOE-4 allele carriers. [Accessed November 22, 2011];Proceedings of the National Academy of Sciences. 2011 108(51):20760–5. doi: 10.1073/pnas.1109038108. Available at: http://www.pubmedcentral.nih.gov/articlerender.fcgi?artid=3251140&tool=pmcentrez&rendertype=abstract. [DOI] [PMC free article] [PubMed] [Google Scholar]
- Buckner RL, et al. Cortical hubs revealed by intrinsic functional connectivity: mapping, assessment of stability, and relation to Alzheimer’s disease. [Accessed February 27, 2013];The Journal of neuroscience: the official journal of the Society for Neuroscience. 2009 29(6):1860–73. doi: 10.1523/JNEUROSCI.5062-08.2009. Available at: http://www.pubmedcentral.nih.gov/articlerender.fcgi?artid=2750039&tool=pmcentrez&rendertype=abstract. [DOI] [PMC free article] [PubMed] [Google Scholar]
- Burggren AC, et al. Reduced cortical thickness in hippocampal subregions among cognitively normal apolipoprotein E e4 carriers. Neuroimage. 2008;41(4):1177–1183. doi: 10.1016/j.neuroimage.2008.03.039. Available at: http://www.ncbi.nlm.nih.gov/entrez/query.fcgi?cmd=Retrieve&db=PubMed&dopt=Citation&list_uids=18486492. [DOI] [PMC free article] [PubMed] [Google Scholar]
- Burggren AC, et al. Specificity of brain activation patterns in people at genetic risk for Alzheimer disease. Am J Geriatr Psychiatry. 2002;10(1):44–51. Available at: http://www.ncbi.nlm.nih.gov/entrez/query.fcgi?cmd=Retrieve&db=PubMed&dopt=Citation&list_uids=11790634. [PubMed] [Google Scholar]
- Burggren AC, et al. Thickness in Entorhinal and Subicular Cortex Predicts Episodic Memory Decline in Mild Cognitive Impairment. [Accessed March 17, 2011];International Journal of Alzheimer’s Disease. 2011 doi: 10.4061/2011/956053. In Press. Available at: http://www.sage-hindawi.com/journals/ijad/2011/956053/ [DOI] [PMC free article] [PubMed]
- De Calignon A, et al. Propagation of tau pathology in a model of early Alzheimer’s disease. [Accessed February 27, 2013];Neuron. 2012 73(4):685–97. doi: 10.1016/j.neuron.2011.11.033. Available at: http://www.pubmedcentral.nih.gov/articlerender.fcgi?artid=3292759&tool=pmcentrez&rendertype=abstract. [DOI] [PMC free article] [PubMed] [Google Scholar]
- Chiang GC, et al. White matter alterations in cognitively normal apoE ε2 carriers: insight into Alzheimer resistance? [Accessed May 13, 2013];AJNR. American journal of neuroradiology. 2012 33(7):1392–7. doi: 10.3174/ajnr.A2984. Available at: http://www.ncbi.nlm.nih.gov/pubmed/22383234. [DOI] [PMC free article] [PubMed] [Google Scholar]
- Collie A, Maruff P. The neuropsychology of preclinical Alzheimer’s disease and mild cognitive impairment. [Accessed May 14, 2013];Neuroscience and biobehavioral reviews. 2000 24(3):365–74. doi: 10.1016/s0149-7634(00)00012-9. Available at: http://www.ncbi.nlm.nih.gov/pubmed/10781696. [DOI] [PubMed] [Google Scholar]
- Corder EH, et al. Gene dose of apolipoprotein E type 4 allele and the risk of Alzheimer’s disease in late onset families. Science. 1993;261(5123):921–923. doi: 10.1126/science.8346443. Available at: http://www.ncbi.nlm.nih.gov/entrez/query.fcgi?cmd=Retrieve&db=PubMed&dopt=Citation&list_uids=8346443. [DOI] [PubMed] [Google Scholar]
- Dale AM, Fischl B, Sereno MI. Cortical surface-based analysis. I. Segmentation and surface reconstruction. Neuroimage. 1999;9(2):179–194. doi: 10.1006/nimg.1998.0395. Available at: http://www.ncbi.nlm.nih.gov/entrez/query.fcgi?cmd=Retrieve&db=PubMed&dopt=Citation&list_uids=9931268. [DOI] [PubMed] [Google Scholar]
- Damoiseaux JS, Prater KE, et al. Functional connectivity tracks clinical deterioration in Alzheimer’s disease. [Accessed March 5, 2013];Neurobiology of aging. 2012 33(4):828.e19–30. doi: 10.1016/j.neurobiolaging.2011.06.024. Available at: http://www.pubmedcentral.nih.gov/articlerender.fcgi?artid=3218226&tool=pmcentrez&rendertype=abstract. [DOI] [PMC free article] [PubMed] [Google Scholar]
- Damoiseaux JS, Seeley WW, et al. Gender modulates the APOE ε4 effect in healthy older adults: convergent evidence from functional brain connectivity and spinal fluid tau levels. [Accessed May 2, 2013];The Journal of neuroscience: the official journal of the Society for Neuroscience. 2012 32(24):8254–62. doi: 10.1523/JNEUROSCI.0305-12.2012. Available at: http://www.pubmedcentral.nih.gov/articlerender.fcgi?artid=3394933&tool=pmcentrez&rendertype=abstract. [DOI] [PMC free article] [PubMed] [Google Scholar]
- Delbeuck X, Van der Linden M, Collette F. Alzheimer’s disease as a disconnection syndrome? [Accessed May 9, 2013];Neuropsychology review. 2003 13(2):79–92. doi: 10.1023/a:1023832305702. Available at: http://www.ncbi.nlm.nih.gov/pubmed/12887040. [DOI] [PubMed] [Google Scholar]
- Dickerson BC, et al. Medial temporal lobe function and structure in mild cognitive impairment. Ann Neurol. 2004;56(1):27–35. doi: 10.1002/ana.20163. Available at: http://www.ncbi.nlm.nih.gov/entrez/query.fcgi?cmd=Retrieve&db=PubMed&dopt=Citation&list_uids=15236399. [DOI] [PMC free article] [PubMed] [Google Scholar]
- Donix M, et al. Longitudinal changes in medial temporal cortical thickness in normal subjects with the APOE-4 polymorphism. Neuroimage. 2010;53(1):37–43. doi: 10.1016/j.neuroimage.2010.06.009. Available at: http://www.ncbi.nlm.nih.gov/entrez/query.fcgi?cmd=Retrieve&db=PubMed&dopt=Citation&list_uids=20541611. [DOI] [PMC free article] [PubMed] [Google Scholar]
- Duvernoy HM. The Human Hippocampus: Functional Anatomy, Vascularization, and Serial Sections with MRI. Berlin: Springer; 1998. [Google Scholar]
- Eichenbaum H. A cortical-hippocampal system for declarative memory. [Accessed March 11, 2013];Nature reviews. Neuroscience. 2000 1(1):41–50. doi: 10.1038/35036213. Available at: http://www.ncbi.nlm.nih.gov/pubmed/11252767. [DOI] [PubMed] [Google Scholar]
- Ekstrom AD, et al. Advances in high-resolution imaging and computational unfolding of the human hippocampus. Neuroimage. 2009;47(1):42–49. doi: 10.1016/j.neuroimage.2009.03.017. Available at: http://www.ncbi.nlm.nih.gov/entrez/query.fcgi?cmd=Retrieve&db=PubMed&dopt=Citation&list_uids=19303448. [DOI] [PMC free article] [PubMed] [Google Scholar]
- Eskildsen SF, et al. Prediction of Alzheimer’s disease in subjects with mild cognitive impairment from the ADNI cohort using patterns of cortical thinning. [Accessed September 18, 2013];Neuro Image. 2013 65:511–21. doi: 10.1016/j.neuroimage.2012.09.058. Available at: http://www.ncbi.nlm.nih.gov/pubmed/23036450. [DOI] [PMC free article] [PubMed] [Google Scholar]
- Van Essen DC, Drury HA. Structural and functional analyses of human cerebral cortex using a surface-based atlas. J Neurosci. 1997;17(18):7079–7102. doi: 10.1523/JNEUROSCI.17-18-07079.1997. Available at: http://www.ncbi.nlm.nih.gov/entrez/query.fcgi?cmd=Retrieve&db=PubMed&dopt=Citation&list_uids=9278543. [DOI] [PMC free article] [PubMed] [Google Scholar]
- Fischl B, et al. High-resolution intersubject averaging and a coordinate system for the cortical surface. Hum Brain Mapp. 1999;8(4):272–284. doi: 10.1002/(SICI)1097-0193(1999)8:4<272::AID-HBM10>3.0.CO;2-4. Available at: http://www.ncbi.nlm.nih.gov/entrez/query.fcgi?cmd=Retrieve&db=PubMed&dopt=Citation&list_uids=10619420. [DOI] [PMC free article] [PubMed] [Google Scholar]
- Förstl H, Kurz A. Clinical features of Alzheimer’s disease. [Accessed February 28, 2013];European archives of psychiatry and clinical neuroscience. 1999 249(6):288–90. doi: 10.1007/s004060050101. Available at: http://www.ncbi.nlm.nih.gov/pubmed/10653284. [DOI] [PubMed] [Google Scholar]
- Haase L, et al. Functional connectivity during recognition memory in individuals genetically at risk for Alzheimer’s disease. [Accessed March 11, 2013];Human brain mapping. 2013 34(3):530–42. doi: 10.1002/hbm.21451. Available at: http://www.ncbi.nlm.nih.gov/pubmed/22102296. [DOI] [PMC free article] [PubMed] [Google Scholar]
- Han SD, et al. Verbal paired-associate learning by APOE genotype in non-demented older adults: fMRI evidence of a right hemispheric compensatory response. [Accessed October 21, 2010];Neurobiology of aging. 2007 28(2):238–47. doi: 10.1016/j.neurobiolaging.2005.12.013. Available at: http://www.pubmedcentral.nih.gov/articlerender.fcgi?artid=1705815&tool=pmcentrez&rendertype=abstract. [DOI] [PMC free article] [PubMed] [Google Scholar]
- Honea RA, et al. Impact of APOE on the healthy aging brain: a voxel-based MRI and DTI study. [Accessed March 3, 2011];Journal of Alzheimer’s disease: JAD. 2009 18(3):553–64. doi: 10.3233/JAD-2009-1163. Available at: http://www.pubmedcentral.nih.gov/articlerender.fcgi?artid=2892293&tool=pmcentrez&rendertype=abstract. [DOI] [PMC free article] [PubMed] [Google Scholar]
- Jack CR, et al. Longitudinal MRI findings from the vitamin E and donepezil treatment study for MCI. [Accessed March 31, 2011];Neurobiology of aging. 2008 29(9):1285–95. doi: 10.1016/j.neurobiolaging.2007.03.004. Available at: http://www.pubmedcentral.nih.gov/articlerender.fcgi?artid=2768818&tool=pmcentrez&rendertype=abstract. [DOI] [PMC free article] [PubMed] [Google Scholar]
- Jak AJ, et al. Differential cross-sectional and longitudinal impact of APOE genotype on hippocampal volumes in nondemented older adults. [Accessed April 30, 2013];Dementia and geriatric cognitive disorders. 2007 23(6):382–9. doi: 10.1159/000101340. Available at: http://www.pubmedcentral.nih.gov/articlerender.fcgi?artid=2084479&tool=pmcentrez&rendertype=abstract. [DOI] [PMC free article] [PubMed] [Google Scholar]
- Knickmeyer RC, et al. Common Variants in Psychiatric Risk Genes Predict Brain Structure at Birth. [Accessed March 22, 2013];Cerebral cortex (New York, NY: 1991) 2013 doi: 10.1093/cercor/bhs401. Available at: http://www.ncbi.nlm.nih.gov/pubmed/23283688. [DOI] [PMC free article] [PubMed]
- Lepage M, Habib R, Tulving E. Hippocampal PET activations of memory encoding and retrieval: the HIPER model. [Accessed May 14, 2013];Hippocampus. 1998 8(4):313–22. doi: 10.1002/(SICI)1098-1063(1998)8:4<313::AID-HIPO1>3.0.CO;2-I. Available at: http://www.ncbi.nlm.nih.gov/pubmed/9744418. [DOI] [PubMed] [Google Scholar]
- Lind J, et al. Reduced functional brain activity response in cognitively intact apolipoprotein E epsilon4 carriers. [Accessed March 4, 2013];Brain: a journal of neurology. 2006 129(Pt 5):1240–8. doi: 10.1093/brain/awl054. Available at: http://www.ncbi.nlm.nih.gov/pubmed/16537568. [DOI] [PubMed] [Google Scholar]
- Liu L, et al. Trans-synaptic spread of tau pathology in vivo. [Accessed February 27, 2013];PloS one. 2012 7(2):e31302. doi: 10.1371/journal.pone.0031302. Available at: http://www.pubmedcentral.nih.gov/articlerender.fcgi?artid=3270029&tool=pmcentrez&rendertype=abstract. [DOI] [PMC free article] [PubMed] [Google Scholar]
- Lo C-Y, et al. Diffusion tensor tractography reveals abnormal topological organization in structural cortical networks in Alzheimer’s disease. [Accessed February 28, 2013];The Journal of neuroscience: the official journal of the Society for Neuroscience. 2010 30(50):16876–85. doi: 10.1523/JNEUROSCI.4136-10.2010. Available at: http://www.ncbi.nlm.nih.gov/pubmed/21159959. [DOI] [PMC free article] [PubMed] [Google Scholar]
- Lu PH, et al. Apolipoprotein E genotype is associated with temporal and hippocampal atrophy rates in healthy elderly adults: a tensor-based morphometry study. [Accessed April 30, 2013];Journal of Alzheimer’s disease: JAD. 2011 23(3):433–42. doi: 10.3233/JAD-2010-101398. Available at: http://www.pubmedcentral.nih.gov/articlerender.fcgi?artid=3107252&tool=pmcentrez&rendertype=abstract. [DOI] [PMC free article] [PubMed] [Google Scholar]
- Machulda MM, et al. Effect of APOE ε4 status on intrinsic network connectivity in cognitively normal elderly subjects. [Accessed March 17, 2013];Archives of neurology. 2011 68(9):1131–6. doi: 10.1001/archneurol.2011.108. Available at: http://www.pubmedcentral.nih.gov/articlerender.fcgi?artid=3392960&tool=pmcentrez&rendertype=abstract. [DOI] [PMC free article] [PubMed] [Google Scholar]
- McLaren DG, et al. A generalized form of context-dependent psychophysiological interactions (gPPI): a comparison to standard approaches. [Accessed March 8, 2013];Neuro Image. 2012 61(4):1277–86. doi: 10.1016/j.neuroimage.2012.03.068. Available at: http://www.ncbi.nlm.nih.gov/pubmed/22484411. [DOI] [PMC free article] [PubMed] [Google Scholar]
- Patel KT, et al. Default mode network activity and white matter integrity in healthy middle-aged ApoE4 carriers. [Accessed March 5, 2013];Brain imaging and behavior. 2013 7(1):60–7. doi: 10.1007/s11682-012-9187-y. Available at: http://www.ncbi.nlm.nih.gov/pubmed/23011382. [DOI] [PubMed] [Google Scholar]
- Penfield W, Milner B. Memory deficit produced by bilateral lesions in the hippocampal zone. AMA Arch Neurol Psychiatry. 1958 May;79(5):475–97. doi: 10.1001/archneurpsyc.1958.02340050003001. [DOI] [PubMed] [Google Scholar]
- Petersen RC, et al. Current concepts in mild cognitive impairment. Archives of neurology. 2001;58(12):1985–92. doi: 10.1001/archneur.58.12.1985. Available at: http://www.ncbi.nlm.nih.gov/pubmed/11735772. [DOI] [PubMed] [Google Scholar]
- Piaceri I, Nacmias B, Sorbi S. Genetics of familial and sporadic Alzheimer’s disease. [Accessed September 18, 2013];Frontiers in bioscience (Elite edition) 2013 5:167–77. doi: 10.2741/e605. Available at: http://www.ncbi.nlm.nih.gov/pubmed/23276979. [DOI] [PubMed] [Google Scholar]
- Raj A, Kuceyeski A, Weiner M. A network diffusion model of disease progression in dementia. [Accessed March 3, 2013];Neuron. 2012 73(6):1204–15. doi: 10.1016/j.neuron.2011.12.040. Available at: http://www.pubmedcentral.nih.gov/articlerender.fcgi?artid=3623298&tool=pmcentrez&rendertype=abstract. [DOI] [PMC free article] [PubMed] [Google Scholar]
- Salat DH, et al. White matter pathology isolates the hippocampal formation in Alzheimer’s disease. [Accessed October 2, 2010];Neurobiology of aging. 2010 31(2):244–56. doi: 10.1016/j.neurobiolaging.2008.03.013. Available at: http://www.pubmedcentral.nih.gov/articlerender.fcgi?artid=3038572&tool=pmcentrez&rendertype=abstract. [DOI] [PMC free article] [PubMed] [Google Scholar]
- Schacter DL, Wagner AD. Medial temporal lobe activations in fMRI and PET studies of episodic encoding and retrieval. [Accessed April 4, 2013];Hippocampus. 1999 9(1):7–24. doi: 10.1002/(SICI)1098-1063(1999)9:1<7::AID-HIPO2>3.0.CO;2-K. Available at: http://www.ncbi.nlm.nih.gov/pubmed/10088896. [DOI] [PubMed] [Google Scholar]
- Shaw P, et al. Cortical morphology in children and adolescents with different apolipoprotein E gene polymorphisms: an observational study. Lancet Neurol. 2007;6(6):494–500. doi: 10.1016/S1474-4422(07)70106-0. Available at: http://www.ncbi.nlm.nih.gov/entrez/query.fcgi?cmd=Retrieve&db=PubMed&dopt=Citation&list_uids=17509484. [DOI] [PubMed] [Google Scholar]
- Sperling Ra, et al. Functional alterations in memory networks in early Alzheimer’s disease. Neuromolecular medicine. 2010;12(1):27–43. doi: 10.1007/s12017-009-8109-7. Available at: http://www.ncbi.nlm.nih.gov/pubmed/20069392. [DOI] [PMC free article] [PubMed] [Google Scholar]
- Squire LR, Stark CEL, Clark RE. The medial temporal lobe. [Accessed December 2, 2010];Annual review of neuroscience. 2004 27:279–306. doi: 10.1146/annurev.neuro.27.070203.144130. Available at: http://www.ncbi.nlm.nih.gov/pubmed/15217334. [DOI] [PubMed] [Google Scholar]
- Staresina BP, Cooper E, Henson RN. Reversible Information Flow across the Medial Temporal Lobe: The Hippocampus Links Cortical Modules during Memory Retrieval. [Accessed September 18, 2013];The Journal of neuroscience: the official journal of the Society for Neuroscience. 2013 33(35):14184–92. doi: 10.1523/JNEUROSCI.1987-13.2013. Available at: http://www.ncbi.nlm.nih.gov/pubmed/23986252. [DOI] [PMC free article] [PubMed] [Google Scholar]
- Stricker NH, et al. Decreased white matter integrity in late-myelinating fiber pathways in Alzheimer’s disease supports retrogenesis. [Accessed May 9, 2013];Neuro Image. 2009 45(1):10–6. doi: 10.1016/j.neuroimage.2008.11.027. Available at: http://www.pubmedcentral.nih.gov/articlerender.fcgi?artid=2782417&tool=pmcentrez&rendertype=abstract. [DOI] [PMC free article] [PubMed] [Google Scholar]
- Suthana Na, et al. Reduced hippocampal CA2, CA3, and dentate gyrus activity in asymptomatic people at genetic risk for Alzheimer’s disease. [Accessed October 28, 2010];Neuro Image. 2010 53(3):1077–84. doi: 10.1016/j.neuroimage.2009.12.014. Available at: http://www.ncbi.nlm.nih.gov/pubmed/20005961. [DOI] [PMC free article] [PubMed] [Google Scholar]
- Suthana NA, et al. Reduced hippocampal CA2, CA3, and dentate gyrus activity in asymptomatic people at genetic risk for Alzheimer’s disease. Neuroimage. 2009 doi: 10.1016/j.neuroimage.2009.12.014. Available at: http://www.ncbi.nlm.nih.gov/entrez/query.fcgi?cmd=Retrieve&db=PubMed&dopt=Citation&list_uids=20005961. [DOI] [PMC free article] [PubMed]
- Thompson PM, et al. Tracking Alzheimer’s disease. [Accessed September 18, 2013];Annals of the New York Academy of Sciences. 2007 1097:183–214. doi: 10.1196/annals.1379.017. Available at: http://www.pubmedcentral.nih.gov/articlerender.fcgi?artid=3197831&tool=pmcentrez&rendertype=abstract. [DOI] [PMC free article] [PubMed] [Google Scholar]
- Toga AW, et al. Mapping the human connectome. [Accessed September 18, 2013];Neurosurgery. 2012 71(1):1–5. doi: 10.1227/NEU.0b013e318258e9ff. Available at: http://www.pubmedcentral.nih.gov/articlerender.fcgi?artid=3555558&tool=pmcentrez&rendertype=abstract. [DOI] [PMC free article] [PubMed] [Google Scholar]
- Trachtenberg AJ, Filippini N, Mackay CE. The effects of APOE-epsilon4 on the BOLD response. [Accessed September 8, 2010];Neurobiology of aging. 2010 doi: 10.1016/j.neurobiolaging.2010.03.009. Available at: http://www.ncbi.nlm.nih.gov/pubmed/20409610. [DOI] [PubMed]
- Trivedi MA, et al. Reduced hippocampal activation during episodic encoding in middle-aged individuals at genetic risk of Alzheimer’s disease: a cross-sectional study. [Accessed March 7, 2013];BMC medicine. 2006 4:1. doi: 10.1186/1741-7015-4-1. Available at: http://www.pubmedcentral.nih.gov/articlerender.fcgi?artid=1373642&tool=pmcentrez&rendertype=abstract. [DOI] [PMC free article] [PubMed] [Google Scholar]
- Tyas SL, et al. Transitions to mild cognitive impairments, dementia, and death: findings from the Nun Study. [Accessed May 12, 2013];American journal of epidemiology. 2007 165(11):1231–8. doi: 10.1093/aje/kwm085. Available at: http://www.pubmedcentral.nih.gov/articlerender.fcgi?artid=2516202&tool=pmcentrez&rendertype=abstract. [DOI] [PMC free article] [PubMed] [Google Scholar]
- Wang J, et al. Disrupted functional brain connectome in individuals at risk for Alzheimer’s disease. [Accessed February 28, 2013];Biological psychiatry. 2013 73(5):472–81. doi: 10.1016/j.biopsych.2012.03.026. Available at: http://www.ncbi.nlm.nih.gov/pubmed/22537793. [DOI] [PubMed] [Google Scholar]
- Wang L, et al. Alzheimer disease family history impacts resting state functional connectivity. [Accessed February 27, 2013];Annals of neurology. 2012 72(4):571–7. doi: 10.1002/ana.23643. Available at: http://www.ncbi.nlm.nih.gov/pubmed/23109152. [DOI] [PMC free article] [PubMed] [Google Scholar]
- Winkler AM, et al. Cortical thickness or grey matter volume? The importance of selecting the phenotype for imaging genetics studies. [Accessed March 6, 2013];Neuro Image. 2010 53(3):1135–46. doi: 10.1016/j.neuroimage.2009.12.028. Available at: http://dx.doi.org/10.1016/j.neuroimage.2009.12.028. [DOI] [PMC free article] [PubMed] [Google Scholar]
- Yassa MA, et al. High-resolution structural and functional MRI of hippocampal CA3 and dentate gyrus in patients with amnestic Mild Cognitive Impairment. [Accessed March 7, 2013];Neuro Image. 2010 51(3):1242–52. doi: 10.1016/j.neuroimage.2010.03.040. Available at: http://www.pubmedcentral.nih.gov/articlerender.fcgi?artid=2909476&tool=pmcentrez&rendertype=abstract. [DOI] [PMC free article] [PubMed] [Google Scholar]
- Zeineh MM, et al. Dynamics of the hippocampus during encoding and retrieval of face-name pairs. Science. 2003;299(5606):577–580. doi: 10.1126/science.1077775. Available at: http://www.ncbi.nlm.nih.gov/entrez/query.fcgi?cmd=Retrieve&db=PubMed&dopt=Citation&list_uids=12543980. [DOI] [PubMed] [Google Scholar]
- Zeineh MM, Engel SA, Bookheimer SY. Application of cortical unfolding techniques to functional MRI of the human hippocampal region. Neuroimage. 2000;11(6 Pt 1):668–683. doi: 10.1006/nimg.2000.0561. Available at: http://www.ncbi.nlm.nih.gov/entrez/query.fcgi?cmd=Retrieve&db=PubMed&dopt=Citation&list_uids=10860795. [DOI] [PubMed] [Google Scholar]