

Abstract
LC-DAD-ESI/MS was used to identify 23 flavonoids in the extract of Mexican oregano (Lippia graveolens H.B.K.), a spice and herb, used in the USA and Mexico. The identification of luteolin-7-O-glucoside, apigenin 7-O-glucoside, phloridzin, taxifolin, eriodictyol, scutellarein, luteolin, quercetin, naringenin, pinocembrin and galangin was confirmed by direct comparison with standards. Identification of 6-hydroxyluteolin, two 6-hydroxyluteolin 7-O-glycosides, three pentahydroxyflavanone hexosides, scutellarein 7-O-hexoside, 3-hydroxyphloretin hexoside, and three other flavones, was made by detailed analysis of their UV and mass spectral data. The identification of the flavonoid glycosides was further confirmed through detection of their aglycones following hydrolysis of the samples. The concentration of the identified flavonoids in three samples was also estimated. This is the first report of detection of over 20 flavonoids, including chalcones, in this plant material.
Keywords: Mexican oregano, Lippia graveolens, Flavonoids, LC-DAD-ESI/MS, Identification, Quantification
1. Introduction
Mexican oregano is the leaf of Lippia graveolens H.B.K. (Verbenaceae), an aromatic shrub that grows in Texas and Central America. The leaves with flowers appear under the name “whole oregano” in US food markets as a culinary seasoning. This spice, however, differs from “oregano” or “European oregano”, the leaf of the herb plant, Origanum vulgare L. (Labiatae) (Leung and Foster, 1996; Shan et al., 2005). Mexican oregano is widely used in Mexican and North American dishes and other foods, such as alcoholic beverages, baked goods, meat and meat products, condiments, relishes, milk products, processed vegetables, and snack foods (Leung and Foster, 1996). The leaves have also been used as herbal remedies with purported analgesic, anti-inflammatory, anti-pyretic, anti-spasmodic, and abortifacient properties (Leung and Foster, 1996; Pascual et al., 2001). The leaves, roots and aerial parts of this plant have been reported to contain essential oils, ten or more iridoids, two flavanones (pinocembrin and naringenin), and one naphthoquinoid (lapachenol) (Leung and Foster, 1996; Pascual et al., 2001; Rastrelli et al., 1998; Dominguez et al., 1989). However, there has been no systematic study of the flavonoid components of the leaves of this plant.
With the growing number of reports on the biological activity and nutritional benefits from many individual flavonoids, the identification and quantification of these compounds in foods and food-related plants, such as spices and herbs, is important (Robards et al., 1999; Robards, 2003; Heim et al., 2002). Mexican oregano was analyzed using a liquid chromatographydiode array detection-electrospray ionization/mass spectrometry (LC-DAD-ESI/MSD) screening method (Lin and Harnly, 2007). This report presents the identification and quantification of 23 flavonoids in Mexican oregano. Of these flavonoids, 20 are reported for the first time in this plant.
2. Materials and methods
2.1. Plant materials
A total of 12 packages (14 g/package) of dried plant material labeled as “whole oregano” from a single distributor (Lisy Corp., Miami, FL, USA) were purchased from a local grocery store (Super Fresh Superstore, White Oak, MD, USA. Of these 12 packages, 6 were purchased in 2005 and 6 were purchased in 2006 (almost exactly 1 year later). The 6 packages from 2005 and 3 of the packages from 2006 had the same lot number. The additional 3 packages from 2006 had a different lot number. The contents of the 6 packages purchased in 2005 were mixed and designated as Sample 1. The contents of the 3 packages purchased in 2006, with the same lot number as those from 2005, were mixed and designated Sample 2. The contents of the 3 packages from 2006, with a different lot number, were mixed and designated Sample 3.
The package contents were only coarsely chopped. In the lab, the plant materials were finely powdered using a coffee grinder (Krups, Model 203) and passed through a 40 mesh sieve prior to the extraction. The Mexicano oregano (L. graveolens) was authenticated by the lack of rosmarinic acid found in O. vulgare (Leung and Foster, 1996; Pascual et al., 2001).
2.2. Flavonoid standards
Galangin (I-1, Fig. 1), naringenin (II-2, 95%), quercetin dihydrate (I-7, 98%), phloretin (III-1, 98%), and phloridzin dihydrate (III-1-A, 99%) were purchased from Sigma Chemical Co. (Saint Louis, MO, USA). Luteolin 7-O-glucoside (I-6-A, HPLC grade), scutellarein (I-3), eriodictyol (II-4, HPLC grade), eriodictyol 7-O-glucoside (II-4-A, HPLC grade), sakuranetin (II-3, HPLC grade), and apigenin 7-O-glucoside (I-2-A, HPLC grade) were purchased from Extrasynthese (Genay Cedex, France). (+)-Taxifolin (II-5), luteolin (I-6), and pinocembrin (II-1) were purchased from Indofine Chemical Co. (Somerville, NJ, USA).
Fig. 1.
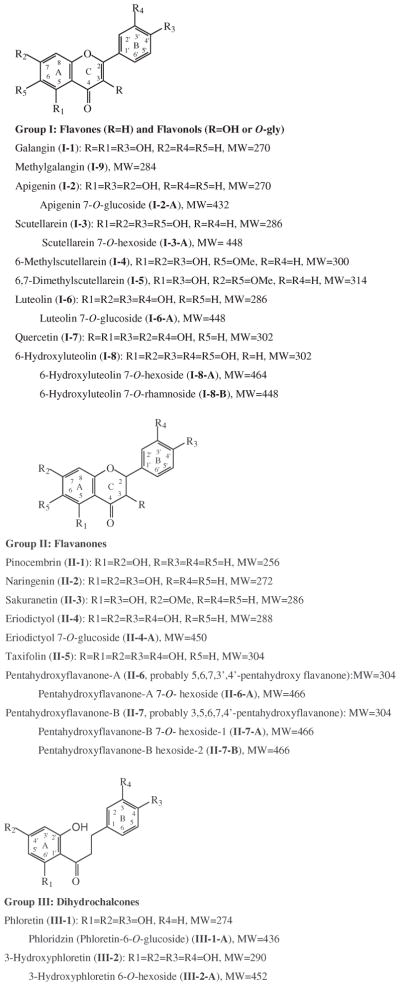
Structures of the flavonoids of Mexican oregano.
2.3. Chemicals
Silica gel 60 F254 TLC plates (E. Merck, Damstadt, Germany), formic acid, hydrochloric acid (37%), HPLC grade acetonitrile, methanol, and chloroform were purchased from VWR Scientific (Seattle, WA, USA). HPLC grade water was prepared from distilled water using a Milli-Q system (Millipore Lab., Bedford, MA, USA).
2.4. Sample preparation for LC-MS study
Plant extracts
50 mg of dried ground plant material was mixed with 5.00 ml of methanol–water (70:30, v/v) and sonicated for 60 min using an FS30H sonicator (40 kHz, 100 W) (Fisher Scientific, Pittsburgh, PA, USA). The temperature of the solution ranged from room temperature (22 °C), at the start of the extraction, to <40 °C at the end of the procedure. The slurry mixture was centrifuged at 2500 rpm for 15 min (IEC Clinical Centrifuge, Damon/IEC Division, Needham, MA, USA) and the supernatant was filtered through a 17 mm (0.45 μm) PVDF syringe filter (VWR Scientific, Seattle, WA, USA), and 25 μl of the extract was used for each injection. In order to avoid errors arising from unexpected degradation of some flavonoids, the LC determinations were completed within 24 h of the extraction.
Hydrolysis
0.50 ml of the filtered extract was mixed with 0.10 ml of concentrated HCl (37%) and heated in a covered tube at 85 °C for 1 h. 0.40 ml of methanol was added to the mixture, and the resulting solution was sonicated for 10 min. The solution was re-filtered prior to HPLC injection, and 20 μl of the solution was injected.
Fractionation by TLC
Approximately 100 mg of the dried extract, obtained from the evaporation of the fresh extract to dryness at 40 °C under vacuum, was dissolved in 0.50 ml of methanol–water (60:40, v/v). TLC separation was carried out on silica gel 60 F254 plates (20 × 20 cm, 0.5 mm thickness) with a developing solvent of chloroform–methanol (85:15, v/v). Under UV-light (VWR, Seattle, WA, USA), seven bands were observed and scraped separately from the TLC plate. The compounds in each band were extracted with methanol–water (60:40, v/v) and filtered before LC-MS detection.
2.5. Sample preparation for quantitative analysis
Samples were extracted as described above for the LC-MS study but only diode array detection was used. Each of the three extracts was prepared in triplicate and each preparation was analyzed in triplicate.
2.6. LC-DAD-ESI/MSD conditions
The LC-DAD-ESI/MS instrument consisted of an 1100 HPLC (pump, de-gasser, column cabinet, and diode array detector, Agilent, Palo Alto, CA, USA) and a mass spectrometer (Agilent LC/MSD SL). A Waters (Waters Corp., Milford, MA, USA) Symmetry column (C18, 5 μm, 250 × 4.6 mm) was used at flow rate of 1.0 ml/min. The column oven temperature was set at 25 °C. The mobile phase consisted of A (0.1% formic acid in water) and B (0.1% formic acid in acetonitrile) and the gradient varied linearly from 14% to 26% B (v/v) in 40 min, to 60% B at 65 min, and finally to 100% B at 70 min and held at 100% B from 71 to 75 min. The DAD was set at 270, 310 and 350 nm to provide real time chromatograms and the UV/Vis spectra from 190 to 650 nm were recorded for plant component identification.
Mass spectra were simultaneously acquired using electrospray ionization in the positive (PI) and negative ionization (NI) modes, at low (70 V) and high fragmentation voltages (250 V) for both ionization modes. For brevity, the high and low fragmentation voltages of the PI and NI modes will be identified as PI250, PI70, NI250, and NI70 in the text. The mass spectra were recorded for the range of m/z 100–1000. A drying gas flow of 13 l/min, a drying gas temperature of 350 °C, a nebulizer pressure of 50 psi, and capillary voltages of 4000 V for PI and 3500 V for NI, were used. The LC system was directly connected with MSD without stream splitting.
3. Results and discussion
3.1. Identification of 12 flavonoids based on comparison with standards
Data from the LC-DAD-ESI/MS were used to identify the flavonoids. Five chromatograms (DAD and TIC traces) are shown in Fig. 2. The retention times (tR), UV λmax values, and the molecular ions of the glucosides and aglycones are listed in Table 1 for each peak. In addition to the chromatograms, the full UV/Vis (190–600 nm) and mass spectra (counts versus m/z for 50–1000 amu) for each peak were also stored. A comparison of the Rt, UV λmax, and MS data of the peaks of the Mexican oregano (Table 1) with those of known standards established that peaks 6, 7, 11, 12, 13, 14, 15, 16, 17, 20, 21 and 22 were luteolin 7-O-glucoside (I-6-A), taxifolin (II-5), apigenin 7-O-glucoside (I-2-A), phloridzin (III-1-A), scutellarein (I-3), eriodictyol (II-4), luteolin (I-6), quercetin (I-7), naringenin (II-2), sakuranetin (II-3), pinocembrin (II-1), and galangin (I-1) (Fig. 1), respectively. Further confirmation was obtained by spiking the extract with each of the standards and repeating the analysis. In each case, the identification was verified.
Fig. 2.

Simultaneous LC-DAD-ESI/MS chromatograms of Mexican oregano extract: (A) UV at 350 nm, (B) PI 70 V, (C) PI 250 V, (D) NI 70 V, and (E) NI 250 V. Chromatographic conditions are described in Section 2.5. Values for Rt, UV λmax, and pseudo-molecular masses for each peak are listed in Table 1.
Table 1.
Peak assignments of the aqueous methanol extract of Mexican oregano
| Peak no.a | tR (min) | [M+H]+/[M−H]− (m/z) | [A+H]+/[A−H]− (m/z) | UV λmax (nm) | Identification |
|---|---|---|---|---|---|
| 1 | 11.90 | 467/465 | 305/303 | 288,360 | Pentahydroxyflavanone-A hexoside (II-6-A) |
| 2 | 13.13 | 465/463 | 303/301 | 282,344 | 6-Hydroxyluteolin 7-O-hexoside (I-8-A) |
| 3 | 15.00 | 467/465 | 305/303 | 288,364 | Pentaflavanone-B hexoside-1 (II-7-A) |
| 4 | 15.27 | 467/465 | 305/303 | 288,364 | Pentaflavanone-B hexoside-2 (II-7-B) |
| 5 | 18.83 | 449/447 | 287/285 | 284,334 | Scutallarein 7-O-hexoside (I-3-A) |
| 6b | 19.46 | 449/447 | 287/285 | 256,266sh,346 | Luteolin 7-O-glucoside (I-6-A) |
| 7b | 20.34 | 305/303 | — | 290,336sh | Taxifolin (II-5) |
| 8c | 24.42 | 449/447 | 303/301 | 282,346 | 6-Hydroxyluteolin 7-O-rhamnoside (I-8-B) |
| 9 | 24.52 | 303/301 | — | 282,346 | 6-Hydroxyluteolin (I-8) |
| 10 | 25.07 | 453/451 | 291/289 | 226,286 | 3-Hydroxyphloretin 6′-O-hexoside (III-2-A) |
| 11b | 26.46 | 433/431 | 271/269 | 268,338 | Apigenin 7-O-glucoside (I-2-A) |
| 12b | 32.61 | 437/435 | 275/273 | 226,286 | Phloridzin (III-1-A) |
| 13b | 33.80 | 287/285 | — | 284,338 | Scutellarein (I-3) |
| 14b | 41.88 | 289/287 | — | 288,336sh | Eriodictyol (II-4) |
| 15b | 43.51 | 287/285 | — | 256,266sh,348 | Luteolin (I-6) |
| 16b | 44.08 | 303/301 | — | 256,266sh,370 | Quercetin (I-7) |
| 17b | 50.63 | 273/271 | — | 292,332sh | Naringenin (II-2) |
| 18c | 50.98 | 301/299 | — | 276,336 | 6-Methylscutellarein (I-4) |
| 19 | 57.00 | 315/313 | — | 278,334 | 6,7-Dimethylscutellarein (I-5) |
| 20b | 61.23 | 287/285 | — | 290,336sh | Sakuranetin (II-3) |
| 21b | 61.83 | 257/255 | — | 290,334sh | Pinocembrin (II-1) |
| 22b | 62.12 | 271/269 | — | 266,314sh,360 | Galangin (I-1) |
| 23 | 63.63 | 285/283 | — | 266,340 | Methylgalangin (I-9) |
Peak numbers in Fig. 2.
The identification was confirmed by direct comparison with standard compound, respectively.
Determined from their peak in the LC chromatogram of TLC band-6 or other TLC band.
3.2. Identification of the remaining flavonoids
Peak 2 had UV λmax at 282 and 344 nm and PI70/NI70 and PI250/NI250 pseudo-molecular and aglycone ions at m/z 465/463 and 303/301 suggesting a pentahydroxyflavone hexoside (Table 1). Peak 8 showed a similar UV spectrum and the same aglycone ion mass as peak 2, but its PI70/NI70 pseudo-molecular ions at m/z 449/447 were 16 amu less suggesting that this flavone was a pentahydroxyflavone deoxyhexoside. The UV spectrum (λmax at 282 and 346 nm) of the aglycone produced by hydrolysis of the glycosides was close to that of 5,6,7, 3′,4′-pentahydroxyflavone, or 6-hydroxyluteolin (nepetin) (I-8) (Greenham et al., 2003; Mitchell et al., 2001), suggesting the same aglycone. This identification was also supported by the existence of this flavone and its glycosides in several other plants of Lippia genus (Pascual et al., 2001; Abe et al., 2002). The similarity of the UV spectra between the glycosides and their aglycones indicated that the sugars of these glycosylated flavones were located at the 7-position (Mabry et al., 1970). Thus, peak 2 was identified as 6-hydroxyluteolin 7-hexoside. Peak 8 can be identified even more specifically as 6-hydroxyluteolin 7-O-rhamnoside since rhamnose is the only deoxyhexose known to form a natural flavonoid conjugate (Davis and Brodgelt, 2005).
Peaks 1 and 7 are both pentahydroxyflavanones. Peak 1 had PI70/NI70 and PI250/NI250 ions at m/z 467/465 and 305/303, respectively (Table 1), while peak 7 showed only an aglycone at m/z 305/303 (Fig. 3). Thus, 1 is a pentahydroxyflavanone hexoside and peak 7 is the aglycone, or an isomer. Fig. 4 shows the two possible fragmentation patterns for a pentahydroxyflavanone determined by the location of the hydroxy functions (Justesen, 2000). The mass spectra of peak 7 (Fig. 3C) showed an ion signal at m/z 151 and no signal at m/z 135 or 167. This suggested that it was Isomer-2, a 3,5,7,3′,4′-pentahydroxyflavanone, with only 2 hydroxy groups on the A ring (II-5). This arrangement corresponds to taxifolin. A comparison of the mass spectral data for a taxifolin standard with the spectrum for peak 7 confirmed this identification.
Fig. 3.

Mass spectra for: (A) NI 250 V of peak 1 in Fig. 2, (B), the aglycone (pentahydroxyflavanone-A, II-6, A-1 in Fig. 5) of peak 1, and (C) peak 7 (taxifolin, II-5) (C) of Fig. 2.
Fig. 4.
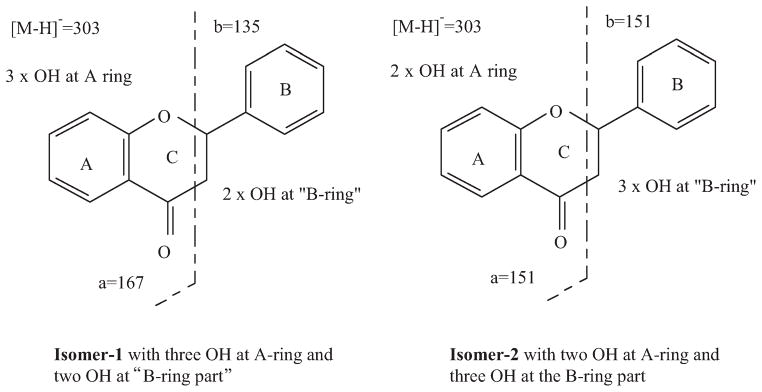
The main NI fragments of pentahydroxyflavanone isomer-1 and -2.
The mass spectrum of the aglycone of peak 1 (Fig. 3B) showed masses at m/z 135 and 167, and not at m/z 151. This suggested that peak 1 was Isomer-1, either a 3,5,6,7,4′-or a 5,6,7,3′,4,-pentahydroxyflavanone (II-7 or II-6). Based solely on MS data, there was no means of further identifying the compound. Based on biogenetic considerations, the fact that 5,6,7,3′,4′-pentahydroxyflavone glycoside is the major flavonoid of this plant, makes it likely that its dihydro-derivative, 5,6,7,3′,4′-pentahydroxyflavanone glycoside (II-6-A) would also be present. A final structural identification, however must be based on analysis by nuclear magnetic resonance (NMR) spectrometry.
Peaks 3 and 4 had UV and mass spectra similar to those of peak 1 and they are also pentahydroxyflavanone-hexosides. Each of the aglycones (following hydrolysis) has three OH groups on the A ring side and two OH functions at the B ring side of the molecule. Thus, they might have the same aglycone as peak 1, with the sugar at different positions, or their aglycones may be isomers of that of peak 1. Their identification can only be determined by NMR spectrometry.
Peaks 18 and 19 had UV and mass spectra similar to that of scutellarein (I-3). Their molecular ions were 14 and 28 amu higher than that for scutellarein, suggesting that they are methylscutellarein (I-4), and dimethylscutellarein (I-5), respectively. Their UV λmax were also close to that reported for 6-methylscutellarein (hispidulin, I-4, λmax at 275 and 334 nm), and 6,7-dimethylscutellarein (cirsimaritin, I-5, λmax at 276 and 333 nm) (Greenham et al., 2003; Mitchell et al., 2001; Abe et al., 2002; Williams et al., 2003). Hispidulin and cirsimaritin were isolated from other plants of Lippia genus, which further supports this identification (Pascual et al., 2001).
Similar logic led to the identification of peak 23 as methylgalangin (I-9) since this peak had a spectrum similar to that of galangin (I-1) and its molecular ion was 14 amu more than that of galangin (I-1).
Peak 10 had a UV spectra (λmax at 226 and 286 nm) similar to that of peak 12 (4, 2′,4′,6′-tetrahydroxy-dihydrochalcone-6′-glucoside or phloridzin, III-1-A), but its PI/NI pseudo-molecular and aglycone ions were 16 amu higher than those of phloridzin. This suggested that this compound had one more hydroxyl function than phloridzin. Because of the similarity of the UV data, the sugar of the chalcone must be located at 6′-position of the A-ring, like phloridzin, and the additional hydroxy group should be connected to the B-ring, mostly likely at 3-position. Thus, this compound was tentatively identified as 3-hydroxyphloretin 6′-O-hexoside (III-2-A).
Peak 5 had PI/NI pseudo-molecular and aglycone ions at m/z 449/447 and 287/285 and was identified as a tetrahydroxyflavone hexoside. The UV λmax (284 and 334 nm) were similar to those of scutellarein (I-3, peak 13, λmax at 284 and 338 nm), but different from those of peak 6, luteolin-7-O-glucoside (I-6-A) (λmax at 256, 266sh and 346 nm) and luteolin (I-6) (λmax at 256, 266sh, and 348 nm). Therefore, this compound was tentatively identified as scutellarein 7-O-hexoside (I-3-A) (Mabry et al., 1970).
3.3. Identification of the three pentahydroxyflavanone glycosides based on the aglycones produced from hydrolysis
The Mexican oregano extract was fractionated by TLC to separate glycosylated flavonoids from the co-existing aglycones. Each TLC band (data not shown) was examined by LC-MS. The results indicated that band 7 (Fig 5B) contained all of the major glycosylated flavonoids of the extract without any significant amount of free aglycones. The glycosides were then subjected to acid hydrolysis to produce their aglycones and re-analyzed (Fig. 5C). The major pentahydroxyflavanone (most likely 5,6,7,3′,4′-pentahydroxyflavanoe, II-6; labeled A-1 in Fig. 5; λmax at 288 and 360 nm; PI/NI pseudo-molecular ions at m/z 305/303; Rt = 20.23 min) was determined to be the aglycone (II-6) of the glycoside of peak 1. However, its retention time is very close to that (Rt = 20.34) of taxifolin (II-5), one of its isomers, which existed in the original extract and was also found in band 6 after the TLC separation (Fig. 5D). Hydrolysis of the original extract, without TLC fractionation, could lead to the mistaken identification of the aglycone (II-6) of peak 1 as taxifolin (II-5). Separation of these two isomers was achieved using a Waters SymetryShield C18 column (II-6: Rt = 32.87 min; II-5: Rt = 35.06 min) for conclusive identification.
Fig. 5.

The LC chromatograms of Mexican oregano extract with UV detection at 270 (A), TLC band 7 at 270 nm (B), the hydrolyzed TLC band 7 at 350 nm (C), TLC band 6 at 350 nm (D). In (C), peak A-1 = pentahydroxyflavanone-A (II-6), peak A-2 = pentahydroxyflavanone-B (II-7), peak A-3 = 3-hydroxyphloretin (III-2), peak A-4 = apigenin (I-2), and peak A-5 = phloretin (III-1).
The second pentahydroxyflavanone (most likely 3,5,6,7,4′-pentahydroxyflavanone, II-7; labeled as A-2 in Fig. 5C; λmax at 288, 360 nm; PI/NI pseudo-molecular ions at m/z 305/303; Rt = 26.13 min) was identified as the aglycone (II-7) of the two minor pentahydroxyflavanone-hexosides (II-7-A and II-7-B, peaks 3 and 4, respectively). Since neither the aglycones nor the glycosides showed signification differences in their UV and mass spectra, the assignment of these peaks was based on the fact that the ratio (1.9:1.0) of the major aglycone (II-6) to the minor aglycone (II-7) was consistent with the ratio (2.2:1.0) of the major glycoside (II-6-A) to the sum of the two minor glycosides (II-7-A and II-7-B). This suggests that there is no possibility of exchange among the glycosides and aglycones.
Finally, 6-hydroxyluteolin (I-8; Rt = 24.47 min; λmax at 282 and 346 nm; PI/NI pseudo-molecular ions at m/z 303/301) was the only detected pentahydroxyflavone in the hydrolyzed extract. This confirmed that the two glycosides (I-8-A and I-8-B) were formed from 6-hydroxyluteolin.
Using of selective ion monitoring (SIM) detection, the sole pentahydroxydihydrochalcone (3-hydroxyphloretin; III-2; Rt = 43.65 min; λmax at 288 nm; PI/NI molecular ions at m/z 291/289) was found to be peak A-3 in Fig. 5C, which overlapped with the peak for luteolin (I-6). Phloretin (III-1; peak A-5, Rt = 50.73 min; PI/NI molecular ions at 275/273 as its standard) and apigenin (I-2, peak A-4, in Fig. 5C), the aglycones of phloridzin (III-1-A) and apigenin 7-O-glucoside (I-2-A), respectively, were found to overlap.
It is worth mentioning that taxifolin (II-5), scutellarein (I-3), luteolin (I-6), quercetin (I-7), and 6-hydroxyluteolin (I-8) (peak 9) were found in TLC band 6 (Rt = 0.30 to 0.35, Fig. 5D) and were significantly enriched by TLC separation.
3.4. Quantification of flavonoids in three samples
Each of the three samples was prepared in triplicate (triplicate extractions) and each preparation was analyzed in triplicate. Where possible, matching standards were used for the calibration. Exceptions were: eriodictyol 7-O-glucoside (II-4-A), which was used to determine the concentration of three pentahydroxyflavanone monoglycosides, luteolin (I-6), which was used to determine the concentration of 6-hydroxyluteolin, and luteolin 7-O-glucoside (I-6-A), which was used to determine the concentration of two 6-hydroxyluteolin glycosides and scutallarein 7-O-hexoside.
The levels of flavonoids in the whole oregano were consistent with the exception of two flavonoid aglycones, galangin and pinacembrin (II-1). Sample 1 had the highest concentration of pinacembrin (9.16 mg/g) and galangin (3.47 mg/g) and sample 2 had approximately half of that amount (5.29 and 1.97mg/g, respectively), while sample 3 had only relatively trace amounts (0.53 and 0.20 mg/g, respectively) (Table 2). The data suggest that most flavonoids, when stored at room temperature in a coarsely ground form, were stable for over a year. Thus, the differences in the concentrations would appear to be due to the cultivar or growing place, harvesting season and processing conditions, which always make the flavonoid content different.
Table 2.
Estimation of the flavonoid content in dried Mexican oreganoa
| Compound | Sample-1 (mg/g) | Sample-2 (mg/g) | Sample-3 (mg/g) |
|---|---|---|---|
| Pentahydroxyfavanone-A hexoside (II-6-A)b | 9.37±0.13 | 8.59±0.30 | 9.31±0.09 |
| Pentahydroxyfavanone-B hexoside-1 (II-7-A)b | 2.15±0.05 | 2.02±0.03 | 2.10±0.05 |
| Pentahydroxyfavanone-B hexoside-2 (II-7-B)b | 2.28±0.06 | 2.19±0.02 | 2.33±0.04 |
| Taxifolin (II-5) | 0.98±0.01 | 1.49±0.02 | 1.38±0.04 |
| Eriodictyol (II-4) | 0.72±0.02 | 0.91±0.02 | 0.93±0.02 |
| Naringenin (II-2) | 3.35±0.03 | 4.18±0.01 | 3.63±0.03 |
| Sakuranetin (II-3) | 0.90±0.02 | 0.98±0.01 | 0.91±0.02 |
| Pinocembrin (II-1) | 9.16±0.05 | 5.29±0.03 | 0.53±0.01 |
| Total flavanones | 31.05±0.17 | 25.67±0.43 | 21.12±0.13 |
| 6-Hydroxyluteolin 7-O-hexoside (I-8-A)c | 9.37±0.13 | 10.04±0.08 | 11.65±0.12 |
| 6-Hydroxyluteolin 7-O-rhamnoside (I-8-B)c | 0.23±0.01 | 0.76±0.02 | 0.44±0.02 |
| Scutallarein 7-O-hexoside (I-3-A)c | 2.69±0.02 | 3.10±0.02 | 3.58±0.03 |
| Luteolin 7-O-glucoside (I-6-A) | 2.56±0.08 | 3.09±0.02 | 3.28±0.04 |
| Apigenin 7-O-glucoside (I-2-A) | 0.25±0.01 | 0.29±0.01 | 0.31±0.01 |
| 6-Hydroxyluteolind | 0.74±0.01 | 0.99±0.02 | 1.00±0.02 |
| Scutallarein (I-3) | 0.29±0.01 | 0.24±0.01 | 0.48±0.01 |
| 6-Methoylscutallarein (I-4)e | 0.81±0.01 | 1.09±0.01 | 1.12±0.01 |
| 6,7-Dimethoylscutallarein (I-5)e | 0.45±0.01 | 0.66±0.01 | 0.76±0.02 |
| Luteolin (I-6) | 0.51±0.01 | 0.62±0.01 | 0.56±0.01 |
| Total flavones | 17.89±0.15 | 19.93±0.09 | 23.19±0.14 |
| Galangin (I-1) | 3.47±0.02 | 1.97±0.01 | 0.20±0.01 |
| Methylgalangin (I-1)f | 0.69±0.01 | 0.51±0.01 | ndg |
| Quercetin (I-7) | 0.34±0.01 | 0.47±0.01 | 0.45±0.01 |
| Total flavonols | 4.50±0.03 | 2.95±0.02 | 0.65±0.01 |
| 6-Hydroxyphloretin 6″-O-hexoside (III-2-A)h | 4.84±0.04 | 3.95±0.03 | 4.48±0.05 |
| Phloridzin (III-1-A) | 1.43±0.02 | 1.48±0.01 | 1.17±0.02 |
| Total dihydrochalcones | 6.27±0.05 | 5.43±0.03 | 5.63±0.06 |
| Total flavonoids | 59.83±0.24 | 53.98±0.44 | 50.60±0.20 |
Average (mean) content±SD of triplicate.
Calculated as molar equivalent of eriodictyol-7-O-glucoside.
Calculated as molar equivalent of luteolin-7-O-glucoside.
Calculated as molar equivalent of luteolin.
Calculated as molar equivalent of scutellarein.
Calculated as molar equivalent of galangin.
nd: below the detection limitation of 0.01 mg/g.
Calculated as molar equivalent of phloridzin.
4. Conclusions
The presence of more than 20 individual flavonoids, as well as a high total flavonoid content within four flavonoid subgroups, makes whole oregano a potentially healthful herb in the US diet. Eleven additional flavonoids were identified using hydrolysis, TLC fractionation, and different columns. For flavones and flavonols, especially in the glycosylated form, higher fragmentation voltages (between 300 and 400 V) are needed to cleave their more stable aglycone skeletons for further identification. The exact position of the sugar and methoxy goups cannot be detected without comparison to standards or NMR analysis (Cuyckens and Cleays, 2004).
Acknowledgments
This research is supported, by an Interagency Agreement with the Office of Dietary Supplements of the National Institutes of Health, Health and Human Services Department.
References
- Abe F, Nagao T, Okabe H. Antiproliferative constituents in plants 9. Aerial parts of Lippia dulcis and Lippia canecens. Biological Pharmaceutical Bulletin. 2002;25:920–922. doi: 10.1248/bpb.25.920. [DOI] [PubMed] [Google Scholar]
- Cuyckens F, Cleays M. Mass spectrometry in the structural analysis of flavonoids. Journal of Mass Spectrometry. 2004;39:1–15. doi: 10.1002/jms.585. [DOI] [PubMed] [Google Scholar]
- Davis BD, Brodgelt JS. LC-MSn methods for saccharide characterization of monoglycosyl flavonoids using postocolumn manganese complexation. Analytical Chemistry. 2005;77:1883–1890. doi: 10.1021/ac048374o. [DOI] [PubMed] [Google Scholar]
- Dominguez XA, Sánchez H, Suarez M, Baldas JH, Gonzalez MR. Chemical constituents of Lippia graveolens. Planta Medica. 1989;55:208–209. [Google Scholar]
- Greenham J, Harborne JB, Williams CA. Identification of lipophilic flavones and flavonols by comparative HPLC, TLC and UV spectral analysis. Phytochemical Analysis. 2003;14:100–118. doi: 10.1002/pca.693. [DOI] [PubMed] [Google Scholar]
- Heim KE, Tagliaferro AR, Bobilya DJ. Flavonoid antioxidants: chemistry, metabolism and structure–activity relationships. Journal of Nutritional Biochemistry. 2002;13:572–584. doi: 10.1016/s0955-2863(02)00208-5. [DOI] [PubMed] [Google Scholar]
- Justesen U. Negative atmospheric pressure chemical ionization low-energy collision activation mass spectrometry for the characterization of flavonoids in extracts of fresh herbs. Journal of Chromatography A. 2000;902:369–379. doi: 10.1016/s0021-9673(00)00861-x. [DOI] [PubMed] [Google Scholar]
- Leung AY, Foster S. Oregano. In: Leung AY, Foster S, editors. Encyclopedia of Common Natural Ingredients Used in Food, Drugs and Cosmetics. 2. Wiley; New York: 1996. pp. 398–400. [Google Scholar]
- Lin L-Z, Harnly JM. A screening method for the systematic identification of glycosylated flavonoids and other phenolic compounds using a standard analytical approach for all plant materials. Journal of Agricultural and Food Chemistry. 2007 doi: 10.1021/jf062431s. submitted for publication. [DOI] [PMC free article] [PubMed] [Google Scholar]
- Mabry TJ, Markham KR, Thomas MB. The ultraviolet spectra of flavones and flavonols. In: Mabry TJ, Markham KR, Thomas MB, editors. The Systematic Identification of Flavonoids. V Springer; New York: 1970. [Google Scholar]
- Mitchell KA, Markham KR, Bayly MJ. Flavonoid characters contributing to the taxonomic revision of the Hebe parviflora complex. Phytochemistry. 2001;56:453–461. doi: 10.1016/s0031-9422(00)00397-6. [DOI] [PubMed] [Google Scholar]
- Pascual ME, Slowing K, Carretero E, Sánches Mata D, Villar A. Lippia: traditional uses, chemistry and pharmacology, 1 review. Journal of Ethnopharmacology. 2001;76:201–214. doi: 10.1016/s0378-8741(01)00234-3. [DOI] [PubMed] [Google Scholar]
- Rastrelli L, Caceres A, Morales C, De Simone F, Aquino R. Iridoids from Lippia graveolens. Phytochemistry. 1998;49:1829–1832. doi: 10.1016/s0031-9422(98)00196-4. [DOI] [PubMed] [Google Scholar]
- Robards K. Strategies for the determination of bioactive phenols in plants, fruits and vegetables. Journal of Chromatography A. 2003;1000:657–691. doi: 10.1016/s0021-9673(03)00058-x. [DOI] [PubMed] [Google Scholar]
- Robards K, Prenzler PD, Tucker G, Swatsitang P, Glover W. Phenolic compounds and their role in oxidative processes in fruits. Food Chemistry. 1999;66:401–436. [Google Scholar]
- Shan B, Cai YZ, Sun M, Corke H. Antioxidant capacity of 26 spice extracts and characterization of their phenolic constituents. Journal of Agricultural and Food Chemistry. 2005;53:7749–7759. doi: 10.1021/jf051513y. [DOI] [PubMed] [Google Scholar]
- Williams CA, Harborne JB, Greenham JR, Grayer RJ, Kite GC, Eagles J. Variations in lipophilic and vacuolar flavonoids among European Pulicaria species. Phytochemistry. 2003;64:275–283. doi: 10.1016/s0031-9422(03)00207-3. [DOI] [PubMed] [Google Scholar]