Abstract
We present a new method for sensitive ultrasound detection using an open-cavity optoacoustic sensor. Our results have demonstrated significant enhancement of detection sensitivity when the open-cavity sensor is used in media with large isothermal compressibility. A near-linear relationship between detected optoacoustic signal strength and isothermal compressibility has been found.
Photoacoustic tomography (PAT) has shown great promise for three-dimensional in vivo imaging based on a hybrid technology that combines rich optical contrast mechanisms and superior ultrasonic penetration depth and resolution [1,2]. In conventional optical imaging, recovery of scattered photons is difficult in turbid media and much work has been done to address this limitation. When utilizing PAT, photons from a short laser pulse are absorbed by tissue which then undergoes impulsive heating accompanied by rapid thermoelastic expansion. The tissue then re-emits the absorbed energy as broadband ultrasonic pressure waves. The detection of these broadband ultrasonic signals is challenging, as their frequencies may be up to 130 MHz [3–5]. Since the bandwidth of the ultrasound detection system determines which waves are used to construct a PAT image, wideband optoacoustic detection over conventional piezoelectric detection of ultrasound pressure waves generated from tissues is important for acquiring high quality photoacoustic images.
Optoacoustic sensors utilized for high frequency ultrasound detection have been investigated in recent years to address the frequency and sensitivity limitations of conventional piezoelectric ultrasound sensors [6–9]. Several design configurations utilizing photonic crystal (PC) structures for ultrasound detection have been explored which use two surfaces acting as high quality mirrors sandwiching a cavity layer. In contrast to the closed cavity optical resonators, we recently demonstrated a novel open-cavity optoacoustic sensor using a PC structure in a total-internal-reflection (TIR) configuration [10,11]. The PC-TIR sensor has an open cavity layer that is directly exposed to outside media, and as such, requires no coating on top of the cavity layer. This is significantly different from the situation of a closed cavity where cavity layer material selection is limited to those which can withstand the high temperature conditions necessary for fabricating the enclosing mirrors. In contrast, we fabricated a PC-TIR sensor with polymethyl-methacrylate (PMMA) as the cavity layer in our recent study and demonstrated its sensitive response to ultrasound signals due to the relatively low Young's modulus of PMMA [10].
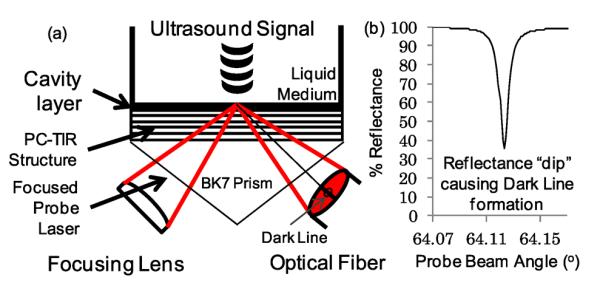
In the current study, we take further advantage of our open cavity configuration to investigate the enhancement of the sensor's sensitivity by using an ultrasound coupling medium (which would be directly coupled to the exposed cavity layer) with large isothermal compressibility (β). The experimental setup is shown in Fig. 1. The PC-TIR sensor consists of five alternating 89 nm TiO2 and 305 nm SiO2 layers coated on a BK-7 glass substrate by electron beam deposition. Above this periodic structure a cavity layer was formed with 382 nm of SiO2 and 10 nm of Si. A probe laser beam is focused onto the cavity layer of the sensor, creating a range of incident angles in the layer. When a resonant mode of the PC-TIR sensor is achieved at a resonant angle, an ultrasound pressure wave impacted on the sensor modulates the reflected probe laser beam by changing the sensor cavity layer thickness and the RI of the medium above the cavity. Achieving a resonant mode in the PC-TIR sensor depends on two factors. The first factor is the phase delay for the probe light traveling in the cavity layer. The second factor is the Goos–Hänchen phase shift that occurs when the probe beam undergoes TIR at the interface between the ultrasound coupling medium and the cavity layer. Combining the two effects, we obtain the condition for achieving a resonant mode in a PC-TIR sensor
| (1) |
where λd is the resonant wavelength. nx and dx are the refractive index (RI) and thickness of the cavity layer, respectively. θx and θs are the refraction angle in the cavity layer and in the sensor substrate, respectively. ns is the RI of the sensor substrate, nH is the RI of the liquid media above the cavity layer, and m is the mode number.
Fig. 1.

(a) Experimental PC-TIR setup. (b) Simulated reflection intensity of a probe laser.
A resonant mode can only be satisfied at a particular laser incident angle with a narrow bandwidth. Once achieved, the resonant condition causes the laser light to oscillate in the cavity layer. The absorption of the oscillating light by the Si layer causes a dip in intensity of the reflected laser beam at the resonant angle of the PC-TIR sensor. A transfer matrix simulation of this effect is shown in Fig. 1(b). The laser light at all other angles is not in resonance and experiences high reflection from the PC structure. The result is the formation of a horizontal dark line in the reflected probe laser beam from the sensor. The lateral intensity profile across the reflected laser pattern shows a sharp dip at the location of the dark line. When an ultrasound pressure wave is incident upon the surface of the cavity layer, the position of this dark line oscillates at a frequency following the applied ultrasound. By placing an optical fiber with a small diameter core at a position near the dark line's edge where the slope of the intensity change is greatest, we can achieve maximum sensitivity for sensor interrogation.
The fiber input end was set at a distance of 22 cm away from the PC-TIR sensor. For optimal sensitivity, a 105 μm fiber core was found to be the optimum size based on the amplitude of the optical response to an ultrasound signal. The fiber output end was coupled via FC connector to a Hamamatsu Avalanche Photodiode Detector (APD, C5331-30) to detect the intensity of the light modulated by the ultrasound. The waveform of the optoacoustic signal was then captured by an oscilloscope.
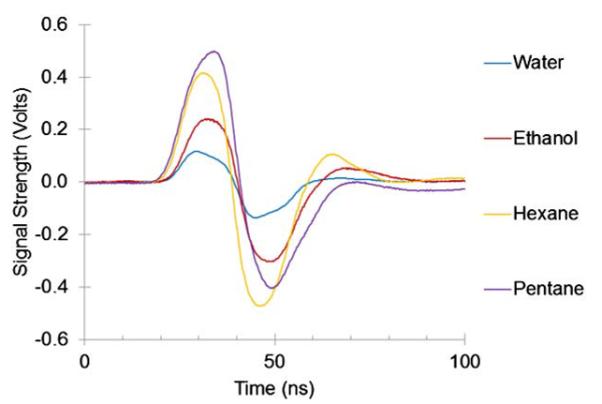
An ultrasound transducer was placed above the PC-TIR sensor and immersed in liquids with ascending values of β, including water, ethanol, n-hexane, and n-pentane. The optical response due to the ultrasound interaction with the PC-TIR sensor was measured for each liquid medium. The ultrasound signal was provided by an Olympus V322 30 MHz flat transducer. An increase in the optical signal amplitude was observed for each liquid when compared to water in order of each liquid's increasing value of β as shown in Fig. 2. In our analysis we used β=0.458 GPa−1 for water, 1.153 GPa−1 for ethanol, 1.674 GPa−1 for n-hexane, and 2.13 GPa−1 for n-pentane [12,13].
Fig. 2.

Measured optical responses to ultrasound signals when a PC-TIR sensor is used in different ultrasound media.
The amplitudes of the optical response are determined by the modulation depth of the resonant reflectance of the PC-TIR sensor under the ultrasound pressure waves. Two effects contribute to the modulation depth. The first effect is due to the phase delay of a Fabry–Pérot cavity resonance, and is expressed by the left most operand in Eq. (1). Since λd, nx, and θx are fixed, this operand models the effect of the change in cavity layer thickness, dx, on the resonant condition. The ultrasound pressure wave causes a Δdx as it hits the cavity layer surface. The second effect is the Goos–Hänchen phase shift and is described by the second operand in Eq. (1). When the probe laser at the resonant angle reaches the interface between the cavity layer and the ultrasound coupling medium, an evanescent field of the probe beam is formed. In sharp contrast to a conventional resonator with a closed cavity, the unique open-cavity configuration of the PC-TIR sensor allows the liquid medium to be directly coupled to the cavity layer. Thus, nH, the RI of the medium within the range of the exponential decay of the evanescent field, plays an important role in determining the resonant condition of the sensor. The value of nH is modulated by the change in pressure (Δp) associated with the ultrasound pressure wave within the evanescent field. The fractional change in RI with a change in pressure (Δn/Δp) and its relation with β are parameters utilized to optimize the sensor sensitivity discussed in this letter.
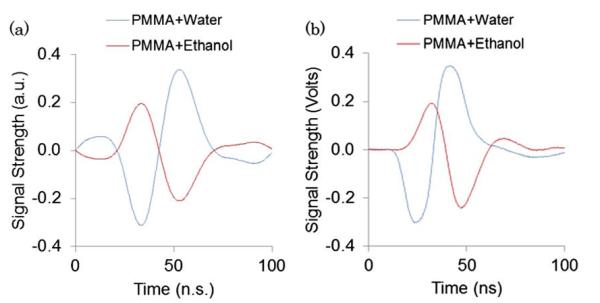
As shown in Eq. (1) a phase shift due to a change in the cavity layer thickness and the Goos–Hänchen effect are of opposite signs and their counteraction can be experimentally observed. For example, in our recent study [10], we fabricated a PC-TIR sensor with a cavity layer composed of PMMA and used the sensor in a water medium to enhance the sensitivity of ultrasound detection. The enhancement of sensitivity is due to PMMA's relatively small Young's modulus compared with rigid inorganic materials, such as SiO2, resulting in a larger Δdx from an incident pressure wave. If submerged in ethanol instead of water, ethanol's larger β will cause a larger Δn in the Goos–Hänchen portion of Eq. (1). Since both effects are of opposite sign, increasing both effects reduces the overall phase shift, thus lowering the optical response (Fig. 3). We have conducted a computer simulation based on a transfer matrix method to model the effects of an ultrasound pressure wave on dx and nH for the PC-TIR sensor with a PMMA cavity layer. The simulation results of the optical response of the sensor to an ultrasound signal with water or ethanol as the medium [Fig. 3(a)] are in good agreement with our experimental observations shown in Fig. 3(b).
Fig. 3.

Optical response of a PC-TIR sensor with a PMMA cavity layer to an ultrasound wave in water or ethanol. (a) Simulated and (b) experimental results.
We derived the relation between Δn/Δp and β of the ultrasound medium. From the definition of isothermal compressibility, one has
| (2) |
where V and ρ denote the volume and density of the liquid medium, respectively, and Δρ is the change in density from ρ to ρo under pressure. From the Gladstone–Dale model, one has
| (3) |
where n(ρ) is the RI corresponding to the density of ρ. By substituting Eq. (2) into Eq. (3) and assuming Δρ/ρo ≪ 1, we obtained
| (4) |
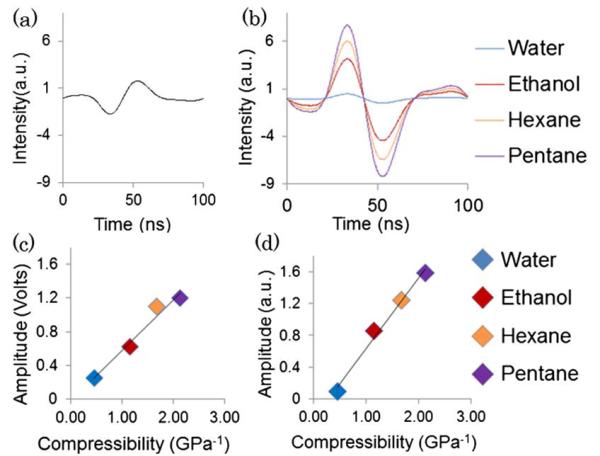
Thus, a liquid with a higher β results in a larger change in Δn for certain change of pressure Δp. Based on this equation we calculated the change in RI, ΔnH, of the four media (water, ethanol, hexane, and pentane) used in the experiment when an ultrasound pressure wave is applied. We also calculated the change in cavity layer thickness Δdx, when the ultrasound pressure wave interacts with the cavity layer with known Young's modulus. In this experiment, we designed and fabricated a PC-TIR sensor with an intentionally chosen rigid material, SiO2 with a Young's modulus as high as 78 GPa, to form the cavity layer. Thus, the optical response of the sensor to ultrasound due to the modulation of the cavity layer thickness is minimum and negligible, while the modulation of the RI of the liquid medium above the sensor becomes the dominate effect. Because the two effects have opposite signs, we obtained sensitive response of the sensor to ultrasound via the modulation of the RI of the medium when a SiO2 cavity layer is used. The advantage of this configuration has been confirmed with our transfer-matrix-based simulation. Taking into account the modulation of Δdx, and ΔnH, by an ultrasound, we simulated the optical response of the PC-TIR sensor. An ultrasound waveform [Fig. 4(a)] obtained experimentally from an ultrasound transducer was used as the input for the simulation. The simulation results in Fig. 4(b) indicate the optical response of the sensor with the four different media, which is in good agreement with our experimental results shown in Fig. 2. Figure 4(c) shows the peak-to-peak amplitude of the optical response of the sensor as a function of β of the liquids used. The near-linear relationship was confirmed with our simulation results shown in Fig. 4(d). The results demonstrate that using a rigid cavity layer and liquids with β higher than water as the ultrasound medium allow us to significantly enhance the detection sensitivity of a PC-TIR sensor.
Fig. 4.

(a) Input ultrasound signal. (b) Simulated optical response of a PC-TIR sensor. (c) Relationship between β and the amplitudes of the experimental optical response. (d) Simulated results confirming the near-linear relationship between β and the optical response.
In sharp contrast to a conventional optoacoustic sensor with a closed cavity, our PC-TIR sensor has a unique open cavity, which makes it possible to enhance the sensitivity to ultrasound detection through two different designs. One is to use a cavity layer with a low Young's modulus in combination with a liquid having a low β, as reported in our previous study [10]. The new approach reported here takes further advantage of the unique open cavity structure to enhance the optical response to ultrasound via a high-compressibility liquid medium in conjunction with a rigid cavity layer. Since only a thin layer of the medium within the evanescent field of the probe laser beam affects the sensor sensitivity, one may seal a thin layer of high-compressibility medium on the sensor surface, thus allowing the sensor to be used in any normal ultrasound coupling media including water or ultrasound gels.
Acknowledgments
We gratefully acknowledge grant support no RP120558 from the Cancer Prevention Research Institute of Texas.
References
- 1.Zhang H, Maslov K, Stoica G, Wang L. Nat. Biotechnol. 2006;24:848. doi: 10.1038/nbt1220. [DOI] [PubMed] [Google Scholar]
- 2.Yakovlev V, Zhang H, Noojin G, Denton M, Thomas R, Scully M. Proc. Natl. Acad. Sci. USA. 2010;107:20335. doi: 10.1073/pnas.1012432107. [DOI] [PMC free article] [PubMed] [Google Scholar]
- 3.Zhang E, Laufer J, Beard P. Appl. Opt. 2008;47:561. doi: 10.1364/ao.47.000561. [DOI] [PubMed] [Google Scholar]
- 4.Yakovlev V, Dickson W, Murphy A, McPhillips J, Pollard R, Podolskiy V, Zayats A. Adv. Mater. 2013;25:2351. doi: 10.1002/adma.201300314. [DOI] [PubMed] [Google Scholar]
- 5.Ling T, Chen S, Guo L. Opt. Express. 2011;19:861. doi: 10.1364/OE.19.000861. [DOI] [PMC free article] [PubMed] [Google Scholar]
- 6.Zhang E, Beard P. Proc. SPIE. 2004;5320:222. [Google Scholar]
- 7.Zhang E, Beard P. IEEE Trans. Ultrason. Ferroelectr. Freq. Control. 2006;53:1330. doi: 10.1109/tuffc.2006.1665081. [DOI] [PubMed] [Google Scholar]
- 8.Hamilton J, Buma T, Spisar M, O'Donnell M. Ultrason. Ferroelectr. Freq. Control. 2000;47:160. doi: 10.1109/58.818758. [DOI] [PubMed] [Google Scholar]
- 9.Kilic O, Diginnet M, Kino G, Solgaard O. Meas. Sci. Technol. 2007;18:3049. [Google Scholar]
- 10.Chow C, Zhou Y, Guo Y, Norris T, Wang X, Deng X, Ye J. J. Biomed. Opt. 2011;16:017001. doi: 10.1117/1.3528014. [DOI] [PMC free article] [PubMed] [Google Scholar]
- 11.Zhang B, Dallo S, Peterson R, Hussain S, Weitao T, Ye JY. J. Biomed. Opt. 2011;16:127006. doi: 10.1117/1.3662460. [DOI] [PubMed] [Google Scholar]
- 12.Marcus Y, Hefter G. J. Mol. Liq. 1997;73–74:61. [Google Scholar]
- 13.Bialkowsky E. Photothermal Spectroscopy Methods for Chemical Analysis. 1st ed Wiley-Interscience; 1995. [Google Scholar]


