

Abstract
Tacrolimus, an immunosuppressant drug, presents a narrow therapeutic window and a large pharmacokinetic variability with poor correlation between drug dosing regimen and blood concentration. The objective was to identify predictive factors influencing tacrolimus trough concentrations (C0) using a bottom-up approach. A physiologically based pharmacokinetic (PBPK) model of tacrolimus was proposed, taking into account the body weight, the proportion of fat (Pfat), hematocrit, lipid fraction of organs, typical intrinsic clearance (CLityp), CYP3A5 genotype of liver donor, plasma unbound fraction of tacrolimus (fup), and concomitant drugs (CYP3A4 inhibitors). For the evaluation of the PBPK model, mean C0 and concentrations 2 h after oral dose of tacrolimus were compared with those from 66 liver transplant recipients included in a multicentric pharmacokinetic study and were found very close. Tacrolimus concentration profiles were simulated in a virtual population defined by a set of covariate values similar to those from the real population. The sensitivity of tacrolimus C0 with respect to each covariate has been tested to identify the most influential ones. With the range of covariate values tested, the impact of each covariate on tacrolimus C0 may be ranked as follows: fup, CLityp, bioavailability, body weight, hematocrit, CYP3A5 polymorphism, Pfat, and CYP3A4 inhibitory drug–drug interactions. Values for initial dosing regimen of tacrolimus in order to reach a C0 of 10 ng/ml at day 5 (assuming a constant dosing schedule) as a function of CYP3A5 donor genotype and patient’s hematocrit and body weight are proposed.
Electronic supplementary material
The online version of this article (doi:10.1208/s12248-014-9577-8) contains supplementary material, which is available to authorized users.
KEY WORDS: bottom-up approach, liver transplantation, tacrolimus, therapeutic drug monitoring
INTRODUCTION
Tacrolimus, a calcineurin inhibitor, is an immunosuppressant agent (1,2) used for prevention of graft rejection after solid-organ transplantation. Tacrolimus presents a narrow therapeutic window and a large pharmacokinetic variability with poor correlation between drug dosing regimen and blood concentrations (3). Whole-blood concentration of tacrolimus must be monitored. In practice, blood tacrolimus trough concentrations (C0) measured 12 h after the dose (just before the next dose) is used to adjust daily oral doses. After liver transplantation, target concentration range is 5 to 20 ng/ml (4,5). A progressive decrease in target concentration after liver transplantation is commonly used. In 2009, a European consensus conference proposed ranges of 10 to 20 ng/ml during the first month, 5 to 15 ng/ml between 1 and 3 months, and 5 to 10 ng/ml thereafter (6). Currently, a trend toward diminution of C0 target in the early post-transplantation period is observed, with a maximum of 10 ng/ml (7,8). Achieving and maintaining therapeutic C0 is essential during the early post-transplantation period, when the risk of acute rejection is the most important. Moreover, maintaining the C0 below 15 ng/ml decreases the occurrence of nephrotoxicity (9,10).
Tacrolimus is a substrate for the drug transporter P-glycoprotein (PgP) and cytochrome (CYP) 3A4 and 3A5 (11). Polymorphisms in genes coding for CYP3A5 and PgP explain a part of the interindividual variability in tacrolimus pharmacokinetics (12). Because the genotype of CYP3A5 and PgP of the donor and the recipient may differ in liver transplantation, both genotypes of donor and recipient may have an impact.
Regarding CYP3A5, a very frequent single-nucleotide polymorphism (SNP) within intron 3 of CYP3A5 (6986G > A) is the primary cause of CYP3A5 protein polymorphism (13,14). The presence of CYP3A5*3 allele results in the absence of the functional CYP3A5 protein in homozygous carriers (CYP3A5*3/*3). Patients with at least one CYP3A5*1 allele (defined as the “wild-type” allele) are classified as CYP3A5 expressors (15). The proportion of patients with CYP3A5*1/*1 and CYP3A5*1/*3 genotype in Caucasian population is 1.2% and 16.8%, respectively (16).
PgP acts as a transmembrane efflux pump (17). PgP affects the absorption of drugs from the gut, their distribution, and their metabolism and excretion (18). PgP is produced by the multidrug resistance (MDR1) or ABCB1 gene (19). The SNP the most studied is located in exon 26 (3435C > T). In the gut, strong expression of PgP corresponding to patients’ homozygous carriers of C allele (CC genotype) may reduce drug absorption (17).
In the early post-transplantation period, tacrolimus pharmacokinetics varies due to, e.g., variable activity of intestinal CYP3A4 and PgP, resuscitation, concomitant drugs, and gradual recovery of liver function, mainly in the first two weeks, requiring a frequent adjustment of the dosing regimen. Many population pharmacokinetic (PK) studies have been conducted, resulting in a partial characterization of factors of variability in the pharmacokinetics of tacrolimus in liver transplant recipients, adult or child (20–25). Factors of variability in clearance most commonly found were type of graft (20,24), activity of aspartate aminotransferase (20,22), and the time elapsed since transplantation (23,25). In renal transplant recipients, in vivo CYP3A4 activity, CYP3A5 genotype, and hematocrit explain 60–72% of variability in tacrolimus pharmacokinetics (26). However, the corresponding figure is unknown in liver transplant patients, and the unexplained variability remains high.
Identification of the most significant covariates influencing the dosing regimen might be clinically important for rapid achievement of the optimal therapeutic C0 of tacrolimus. The current top-down approach, based on statistical approaches to determine significant covariates among a large set of demographic or biologic indices in a clinical PK study, has reached its limits because the unexplained variability remains large. The bottom-up approach for identifying relevant covariates has recently been advocated (27,28). In the latter approach, the factors influencing the PK of a drug are determined by simulations based on a physiologically based pharmacokinetic (PBPK) model.
The objective of the study was to identify and to rank predictive factors (physiological and pharmacogenomic factors) influencing tacrolimus trough blood concentrations using a PBPK model and a bottom-up approach. The model was built and evaluated using data from a population PK study of tacrolimus during the first 25 days after liver transplantation. The determination of these relevant covariates may help clinicians to select the initial dosing regimen of tacrolimus as a function of the characteristics of the liver transplant recipient.
PATIENTS AND METHODS
Preliminary Population Pharmacokinetic Study
An open-label, non-comparative, prospective, observational study was conducted in adult patients in three university hospitals of Paris, France (Beaujon, Cochin, and Henri Mondor). The protocol was approved by the local ethics committee of Henri Mondor hospital, and written informed consent was obtained from each patient.
Inclusion criteria were adult patients receiving a whole or split graft from dead donor and an immunosuppressive regimen based on tacrolimus (Prograf®) possibly combined with glucocorticoids (methylprednisolone, prednisolone, prednisone) and mycophenolate.
Non-inclusion criteria were as follows: delayed introduction of tacrolimus beyond the third post-transplantation day using anti-IL2 agents; multi-organ transplantation; known risk of non-adherence (mainly history of substance abuse, psychiatric disorders); additional immunosuppressive therapy by sirolimus or everolimus, cyclosporine, or azathioprine; and infection with HIV.
From September 2006 to July 2010, 66 adult liver recipients receiving oral tacrolimus were included in this study. Data were collected from day 1 to day 25 post-transplantation. For each patient, at least three blood samples (at time 0, 2 h, and 6 h after the dose) were collected at D2, D7, D14, and D25 with the following data:
patient characteristics: body weight, age, and gender
biological data: proteinemia, albuminemia, coagulation factor V, prothrombin time, total and conjugate bilirubin, alkaline phosphatase (AP), gamma glutamyl transferase (GGT), alanine aminotransferase (ALT), aspartate aminotransferase (AST), serum creatinine concentration (SCR), red blood cell count, and hematocrit
genotypic data for each donor and transplant recipient: CYP3A5 (6986G > A) and PgP (3435C > T) genotypes
concomitant CYP3A4 inhibitor drugs for which the level of inhibition (no inhibition, low inhibition, and high inhibition) was estimated in function of the drug and its dosing regimen. Inhibitors were voriconazole, fluconazole, midazolam, nicardipine, and amiodarone. For example, the level of inhibition for fluconazole was considered to be low or high when the dosing regimen was from 50 to 150 mg/day or from 200 to 400 mg/day, respectively.
Concentrations of tacrolimus in blood were measured by ACMIA. The lower limit of quantification of the assay was 3 ng/ml, and the range of quantification was 3 to 30 ng/ml.
Population PK analysis was carried out by using Monolix V3.1 software (29). One- and two-compartment models were evaluated. The PK parameters were assumed to follow a lognormal distribution, and for intra-individual variability, an exponential error model was used.
The covariate model was established using the forward inclusion–backward elimination method (30), using the likelihood ratio test, with alpha values of 0.05 for inclusion and 0.01 for elimination. The predictive performance of the final model was evaluated by a visual predictive check based on 1,000 simulations.
PBPK Model
A PBPK model of tacrolimus was built from the generic model for lipophilic drugs proposed by Levitt (31,32). As tacrolimus is more lipophilic than cyclosporin, the influence of the intracellular binding to FK binding protein (FKBP) was assumed to be negligible in comparison to the binding to lipids (FKBP has a high affinity but a low capacity compared to lipids).
Our PBPK model comprised 13 compartments representing important tissues, organs, or other spaces within the human body. These anatomical compartments were arterial and venous blood, “portal vein” (gut + intestine + pancreas + spleen), lung, liver, adipose tissue, kidney, brain, heart, skin, muscles, tendon, and others. “Tendon” refers to connective tissue. It was assumed that the drug distributes within the body via transport by blood flow and passive diffusion. The flow diagram of the PBPK model is presented in Fig. 1.
Fig. 1.
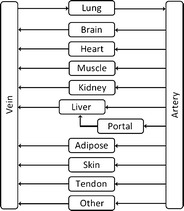
Flow diagram used for initial detailed PBPK model of tacrolimus. Portal refers to gut, intestine, spleen, and pancreas
The PBPK model was written as a set of differential equations that describes the variation of the unbound concentration in the water of the tissues and blood. The parameters involved in the model were as follows. Each organ i was characterized by its mass, Vi (kg), its fraction of water, wfraci (l/kg), its fraction of lipid lfraci (kg/kg), and its blood flow Qi (l/h/kg of organ). Unless otherwise stated, all values of the physiological parameters were taken from Levitt (31,32).
Distribution
All organs were assumed well stirred and the uptake rate of the drug into tissues is limited by blood flow (33). The generic equation describing the variation of the free drug concentration in the water of a non-eliminating organ i, CuTi is:
 |
1 |
where Cub is the unbound drug concentration in blood water. The rate constant for free drug diffusion from blood water to organ water, kTi, is calculated by the following equation:
 |
2 |
where 1.06 is blood density, wfracb is the fraction of water in blood, fuTi is the unbound fraction of drug in the water of tissue i, and fub is the unbound fraction of drug in blood water.
This equation may be regarded as the ratio of an unbound drug distribution clearance (1.06wfracb.Qi.Vi/fub) to an unbound drug volume of distribution (Vi.wfraci/fuTi).
The unbound fraction of drug in tissue, fuTi, depends on the lipid fraction of the tissue and the oil/water partition coefficient of the drug, Poil:
 |
3 |
For tacrolimus, experimental Poil = 103.3 (34).
Regarding tacrolimus unbound fraction in blood (fub), it depends on drug concentration and hematocrit because of saturable binding to red blood cells (35). Hence, blood-to-plasma ratio (BPR) was related to hematocrit (hct) and plasma total concentration (Cp) of tacrolimus according to (35):
 |
4 |
where Bmax is the binding capacity and KD the affinity constant. This saturation was included in the model according to Levitt (31) as follows. The unbound fraction fub was related to Cub, by the following equation:
 |
5 |
where
 |
6 |
The unbound fraction of tacrolimus in plasma (fup) was set to 0.012 (36). Finally, the binding capacity was linearly related to the hematocrit:
 |
7 |
where median (Bmax) was estimated from the data of six patients randomly selected from the clinical study (see below) and 0.29 is the median hematocrit in the population of liver recipients.
Elimination
The liver was assumed to be the only eliminating organ. The equation describing the variation of the free drug concentration in the water of the parenchyma liver is:
 |
8 |
where ke is an elimination rate constant. This rate constant is calculated as the ratio of an unbound drug clearance to an unbound drug volume of distribution:
 |
9 |
For a given patient, the value of the intrinsic clearance (CLi) was calculated from the value of the standard human CLityp and other parameters accounting for genotype, drug–drug interactions, and liver function. The equation contained three parts: for CYP3A5, CYP3A4, and for other routes:
 |
10 |
where the fm’s are the fraction of hepatic clearance due to each pathway in a typical patient with normal liver function and no interacting drug, FACYP3A5 the fraction of activity of CYP3A5 depending on genotype, FACYP3A4 the fraction of activity of CYP3A4 depending on liver function, IR the inhibition ratio (i.e., the inhibiting power) of concomitant CYP3A4 inhibitor(s), and FLM the fraction of functional liver mass. The value of CLityp was estimated from the data of six patients from the clinical study (see below).
The values of FLM and FACYP3A4 are equal to 1 for patients with normal liver function. The values of FACYP3A5 were set at 1, 0.5, and 0, for *1*1, *1*3, and *3*3 genotypes of CYP3A5, respectively. The value of the fmCYP3A5 for tacrolimus was calculated by comparing oral clearance of *1*1 patient (CYP3A5 expressors) and *3*3 patient (non-expressors) as proposed by Ohno (37):
 |
11 |
At day 28 after transplantation, fmCYP3A5 of tacrolimus was found to be 0.40 (38).
Tacrolimus is more metabolized by CYP3A5 than by CYP3A4 (39). The value of the fraction of clearance due to CYP3A4 + CYP3A5 for tacrolimus was calculated by comparing the AUCs of tacrolimus given alone or with a strong inhibitor (IR = 1) of CYP3A4–CYPA5 (37). The AUC ratio for such interactions is typically about 3 (40,41). According to the equation of Ohno (37), the fmCYP3A4 + CYP3A5 is therefore about 0.65. Consequently, values for fmCYP3A4 and fmother were set to 0.25 (i.e., 0.65 minus 0.4) and 0.35 (i.e., 1 minus 0.65), respectively.
In our model, when there was no association with a CYP3A inhibitor, IR was set to 0. For low and moderate inhibition, IR was set to 0.10 and 0.60, respectively. These values are consistent with the IRs of CYP3A4 inhibitors determined by Ohno (37).
Absorption
The equation describing the variation of the free drug concentration in the portal water after absorption from the gut is:
 |
12 |
where ka is the first-order absorption rate constant, Fg the fraction of dose absorbed, and D the dose. Values of ka and Fg were set to 4.5 h−1 (35) and 0.2 (42), respectively. To test the possible influence of both PgP genotype and intestinal CYP3A metabolism, different values of Fg were explored, from 0.10 to 0.40.
Accounting for Body Weight
The mass of each organ, Vi, was adjusted with respect to body weight (BW) and mass of adipose tissue, as follows. The proportion of fat (Pfat) was calculated according to (43). Because the adipose compartment is assumed to contain 80% fat and 20% water, the mass of adipose tissue is a function of BW and proportion of fat:
 |
13 |
For a 35-year-old patient with BW and height of the standard human (a male of 70 kg, 1.73 m, 1.83 m2), Pfat is 20% (43), and the mass of adipose tissue is therefore 17.5 kg. The mass of other organs was multiplied by a factor (cor) depending on the mass of adipose tissue:
 |
14 |
Finally, this model takes into account BW, proportion of fat (related to age, sex, and height), hematocrit, lipid fraction of organs, mass and blood flow of organs, liver function, CYP3A5 genotype of liver cells, concomitant drugs (CYP3A4 inhibitors), and intestinal bioavailability. The model was implemented in the software ADAPT II (44).
Compartment Lumping
To reduce the number of compartments and to simplify the model, the method proposed by Pilari and Huisinga (45) was applied to identify organs and tissues that can be lumped together. This method determines the number and composition of lumped compartments based on the normalized PK profiles in the distribution and elimination phase. The total concentration versus time profile in each tissue CTi(t) was normalized by its tissue-to-blood partition coefficient, Kpbi:
 |
15 |
where ETi denotes the tissue extraction ratio. For non-eliminating tissues, ETi = 0, while for the liver ETi = Eh which was calculated assuming the well-stirred model (46):
 |
16 |
The tissue-to-blood partition coefficients were calculated as:
 |
17 |
The normalized concentration–time profiles were used to identify groups of compartments of the initial PBPK model that are kinetically similar (i.e., superimposable) by visual inspection of the plots. Then, for each group of tissues, the lumped volume, blood flow, and partition coefficient were determined to simulate concentration profiles in the lumped compartments (48). More details are described in the Appendix.
Final Adjustment of the Lumped PBPK Model
To better adjust the value of some parameters: the binding capacity (Bmax), the affinity constant (KD) to red blood cells, and the hepatic intrinsic clearance for standard human (CLityp), the lumped PBPK model was fitted individually by non-linear regression (weighted least-squares) to the venous tacrolimus concentrations of six patients randomly selected from the clinical study.
Evaluation of the Lumped PBPK Model
First, a “paired” comparison was carried out. Using the lumped PBPK model, the dosing history, and the covariate values, we simulated the concentrations corresponding to all observations gained in the 39 patients for which all required covariates were available (donor CYPA3A5 genotype, interacting drug, recipient PgP genotype, hematocrit, body weight, age, and sex), while the parameters ka, fup, and CLityp were fixed to their typical value. Quality of the model was assessed graphically by a plot of predicted versus observed concentrations.
Second, a “parallel group” comparison was carried out. Tacrolimus concentrations were simulated in a virtual population (500 fictive patients) defined by distributions of body weight, hematocrit, fup, Fg, and Pfat (normal distribution with a coefficient of variation of 20%). The remaining parameters were set at their typical value. Simulations were made for the different CYP3A5 genotypes of the donor and different degrees of CYP3A4 inhibition due to association with CYP3A4 inhibitors. In these simulations, tacrolimus was assumed to be given every 12 h; C0 and C2 were computed after the 14th dose. The distributions of simulated concentrations were compared graphically with those observed in the clinical study.
Finally, to check the consistency of concentration in hepatic tissue, simulated values of total tacrolimus concentration in liver were compared with those obtained by the team of Wallemacq (47).
Evaluation of the Impact of Potential Covariates
Physiological variables in the model that could be modified to perform simulations were as follows: BW, proportion of adipose tissue, hematocrit, plasma unbound fraction of tacrolimus, proportion of fat in organs, intestinal bioavailability, blood flows (of adipose tissue and lumped compartment), typical intrinsic clearance, fraction of activity of CYP3A4 and CYP3A5, and CYP3A4 inhibition ratio of the associated drug. Although blood flows of hepatic artery and portal vein could not be measured in clinical practice, vascular function of the graft is regularly monitored by Doppler in the first months after liver transplantation because thrombosis of hepatic vessels remains a pejorative factor. Since any graft vascular dysfunction did not occur for the included patients during the study and as liver blood flow has a weak influence on hepatic clearance of tacrolimus, a low extraction drug, the impact of hepatic artery and portal vein blood flow variations was not simulated.
To perform simulations with the lumped PBPK model, coefficient of variation for BW, proportion of adipose tissue, and hematocrit was chosen to match with the range observed in the clinical study. Values of covariates are presented in Table I. The SD of F was fixed to zero because C0 is almost proportional to F, hence F does not contribute to the ranking of covariates impact. The SD of FACYP3A4 was also fixed to zero because the variation of clearance is accounted for by that of typical CLi.
Table I.
Distribution of Parameters Used for Simulations
| Mean | SD | |
|---|---|---|
| Body weight (kg) | 70.0 | 12.1 |
| Proportion of adipose tissue | 0.20 | 0.039 |
| Hematocrit | 0.29 | 0.039 |
| Blood flow of adipose tissue (l/h) | 44.3 | 4.71 |
| Blood flow of lumped compartment (l/h) | 196.4 | 23.2 |
| Factor of lipid fraction in organsa | 1 | 0.15 |
| Typical CLi (l/h) | 10,600 | 2,115 |
| FACYP3A4 | 1 | 0 |
| Fraction of dose absorbed | 1 | 0 |
| Unbound fraction in plasma | 0.012 | 0.003 |
aMultiplying factor of lfrac(i)
To quantify the effect of all these variables on tacrolimus C0, simulations of 500 patients were done with ADAPT II (44). In all cases, the dosing regimen was 0.03 mg/kg every 12 h of Prograf®. Each covariate was fixed to one of three values chosen in the range of variation of this covariate (e.g., 50, 70, and 100 kg for BW), and the distribution of C0 was simulated by drawing random values of the other covariates and parameters in their distribution, assuming a normal liver function, CYP3A5 *3/*3 genotype, and no drug interaction. For all covariates, a lognormal distribution was assumed.
Dosing Recommendations
Simulations of the PBPK model were made to determine (by trial-and-error method) the initial dosing regimen of tacrolimus required to reach a C0 of 10 ng/ml at day 5. Simulations were made for a standard human (BW of 70 kg, Pfat of 20%) and without drug interaction.
Statistical Methods
Statistical analyses were carried out by using the SPSS package (version 17; SPSS, Chicago, Illinois, USA). Non-parametric tests (Mann–Whitney for simple comparison and Kruskal–Wallis for multiple comparison) were used with an alpha risk fixed at 5%.
RESULTS
Preliminary Population PK Study
Mean (SD) patient age and BW were 52.9 ± 10.1 years and 70.8 ± 13.4 kg, respectively. Mean dosing regimen of tacrolimus was 0.074 ± 0.059 mg/kg/day, with a median of 0.06 mg/kg/day. Characteristics of the 66 liver transplant recipients included are detailed in Table II. Genotypes of PgP and CYP3A5 of donor and liver transplant recipients are summarized in Table III (34% of missing values).
Table II.
Clinical Study: Patient Characteristics
| n | Mean | SD | Median | Range | |
|---|---|---|---|---|---|
| Age (years) | 66 | 52.9 | 10.2 | 55 | 26–67 |
| Body weight (kg) | 64 | 71.5 | 13 | 72.5 | 45–107 |
| Total plasma proteins (g/l) | 66 | 56.3 | 11.6 | 57 | 26–97 |
| Albumin concentration (g/l) | 44 | 27.9 | 10.5 | 27 | 11–87 |
| Coagulation factor V (%) | 57 | 97.5 | 38.2 | 93 | 17–196 |
| Prothrombin times (%) | 66 | 79.3 | 20 | 79 | 1.9–180 |
| Total bilirubin (μmol/l) | 66 | 54.9 | 85.3 | 23 | 4–631 |
| Conjugate bilirubin (μmol/l) | 66 | 38.9 | 65.3 | 13 | 2–487 |
| Alkaline phosphatase (IU/l) | 66 | 204 | 185 | 144 | 9–1,648 |
| Gamma glutamyl transferase (IU/l) | 66 | 217 | 208 | 160.5 | 4–1,854 |
| Alanine aminotransferase (IU/l) | 66 | 242 | 527 | 97 | 8–12,337 |
| Aspartate aminotransferase (IU/l) | 66 | 155 | 536 | 43 | 6–9,391 |
| Serum creatinine concentration (μmol/l) | 66 | 92.6 | 43.7 | 84 | 11–525 |
| Red blood cell count (T/l) | 66 | 3.24 | 0.51 | 3.2 | 2–4.7 |
| Hematocrit (%) | 66 | 29.5 | 4.37 | 29 | 19–43 |
| Initial dosage regimen (mg/day) | 66 | 3.78 | 4.06 | 2 | 0.5–16 |
| Initial dosage regimen (mg/kg/day) | 64 | 0.05 | 0.06 | 0.03 | 0.01–0.29 |
Table III.
Genotypic Characteristic of Donor and Liver Transplant Recipients in the Clinical Study
| Genotype | n | % | ||
|---|---|---|---|---|
| CYP 3A5 intron 3 | Donor | *1/*1 | 0 | 0 |
| *1/*3 | 8 | 20 | ||
| *3/*3 | 32 | 80 | ||
| Recipient | *1/*1 | 2 | 4 | |
| *1/*3 | 6 | 12 | ||
| *3/*3 | 43 | 84 | ||
| MDR1 exon 26 | Donor | C/C | 7 | 20 |
| C/T | 20 | 57 | ||
| T/T | 8 | 23 | ||
| Recipient | C/C | 17 | 35 | |
| C/T | 17 | 35 | ||
| T/T | 14 | 30 |
A one-compartment model with first-order absorption and elimination rate adequately described the data. Typical population estimates (relative standard error) of absorption rate constant (ka), apparent distribution volume (Vd/F), and apparent clearance (CL/F) were 0.91 h−1 (216%), 486 l (21%), and 17.4 l/h (25%), respectively. CL of tacrolimus was negatively correlated to AP (r = −0.96) and AST (r = −0.92), p < 0.05. No significant variation of CL/F and Vd/F estimates over time was found during the observation period, once the other covariates were taken into account.
CYP3A5 donor and PgP recipient genotypes were also significant covariates of CL/F (Fig. 2). Mean apparent estimated clearance was lower when the donor was CYP3A5*3/*3 homozygote rather than carrying at least one CYP3A5*1 allele: 12.6 ± 4.6 vs. 24.8 ± 3.1 l/h (p < 0.005). For PgP, there was a significant difference between the mean apparent CL of the three types of patients: 13.7 ± 6.1 l/h for T/T homozygote, 14.2 ± 4.6 l/h for C/T heterozygote, and 18.5 ± 5.3 l/h for C/C homozygote recipients (p < 0.05). By taking into account the covariates (AP, AST, and genotypes), the unexplained variability of apparent clearance was reduced by 20% (from 80% in the model without covariate to 64% in the final model).
Fig. 2.
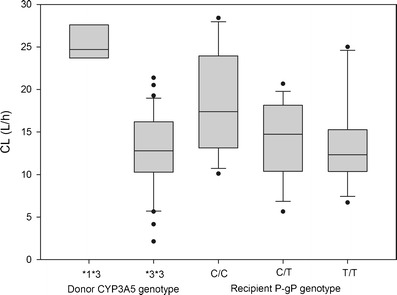
Effects of CYP35 genotype of donor (a) and PgP genotype of recipient (b) on tacrolimus clearance of recipients in the clinical study (p < 0.05). The boxes represent the distribution of the empirical Bayes estimates of tacrolimus clearance from the population model. In the boxes are shown the median (inside the box), 25th, 75th percentiles (limits of the box), and 10th, 90th percentiles (error bars outside of the box). Each dot represents a single value outside of the 10–90th percentile interval
Compartment Lumping of the PBPK Model
Supplemental Fig. 1 depicts normalized concentration–time profiles of all 13 compartments of the PBPK full model. For the liver, the value of Eh was set at 0.034, corresponding to the mean dosing regimen of 0.06 mg/kg/day.
By visual inspection, apart from venous compartment and arterial compartment, three different groups of tissues with almost identical normalized concentration–time profiles were identified: (1) adipose tissue; (2) liver; and (3) others—lung, kidney, heart, brain, skin, muscle, tendons, and other organs. Hence, a lumped compartment corresponding to “others” was defined, and the lumped PBPK model consisted in only five compartments.
Estimation of PBPK Parameters
From the fit of the lumped PBPK model to the data of six patients, median estimated values of Bmax, KD, and CLityp were 243 μg/l, 7.8 μg/l, and 10 600 l/h, respectively. The predicted versus observed concentration plot for these six patients is presented in Fig. 3. Time–concentration profile for a typical patient is shown in Supplemental Fig. 2.
Fig. 3.
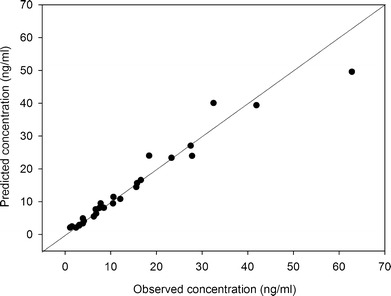
Predicted versus observed tacrolimus concentrations of the six patients used for parameter estimation in the lumped PBPK model. The squares are the measured tacrolimus concentrations in whole blood. The line is the identity (y = x) line
Evaluation of the Lumped PBPK Model
The results of the paired comparison are shown in Fig. 4. In 89% of cases, the predicted concentration falls in the range 0.33- to 3-fold around the observed concentration. The prediction errors result in part from the fact that ka, fup, and CLityp were fixed to a common value for all patients.
Fig. 4.
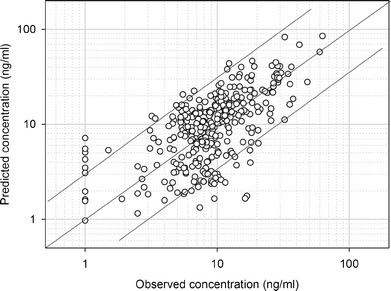
Predicted versus observed tacrolimus concentrations of the 39 patients with which all covariates were recorded. Predicted concentrations were calculated using the lumped PBPK model and the patient’s covariates. The lines are the identity (y = x) line and the y = 3x and y = 0.33x lines
Next, the parallel group comparison was carried out for recipients of a liver with CYP3A5 *3/*3 genotype. For low and moderate drug inhibition, mean observed versus simulated C0 of tacrolimus at day 5 were 8.22 vs. 8.34 and 10.3 vs. 10.6 ng/ml, respectively. Results are presented in Fig. 5.
Fig. 5.
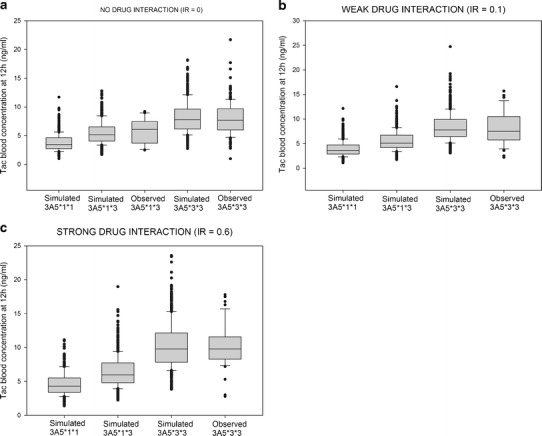
Comparison between simulated and observed tacrolimus (TAC) exposure without drug–drug interaction (a), when associated with a CYP3A4 inhibitor with low IR (b), and when associated with a CYP3A4 inhibitor with moderate IR (c). In the boxes are shown the median (inside the box), 25th, 75th percentiles (limits of the box), and 10th, 90th percentiles (error bars outside of the box). Each dot represents a single value outside of the 10–90th percentile interval
Simulated value of total concentration of tacrolimus in liver in a standard human with a dosing regimen of 0.025 mg/kg/day has been found around 50 ng/g. This value is consistent with that obtained by Wallemacq (mean 91 ng/g, range 10 to 295 ng/g) (47).
Effect of Parameters and Covariates on Tacrolimus C0
The simulated distributions of tacrolimus trough blood concentration as a function of covariate values are shown in Table IV. The covariates with the greatest influence were the unbound fraction in plasma, the typical intrinsic clearance, and the fraction of dose absorbed. The blood flow of adipose tissue and lumped compartment, and the proportion of fat in organs had a minor impact on tacrolimus C0 when the value of these covariates varied by 20% around the typical value (data not shown).
Table IV.
Simulated Distributions of Tacrolimus Trough Blood Concentration (ng/ml) as a Function of Covariate Values, Assuming a 0.03 mg/kg Bid Regimen, CYP3A5 *3/*3 Genotype, and No Drug Interaction
| Tacrolimus C0 (ng/ml) | |||||
|---|---|---|---|---|---|
| Value | Mean | Median | 5th–95th percentile | Fold variationa | |
| Plasma unbound fraction | 0.006 | 16.6 | 15.6 | 7.74–29.7 | 4.1 |
| 0.012 | 8.24 | 7.72 | 3.66–15.0 | ||
| 0.024 | 4.04 | 3.77 | 1.77–7.43 | ||
| Typical intrinsic clearance (l/h) | 5,300 | 18.4 | 17.3 | 9.65–30.4 | 4 |
| 10,600 | 8.16 | 7.57 | 3.94–14.6 | ||
| 15,900 | 4.62 | 4.26 | 1.91–8.40 | ||
| Bioavailability | 0.1 | 4.31 | 4.00 | 1.81–8.11 | 3.94 |
| 0.2 | 8.63 | 8.04 | 3.60–15.8 | ||
| 0.4 | 17.0 | 16.1 | 7.40–30.6 | ||
| Body weight (kg) | 50 | 5.31 | 4.77 | 2.08–10.1 | 2.5 |
| 70 | 8.54 | 7.81 | 3.61–15.7 | ||
| 100 | 13.3 | 12.2 | 5.99–23.2 | ||
| Hematocrit | 0.19 | 5.40 | 4.99 | 2.19–10.4 | 2.4 |
| 0.29 | 8.41 | 7.81 | 3.45–16.3 | ||
| 0.43 | 12.8 | 11.9 | 5.26–24.7 | ||
| Fraction of activity of CYP3A4 | 0.5 | 11.5 | 10.8 | 4.68–20.6 | 1.7 |
| 1 | 8.53 | 7.81 | 3.43–16.6 | ||
| 1.5 | 6.60 | 5.96 | 2.56–13.0 | ||
| Proportion of adipose tissue | 0.1 | 6.69 | 5.95 | 2.20–13.9 | 1.5 |
| 0.2 | 8.51 | 7.81 | 3.38–16.5 | ||
| 0.4 | 10.1 | 9.27 | 4.30–18.6 | ||
aRatio of the highest value of mean Co to the lowest value of mean Co
Effect of Genetic Status and CYP3A4 Inhibitors on Tacrolimus C0
For each genotype of CYP3A5, C0 were simulated for the three levels of inhibition of CYP3A4: no inhibition, low inhibition, and moderate inhibition with IR of 0, 0.10, and 0.60, respectively (Fig. 5). Without drug–drug interaction, mean simulated C0 of tacrolimus for the three genotypes of CYP3A5 were 3.75, 5.31, and 7.98 ng/ml for *1/*1, *1/*3, and *3/*3, respectively. Means are significantly different (p < 0.05) (Fig. 5a) and CYP3A5*3*3 resulted in a 2.1-fold higher C0 than CYP3A5*1*1. When a moderate inhibition occurred, a significant but modest increase in C0 tacrolimus was also found for all CYP3A5 genotypes (p < 0.05) (Fig. 5b).
Proposal of Initial Dosing Regimen of Tacrolimus
Table V details the proposed initial dosing regimen to reach a C0 of 10 ng/ml at day 5 for a standard human (BW of 70 kg, Pfat of 20%) and without drug interaction. Recommendations for a target of 8 ng/ml are about 20% lower because the kinetics is quasi-linear in this range of concentration (data not shown).
Table V.
Proposal of Tacrolimus Initial Dosage Regimen (mg/kg/day) as a Function of CYP3A5 Donor Genotype and Recipient Hematocrit
| Hematocrit | |||
|---|---|---|---|
| CYP3A5 genotype | 0.19 | 0.29 | 0.43 |
| *1/*1 | 0.22 | 0.16 | 0.10 |
| *1/*3 | 0.16 | 0.11 | 0.07 |
| *3/*3 | 0.11 | 0.07 | 0.05 |
DISCUSSION
In this study, a PBPK model was built with the primary intention to identify and to rank the most influential factors of variability in tacrolimus trough blood concentration because this concentration is the benchmark for therapeutic drug monitoring.
In a first step, a pharmacokinetic study was carried out, then analyzed by a population approach (1) to determine the influence of genetic polymorphisms of CYP3A5 and PgP on tacrolimus kinetics, (2) to estimate some key parameters of the PBPK model, and (3) to evaluate the PBPK model by comparing model simulations to experimental data.
The pharmacokinetic parameters estimated in the PK study were consistent with the literature with regard to ka (35) and Vd (22). Mean apparent estimated clearance (CL/F) was somewhat lower than that previously published in adult liver transplant recipients, between 26.5 and 36 l/h, possibly because data were obtained sooner after surgical operation (22,23). The effect of the post-operative time on PK parameters, particularly clearance, was assessed during the first month; some studies found an increase in clearance after liver transplantation (21,23,48). In our study, no significant trend has been found. A possible explanation is that only inhibitors of tacrolimus metabolism were co-administered during this study and mainly during the second week after transplantation. Probably these drugs played an important role in this apparent clearance stability, compensating by their inhibiting action the increase of tacrolimus clearance.
Regarding CYP3A5, a strong relationship between the CYP3A5 (6986A > G) genotype and tacrolimus pharmacokinetics has been demonstrated in kidney, heart, and liver transplant recipients (11). Almost all studies have reported lower dose-adjusted tacrolimus exposure and/or a higher dose requirement in individuals with at least one CYP3A5*1 allele than in CYP3A5*3 homozygotes (11), as is consistent with lower metabolic capacity in patients with the variant allele. In our study, tacrolimus clearance was related with the CYP3A5 genotype of the transplanted liver. In agreement with earlier observations (49,50), this result may be explained by the fact that CYP3A5 activity is mainly found in the liver.
On the contrary, influence of the P-pg (3435C > T) genotype on the pharmacokinetics of tacrolimus remains uncertain. Indeed, the majority of studies have failed to find any association between PgP genotype and tacrolimus pharmacokinetics (11). However, some studies have demonstrated a higher tacrolimus C0/dose and a lower dose requirement in patients with the 3435TT variant genotype than in those with the 3435CC wild-type genotype (11), which is consistent with lower functional activity of P-glycoprotein in the variant genotype. Furthermore, a study of 60 liver transplant recipients has shown that the initial intestinal MDR1 mRNA level, which varied 100-fold among patients, was correlated with tacrolimus clearance and contributed to explain about 7% of its variability (51). In our study, there was an approximately 1.5-fold difference in tacrolimus estimated clearance (CL/F) between TT and CC recipients, while PgP genotype of the transplanted liver had little impact on tacrolimus clearance. This may be explained if PgP is involved mainly in tacrolimus efflux in the intestine, but not in the liver.
In a second step, the PBPK model was built. Its main features are that (1) tacrolimus distribution is governed by binding to plasma proteins, saturable binding to red blood cells, and binding to lipids in tissues, while (2) tacrolimus elimination is determined by hepatic metabolism by CYP3A4, CYP3A5, and others. Absorption was described as a first-order process, with variability in tacrolimus absorbed fraction due in part to PgP polymorphism. However, due to the lack of detailed knowledge of the relationship between PgP genotype and F, bioavailability was simply assumed to vary 4-fold in the population. This is larger than the observed variability in estimated CL/F due to PgP polymorphism (1.5-fold) because other factors such as food or enteral feeding also contribute to variability.
Because our aim was to determine the covariates of tacrolimus pharmacokinetics using the PBPK model, it was important to reduce the number of parameters of the model. Using the lumping approach of Pilari (45), the original 13-compartment model was reduced to a five-compartment model retaining the full capacity to describe tacrolimus pharmacokinetic profile. Hence, the number of parameters in the model was greatly reduced, thereby decreasing the number of simulations required to explore the influence of the parameters on tacrolimus kinetics. With the lumped model, the fitted values of Bmax and k were consistent with these found by Jusko et al. (k = 3.8 ± 4.7 μg/l and Bmax = 418 ± 285 μg/l) (35). Likewise, the median of hepatic clearance was found to be 112 l/h, similar to 124 l/h found in the literature (35).
In spite of numerous assumptions and approximations in the construction of the PBPK model resulting from current insufficient knowledge, the evaluation of the model revealed no major discrepancy with the available data. Because of the lack of patients with the genotype *1/*1 in the clinical study, comparison between observed and estimated values could not be performed for this population. Indeed, the genotype *1/*1 represents 1.2% of Caucasian population (16). In our study, the fraction of rapid metabolizer recipients and donors was 4 and 0%, respectively. Hence, the predictions of the model could not be fully evaluated and these predictions should be regarded with caution.
With the range of covariate values tested, the impact of each covariate on tacrolimus C0 variation was evaluated by the ratio between the largest and the lowest mean concentration (fold variation of the mean). Covariates were ranked as follows: unbound fraction in plasma, typical intrinsic clearance, bioavailability, BW, hematocrit, CYP3A5 polymorphism, fraction of activity of CYP3A4, proportion of adipose tissue, and CYP3A4 inhibitory drug–drug interaction. For continuous covariates such as BW, the fold-variation factors depend obviously on the range of variation considered in the simulations. Nevertheless, they indicate clearly the trends. The impact of each covariate on tacrolimus daily AUC was also evaluated in the same way (data not shown); the fold variation of AUC due to each covariate was similar to that of C0.
According to the PBPK model, tacrolimus clearance is a function of fub (i.e., fup and hct), typical value of intrinsic clearance, CYP3A5 genotype of liver donor, and drug–drug interactions on CYP3A4; volume of distribution is a function of fub, body weight, and fat proportion; and F is a function of PgP genotype of the recipient. In the population analysis of the clinical study, CL/F was related to AP and AST activities, CYP3A5 genotype of liver donor, and PgP genotype of the recipient; no covariate was found for Vd/F. Both approaches are consistent if we admit that AST and AP are correlated with the typical value of intrinsic clearance. Some covariates found by the bottom-up approach were not identified in the clinical study. Reasons for this discrepancy are lack of measurement in the clinical study (fup, fat proportion), lack of statistical power due to limited number of cases (drug–drug interactions on clearance, PgP genotype on Vd) or limited range of variation (body weight), and possibly confounding effects due to simultaneous variations of several factors.
The model did not take into account the association with steroid therapy. In the literature, high-dose steroids were shown to increase or decrease the concentration of tacrolimus (52,53). Likewise, the alpha-1 acid glycoprotein and HDL concentrations (two major tacrolimus binding proteins) (54) were not measured. Values of alpha-1 acid glycoprotein are known to increase during the 3 days post-transplantation (55), and fuP might thus vary over time.
Some of the covariates found in this list were known or anticipated. For example, in adult liver transplant recipients, the delay for normal functions of recipients has been shown to have a major influence on tacrolimus elimination (56). Liver functional status influences tacrolimus clearance (57,58). Some covariates had not been characterized previously and were revealed by the bottom-up approach, such as the proportion of fat and the unbound fraction in plasma. From a clinical perspective, measuring plasma unbound fraction of tacrolimus may not be practicable in routine. But estimating the unbound fraction knowing alpha-1 acid glycoprotein and lipoproteins levels may be feasible (54). To evaluate the proportion of adipose tissue of patient, different methods could be used (such as anthropometric methods or bioelectrical impedance analysis) (59).
The set of covariates found in this study might be used for dosing adjustments in two ways. First, it may be used to determine the initial dose of tacrolimus, as shown in Table V, where three measurable covariates (BW, hematocrit, and CYP3A5 donor genotype) have been taken into account. Our dosing recommendations are in the 0.04 to 0.20 mg/kg/day range, while in the Prograf® prescribing information (60), dosing regimen proposed are from 0.10 to 0.20 mg/kg/day. These recommendations rely on the assumption of a constant dosing regimen and strict adherence to the dosing schedule during the first 5 days after treatment onset. But in many cases, tacrolimus dose is changed during this period. Hence, the target concentration might not be reached, and measuring tacrolimus trough concentrations remains mandatory. Second, the set of covariates may be used to adjust the dose by the Bayesian method during the treatment, by incorporating these covariates in a population pharmacokinetic model based on the lumped PBPK model. A suitable model is described in the Appendix.
A prospective randomized trial in renal transplant recipients has investigated the potential benefit of optimizing the initial tacrolimus dose based on CYP3A5 genotype alone (i.e., 0.20 mg/kg/day for CYP3A5*1 allele carriers and 0.04 g/kg/day for CYP3A5*3/*3 homozygous patients), and 56.8% of patients still did not have tacrolimus C0 within the desired target range in the first days after treatment onset (61). De Jonge et al. have found that the CYP3A5 genotype is a major determinant of tacrolimus disposition as it explains 29–35% of the pharmacokinetic parameters (26), but obviously, it remains a large proportion of residual variability, which can explain the result of the latter trial. Our table, taking into account the CYP3A5 genotype and the hematocrit, is consistent with these data and gives more detailed recommendations.
CONCLUSIONS
The bottom-up approach allowed to identify and to rank the influence of relevant covariates on C0 of tacrolimus. The most influential covariates were unbound fraction, intrinsic clearance, CYP3A5 genotype of the liver donor, body weight, and hematocrit of the patient. Future studies should identify the factors determining tacrolimus unbound fraction. These covariates should be taken into account for initial dosing and in the pharmacokinetic model used for adjusting tacrolimus dose in liver transplant recipients.
Electronic supplementary material
Normalized concentration–time profiles of tacrolimus in the 13 compartments of the full PBPK model. (JPEG 6 kb)
Time–concentration curve profiles of a representative patient. The squares are the measured tacrolimus concentrations in whole blood. The line is the fitted lumped PBPK model. (JPEG 7 kb)
Acknowledgments
The clinical study was sponsored and granted by Assistance Publique—Hôpitaux de Paris, Paris, France.
Thanks to the physicians who included the patients in Cochin Hospital: Denis Archambeau, Francois Baudin, Denis Bernard, and Yvon Calmus.
Thanks to the surgeons and physicians who contributed to this study in Beaujon hospital: Jacques Belghiti, Federica Dondero, Claire Francoz, and Daniele Sommacale.
Thanks to the surgeons and physicians who contributed to this study in Mondor hospital: Alexis Laurent, Thomas Deceans, Charlotte Costentin, and Monika Hurtova.
Thanks to Laetitia Grégoire and Frédérique Franco for monitoring the data.
APPENDIX
Derivation of the Tissue to Blood Partition Coefficient
The tissue to plasma partition coefficient, Kpi, is:
 |
where CT and Cp are the total concentrations measured in milligrams per kilogram at steady state in tissue and plasma, respectively. The tissue-to-plasma partition coefficient may be expressed as:
 |
The tissue-to-blood partition coefficient, Kpbi, is:
 |
BPR may be expressed as a Kp:
 |
Hence
 |
Lumping Procedure
The unbound drug volume of distribution of each organ is Vi.wfraci/fuTi.
The unbound drug volume of distribution of the lumped compartment, VL, is the sum of its elements over the n compartments to be lumped:
 |
The tissue-to-plasma partition coefficient of the lumped compartment, KpL, is:
 |
The unbound clearance of distribution of the lumped compartment, CLdL, is:
 |
The rate constant for free drug diffusion from blood water to organ water in the lumped compartment, is simply:
 |
and the corresponding differential equation is:
 |
Derivation of a One-Compartment Model for Therapeutic Drug Monitoring
Linear kinetics (constant value of BPR) is assumed. TAC is measured in whole blood.
 |
 |
 |
FACYP3A5 is fixed according to donor genotype. CLityp is fixed to 10,600 l/h.
F = 0.226 (T/T), 0.218 (C/T), and 0.168 (C/C) according to recipient PgP exon 26 genotype.
 |
where  and Vadipose = BW.Pfat/0.80
 with
with 
The covariates are BW, Pfat, hct, and CYPA5 and PgP genotype.
The parameters to be estimated are ka, fup, and FACYP3A4.
Secondary parameters are fub, BPR, CL, Vd, and T1/2.
References
- 1.Kino T, Hatanaka H, Hashimoto M, Nishiyama M, Goto T, Okuhara M, et al. FK-506, a novel immunosuppressant isolated from a Streptomyces. I. Fermentation, isolation, and physico-chemical and biological characteristics. J Antibiot (Tokyo) 1987;40(9):1249–1255. doi: 10.7164/antibiotics.40.1249. [DOI] [PubMed] [Google Scholar]
- 2.Kino T, Hatanaka H, Miyata S, Inamura N, Nishiyama M, Yajima T, et al. FK-506, a novel immunosuppressant isolated from a Streptomyces. II. Immunosuppressive effect of FK-506 in vitro. J Antibiot (Tokyo) 1987;40(9):1256–1265. doi: 10.7164/antibiotics.40.1256. [DOI] [PubMed] [Google Scholar]
- 3.Venkataramanan R, Swaminathan A, Prasad T, Jain A, Zuckerman S, Warty V, et al. Clinical pharmacokinetics of tacrolimus. Clin Pharmacokinet. 1995;29(6):404–430. doi: 10.2165/00003088-199529060-00003. [DOI] [PubMed] [Google Scholar]
- 4.Wong SH. Therapeutic drug monitoring for immunosuppressants. Clin Chim Acta. 2001;313(1–2):241–253. doi: 10.1016/S0009-8981(01)00678-7. [DOI] [PubMed] [Google Scholar]
- 5.Staatz CE, Tett SE. Clinical pharmacokinetics and pharmacodynamics of tacrolimus in solid organ transplantation. Clin Pharmacokinet. 2004;43(10):623–653. doi: 10.2165/00003088-200443100-00001. [DOI] [PubMed] [Google Scholar]
- 6.Wallemacq P, Armstrong VW, Brunet M, Haufroid V, Holt DW, Johnston A, et al. Opportunities to optimize tacrolimus therapy in solid organ transplantation: report of the European consensus conference. Ther Drug Monit. 2009;31(2):139–152. doi: 10.1097/FTD.0b013e318198d092. [DOI] [PubMed] [Google Scholar]
- 7.Rodriguez-Peralvarez M, Germani G, Darius T, Lerut J, Tsochatzis E, Burroughs AK. Tacrolimus trough levels, rejection and renal impairment in liver transplantation: a systematic review and meta-analysis. Am J Transplant. 2012;12(10):2797–2814. doi: 10.1111/j.1600-6143.2012.04140.x. [DOI] [PubMed] [Google Scholar]
- 8.Rodriguez-Peralvarez M, Germani G, Papastergiou V, Tsochatzis E, Thalassinos E, Luong TV, et al. Early tacrolimus exposure after liver transplantation: relationship with moderate/severe acute rejection and long-term outcome. J Hepatol. 2012 Sep 27. [DOI] [PubMed]
- 9.Backman L, Nicar M, Levy M, Distant D, Eisenstein C, Renard T, et al. FK506 trough levels in whole blood and plasma in liver transplant recipients. Correlation with clinical events and side effects. Transplantation. 1994;57(4):519–525. doi: 10.1097/00007890-199402270-00008. [DOI] [PubMed] [Google Scholar]
- 10.Venkataramanan R, Shaw LM, Sarkozi L, Mullins R, Pirsch J, MacFarlane G, et al. Clinical utility of monitoring tacrolimus blood concentrations in liver transplant patients. J Clin Pharmacol. 2001;41(5):542–551. doi: 10.1177/00912700122010429. [DOI] [PubMed] [Google Scholar]
- 11.Staatz CE, Goodman LK, Tett SE. Effect of CYP3A and ABCB1 single nucleotide polymorphisms on the pharmacokinetics and pharmacodynamics of calcineurin inhibitors: part I. Clin Pharmacokinet. 2010;49(3):141–175. doi: 10.2165/11317350-000000000-00000. [DOI] [PubMed] [Google Scholar]
- 12.Fukudo M, Yano I, Masuda S, Goto M, Uesugi M, Katsura T, et al. Population pharmacokinetic and pharmacogenomic analysis of tacrolimus in pediatric living-donor liver transplant recipients. Clin Pharmacol Ther. 2006;80(4):331–345. doi: 10.1016/j.clpt.2006.06.008. [DOI] [PubMed] [Google Scholar]
- 13.Hesselink DA, van Schaik RH, van der Heiden IP, van der Werf M, Gregoor PJ, Lindemans J, et al. Genetic polymorphisms of the CYP3A4, CYP3A5, and MDR-1 genes and pharmacokinetics of the calcineurin inhibitors cyclosporine and tacrolimus. Clin Pharmacol Ther. 2003;74(3):245–254. doi: 10.1016/S0009-9236(03)00168-1. [DOI] [PubMed] [Google Scholar]
- 14.Thervet E, Anglicheau D, King B, Schlageter MH, Cassinat B, Beaune P, et al. Impact of cytochrome p450 3A5 genetic polymorphism on tacrolimus doses and concentration-to-dose ratio in renal transplant recipients. Transplantation. 2003;76(8):1233–1235. doi: 10.1097/01.TP.0000090753.99170.89. [DOI] [PubMed] [Google Scholar]
- 15.Kuehl P, Zhang J, Lin Y, Lamba J, Assem M, Schuetz J, et al. Sequence diversity in CYP3A promoters and characterization of the genetic basis of polymorphic CYP3A5 expression. Nat Genet. 2001;27(4):383–391. doi: 10.1038/86882. [DOI] [PubMed] [Google Scholar]
- 16.Blanco JG, Edick MJ, Hancock ML, Winick NJ, Dervieux T, Amylon MD, et al. Genetic polymorphisms in CYP3A5, CYP3A4 and NQO1 in children who developed therapy-related myeloid malignancies. Pharmacogenetics. 2002;12(8):605–611. doi: 10.1097/00008571-200211000-00004. [DOI] [PubMed] [Google Scholar]
- 17.Hoffmeyer S, Burk O, von Richter O, Arnold HP, Brockmoller J, Johne A, et al. Functional polymorphisms of the human multidrug-resistance gene: multiple sequence variations and correlation of one allele with P-glycoprotein expression and activity in vivo. Proc Natl Acad Sci U S A. 2000;97(7):3473–3478. doi: 10.1073/pnas.97.7.3473. [DOI] [PMC free article] [PubMed] [Google Scholar]
- 18.Ambudkar SV, Dey S, Hrycyna CA, Ramachandra M, Pastan I, Gottesman MM. Biochemical, cellular, and pharmacological aspects of the multidrug transporter. Annu Rev Pharmacol Toxicol. 1999;39:361–398. doi: 10.1146/annurev.pharmtox.39.1.361. [DOI] [PubMed] [Google Scholar]
- 19.Saeki T, Ueda K, Tanigawara Y, Hori R, Komano T. Human P-glycoprotein transports cyclosporin A and FK506. J Biol Chem. 1993;268(9):6077–6080. [PubMed] [Google Scholar]
- 20.Staatz CE, Taylor PJ, Lynch SV, Willis C, Charles BG, Tett SE. Population pharmacokinetics of tacrolimus in children who receive cut-down or full liver transplants. Transplantation. 2001;72(6):1056–1061. doi: 10.1097/00007890-200109270-00013. [DOI] [PubMed] [Google Scholar]
- 21.Fukudo M, Yano I, Fukatsu S, Saito H, Uemoto S, Kiuchi T, et al. Forecasting of blood tacrolimus concentrations based on the Bayesian method in adult patients receiving living-donor liver transplantation. Clin Pharmacokinet. 2003;42(13):1161–1178. doi: 10.2165/00003088-200342130-00006. [DOI] [PubMed] [Google Scholar]
- 22.Staatz CE, Willis C, Taylor PJ, Lynch SV, Tett SE. Toward better outcomes with tacrolimus therapy: population pharmacokinetics and individualized dosage prediction in adult liver transplantation. Liver Transpl. 2003;9(2):130–137. doi: 10.1053/jlts.2003.50023. [DOI] [PubMed] [Google Scholar]
- 23.Antignac M, Hulot JS, Boleslawski E, Hannoun L, Touitou Y, Farinotti R, et al. Population pharmacokinetics of tacrolimus in full liver transplant patients: modelling of the post-operative clearance. Eur J Clin Pharmacol. 2005;61(5–6):409–416. doi: 10.1007/s00228-005-0933-6. [DOI] [PubMed] [Google Scholar]
- 24.Blanchet B, Duvoux C, Costentin CE, Barrault C, Ghaleh B, Salvat A, et al. Pharmacokinetic–pharmacodynamic assessment of tacrolimus in liver-transplant recipients during the early post-transplantation period. Ther Drug Monit. 2008;30(4):412–418. doi: 10.1097/FTD.0b013e318178e31b. [DOI] [PubMed] [Google Scholar]
- 25.Yano I, Masuda S, Egawa H, Sugimoto M, Fukudo M, Yoshida Y, et al. Significance of trough monitoring for tacrolimus blood concentration and calcineurin activity in adult patients undergoing primary living-donor liver transplantation. Eur J Clin Pharmacol. 2012;68(3):259–266. doi: 10.1007/s00228-011-1129-x. [DOI] [PubMed] [Google Scholar]
- 26.de Jonge H, de Loor H, Verbeke K, Vanrenterghem Y, Kuypers DR. In vivo CYP3A4 activity, CYP3A5 genotype, and hematocrit predict tacrolimus dose requirements and clearance in renal transplant patients. Clin Pharmacol Ther. 2012;92(3):366–375. doi: 10.1038/clpt.2012.109. [DOI] [PubMed] [Google Scholar]
- 27.Jamei M, Dickinson GL, Rostami-Hodjegan A. A framework for assessing inter-individual variability in pharmacokinetics using virtual human populations and integrating general knowledge of physical chemistry, biology, anatomy, physiology and genetics: a tale of ‘bottom-up’ vs ‘top-down’ recognition of covariates. Drug Metab Pharmacokinet. 2009;24(1):53–75. doi: 10.2133/dmpk.24.53. [DOI] [PubMed] [Google Scholar]
- 28.Ohtani H, Barter Z, Minematsu T, Makuuchi M, Sawada Y, Rostami-Hodjegan A. Bottom-up modeling and simulation of tacrolimus clearance: prospective investigation of blood cell distribution, sex and CYP3A5 expression as covariates and assessment of study power. Biopharm Drug Dispos. 2011;32(9):498–506. doi: 10.1002/bdd.777. [DOI] [PubMed] [Google Scholar]
- 29.Lavielle M. MONOLIX (MOdèles NOn LInéaires à effets miXtes) Orsay: MONOLIX group; 2008. [Google Scholar]
- 30.Mandema JW, Verotta D, Sheiner LB. Building population pharmacokinetic–pharmacodynamic models. I. Models for covariate effects. J Pharmacokinet Biopharm. 1992;20(5):511–528. doi: 10.1007/BF01061469. [DOI] [PubMed] [Google Scholar]
- 31.Levitt DG. PKQuest: a general physiologically based pharmacokinetic model. Introduction and application to propranolol. BMC Clin Pharmacol. 2002;2:5. doi: 10.1186/1472-6904-2-5. [DOI] [PMC free article] [PubMed] [Google Scholar]
- 32.Levitt DG, Schnider TW. Human physiologically based pharmacokinetic model for propofol. BMC Anesthesiol. 2005;5(1):4. doi: 10.1186/1471-2253-5-4. [DOI] [PMC free article] [PubMed] [Google Scholar]
- 33.Pang KS, Rowland M. Hepatic clearance of drugs. I. Theoretical considerations of a “well-stirred” model and a “parallel tube” model. Influence of hepatic blood flow, plasma and blood cell binding, and the hepatocellular enzymatic activity on hepatic drug clearance. J Pharmacokinet Biopharm. 1977;5(6):625–653. doi: 10.1007/BF01059688. [DOI] [PubMed] [Google Scholar]
- 34.Tacrolimus. 2012 [updated 2012; cited May 22, 2012]; Available from: http://www.drugbank.ca/drugs/DB00864.
- 35.Jusko WJ, Piekoszewski W, Klintmalm GB, Shaefer MS, Hebert MF, Piergies AA, et al. Pharmacokinetics of tacrolimus in liver transplant patients. Clin Pharmacol Ther. 1995;57(3):281–290. doi: 10.1016/0009-9236(95)90153-1. [DOI] [PubMed] [Google Scholar]
- 36.Zahir H, Nand RA, Brown KF, Tattam BN, McLachlan AJ. Validation of methods to study the distribution and protein binding of tacrolimus in human blood. J Pharmacol Toxicol Methods. 2001;46(1):27–35. doi: 10.1016/S1056-8719(02)00158-2. [DOI] [PubMed] [Google Scholar]
- 37.Ohno Y, Hisaka A, Suzuki H. General framework for the quantitative prediction of CYP3A4-mediated oral drug interactions based on the AUC increase by coadministration of standard drugs. Clin Pharmacokinet. 2007;46(8):681–696. doi: 10.2165/00003088-200746080-00005. [DOI] [PubMed] [Google Scholar]
- 38.Satoh S, Kagaya H, Saito M, Inoue T, Miura M, Inoue K, et al. Lack of tacrolimus circadian pharmacokinetics and CYP3A5 pharmacogenetics in the early and maintenance stages in Japanese renal transplant recipients. Br J Clin Pharmacol. 2008;66(2):207–214. doi: 10.1111/j.1365-2125.2008.03188.x. [DOI] [PMC free article] [PubMed] [Google Scholar]
- 39.Dai Y, Hebert MF, Isoherranen N, Davis CL, Marsh C, Shen DD, et al. Effect of CYP3A5 polymorphism on tacrolimus metabolic clearance in vitro. Drug Metab Dispos. 2006;34(5):836–847. doi: 10.1124/dmd.105.008680. [DOI] [PubMed] [Google Scholar]
- 40.Mori T, Aisa Y, Kato J, Nakamura Y, Ikeda Y, Okamoto S. Drug interaction between oral solution itraconazole and calcineurin inhibitors in allogeneic hematopoietic stem cell transplantation recipients: an association with bioavailability of oral solution itraconazole. Int J Hematol. 2009;90(1):103–107. doi: 10.1007/s12185-009-0344-z. [DOI] [PubMed] [Google Scholar]
- 41.Sansone-Parsons A, Krishna G, Martinho M, Kantesaria B, Gelone S, Mant TG. Effect of oral posaconazole on the pharmacokinetics of cyclosporine and tacrolimus. Pharmacotherapy. 2007;27(6):825–834. doi: 10.1592/phco.27.6.825. [DOI] [PubMed] [Google Scholar]
- 42.Christians U, Jacobsen W, Benet LZ, Lampen A. Mechanisms of clinically relevant drug interactions associated with tacrolimus. Clin Pharmacokinet. 2002;41(11):813–851. doi: 10.2165/00003088-200241110-00003. [DOI] [PubMed] [Google Scholar]
- 43.Deurenberg P, Weststrate JA, Seidell JC. Body mass index as a measure of body fatness: age- and sex-specific prediction formulas. Br J Nutr. 1991;65(2):105–114. doi: 10.1079/BJN19910073. [DOI] [PubMed] [Google Scholar]
- 44.D'Argenio D, Schumitzky A. ADAPT II user’s guide. Pharmacokinetic/Pharmacodynamic Systems Analysis Software. Los Angeles: Biomedical Simulations Resource; 1997. [Google Scholar]
- 45.Pilari S, Huisinga W. Lumping of physiologically-based pharmacokinetic models and a mechanistic derivation of classical compartmental models. J Pharmacokinet Pharmacodyn. 2010;37(4):365–405. doi: 10.1007/s10928-010-9165-1. [DOI] [PubMed] [Google Scholar]
- 46.Wilkinson GR, Shand DG. Commentary: a physiological approach to hepatic drug clearance. Clin Pharmacol Ther. 1975;18(4):377–390. doi: 10.1002/cpt1975184377. [DOI] [PubMed] [Google Scholar]
- 47.Capron A, Lerut J, Latinne D, Rahier J, Haufroid V, Wallemacq P. Correlation of tacrolimus levels in peripheral blood mononuclear cells with histological staging of rejection after liver transplantation: preliminary results of a prospective study. Transpl Int. 2011;25(1):41–47. doi: 10.1111/j.1432-2277.2011.01365.x. [DOI] [PubMed] [Google Scholar]
- 48.Fukatsu S, Yano I, Igarashi T, Hashida T, Takayanagi K, Saito H, et al. Population pharmacokinetics of tacrolimus in adult recipients receiving living-donor liver transplantation. Eur J Clin Pharmacol. 2001;57(6–7):479–484. doi: 10.1007/s002280100331. [DOI] [PubMed] [Google Scholar]
- 49.Provenzani A, Notarbartolo M, Labbozzetta M, Poma P, Vizzini G, Salis P, et al. Influence of CYP3A5 and ABCB1 gene polymorphisms and other factors on tacrolimus dosing in Caucasian liver and kidney transplant patients. Int J Mol Med. 2011;28(6):1093–1102. doi: 10.3892/ijmm.2011.794. [DOI] [PubMed] [Google Scholar]
- 50.Li D, Lu W, Zhu JY, Gao J, Lou YQ, Zhang GL. Population pharmacokinetics of tacrolimus and CYP3A5, MDR1 and IL-10 polymorphisms in adult liver transplant patients. J Clin Pharm Ther. 2007;32(5):505–515. doi: 10.1111/j.1365-2710.2007.00850.x. [DOI] [PubMed] [Google Scholar]
- 51.Fukudo M, Yano I, Yoshimura A, Masuda S, Uesugi M, Hosohata K, et al. Impact of MDR1 and CYP3A5 on the oral clearance of tacrolimus and tacrolimus-related renal dysfunction in adult living-donor liver transplant patients. Pharmacogenet Genomics. 2008;18(5):413–423. doi: 10.1097/FPC.0b013e3282f9ac01. [DOI] [PubMed] [Google Scholar]
- 52.Shimada T, Terada A, Yokogawa K, Kaneko H, Nomura M, Kaji K, et al. Lowered blood concentration of tacrolimus and its recovery with changes in expression of CYP3A and P-glycoprotein after high-dose steroid therapy. Transplantation. 2002;74(10):1419–1424. doi: 10.1097/00007890-200211270-00014. [DOI] [PubMed] [Google Scholar]
- 53.Kuypers DR, Claes K, Evenepoel P, Maes B, Coosemans W, Pirenne J, et al. Time-related clinical determinants of long-term tacrolimus pharmacokinetics in combination therapy with mycophenolic acid and corticosteroids: a prospective study in one hundred de novo renal transplant recipients. Clin Pharmacokinet. 2004;43(11):741–762. doi: 10.2165/00003088-200443110-00005. [DOI] [PubMed] [Google Scholar]
- 54.Zahir H, McCaughan G, Gleeson M, Nand RA, McLachlan AJ. Factors affecting variability in distribution of tacrolimus in liver transplant recipients. Br J Clin Pharmacol. 2004;57(3):298–309. doi: 10.1046/j.1365-2125.2003.02008.x. [DOI] [PMC free article] [PubMed] [Google Scholar]
- 55.Burns AM, Shelly MP, Walker S, Park GR. Serum acute phase proteins after orthotopic liver transplantation. Br J Anaesth. 1990;65(3):418–420. doi: 10.1093/bja/65.3.418. [DOI] [PubMed] [Google Scholar]
- 56.Abu-Elmagd K, Fung JJ, Alessiani M, Jain A, Venkataramanan R, Warty VS, et al. The effect of graft function on FK506 plasma levels, dosages, and renal function, with particular reference to the liver. Transplantation. 1991;52(1):71–77. doi: 10.1097/00007890-199107000-00015. [DOI] [PMC free article] [PubMed] [Google Scholar]
- 57.Jain AB, Abu-Elmagd K, Abdallah H, Warty V, Fung J, Todo S, et al. Pharmacokinetics of FK506 in liver transplant recipients after continuous intravenous infusion. J Clin Pharmacol. 1993;33(7):606–611. doi: 10.1002/j.1552-4604.1993.tb04712.x. [DOI] [PMC free article] [PubMed] [Google Scholar]
- 58.Winkler M, Ringe B, Rodeck B, Melter M, Stoll K, Baumann J, et al. The use of plasma levels for FK 506 dosing in liver-grafted patients. Transpl Int. 1994;7(5):329–333. doi: 10.1111/j.1432-2277.1994.tb01242.x. [DOI] [PubMed] [Google Scholar]
- 59.Arroyo M, Rocandio AM, Ansotegui L, Herrera H, Salces I, Rebato E. Comparison of predicted body fat percentage from anthropometric methods and from impedance in university students. Br J Nutr. 2004;92(5):827–832. doi: 10.1079/BJN20041273. [DOI] [PubMed] [Google Scholar]
- 60.VIDAL. PROGRAF® Gélules [database on the Internet]. 2012 [cited 03/08/2012]. Available from: http://www.vidalpro.net/medicaments/front/recherchemedic.asp?site=2&cartouche=17&id=41863&lib=PROGRAF+1+mg+g%E9l+%3A+Plq%2F50&type=spe.
- 61.Thervet E, Loriot MA, Barbier S, Buchler M, Ficheux M, Choukroun G, et al. Optimization of initial tacrolimus dose using pharmacogenetic testing. Clin Pharmacol Ther. 2010;87(6):721–726. doi: 10.1038/clpt.2010.17. [DOI] [PubMed] [Google Scholar]
Associated Data
This section collects any data citations, data availability statements, or supplementary materials included in this article.
Supplementary Materials
Normalized concentration–time profiles of tacrolimus in the 13 compartments of the full PBPK model. (JPEG 6 kb)
Time–concentration curve profiles of a representative patient. The squares are the measured tacrolimus concentrations in whole blood. The line is the fitted lumped PBPK model. (JPEG 7 kb)