Abstract
Extracellular electric fields existing throughout the living brain affect the neural coding and information processing via ephaptic transmission, independent of synapses. A two-compartment whole field effect model (WFEM) of pyramidal neurons embedded within a resistive array which simulates the extracellular medium i.e. ephapse is developed to study the effects of electric field on neuronal behaviors. We derive the two linearized filed effect models (LFEM-1 and LFEM-2) from WFEM at the stable resting state. Through matching these simplified models to the subthreshold membrane response in experiments of the resting pyramidal cells exposed to applied electric fields, we not only verify our proposed model’s validity but also found the key parameters which dominate subthreshold frequency response characteristic. Moreover, we find and give its underlying biophysical mechanism that the unsymmetrical properties of active ion channels results in the very different low-frequency response of somatic and dendritic compartments. Following, WFEM is used to investigate both direct-current (DC) and alternating-current field effect on the neural firing patterns by bifurcation analyses. We present that DC electric field could modulate neuronal excitability, with the positive field improving the excitability, the modest negative field suppressing the excitability, but interestingly, the larger negative field re-exciting the neuron back into spiking behavior. The neuron exposed to the sinusoidal electric field exhibits abundant firing patterns sensitive to the input frequency and intensity. In addition, the electrical properties of ephapse can modulate the efficacy of field effect. Our simulated results are qualitatively in line with the relevant experimental results and can explain some experimental phenomena. Furthermore, they are helpful to provide the predictions which can be tested in future experiments.
Keywords: Field effect, Ephaptic transmission, Subthreshold, Extracellular electric field, Firing pattern
Introduction
The effects of extremely low frequency (ELF) environmental electromagnetic field on human health have gained much attention. Exposed to environmental electromagnetic field, neural electrical activities in brain are affected by the induced electric fields both from internal and external environments (Partsvania et al. 2008; Rubin and Terman 2004; Bernhardt 1979). It is believed that ELF electromagnetic field has a potential regulatory role both in normal and pathological brain states (Radman et al. 2007; Schaefer et al. 2006; Marshall et al. 2006; Francis et al. 2003; Jefferys et al. 2003; de Ruyter et al. 1997; Yi et al. 2013), and specifically, the fields are effective for the therapy of neurological diseases including epilepsy, Parkinson’s disease (PD) and depression (Sandrini et al. 2011; Daskalakis et al. 2008; Bikson et al. 2004; Klimesch et al. 2003; Durand and Bikson 2001; Eichwald and Kaiser 1995). Transcranial magnetic stimulation (TMS) is a new noninvasive and painless therapy for epilepsy and depression, which can enhance cognitive performance by influencing the dynamics of alpha desynchronization (Klimesch et al. 2003; Casarotto et al. 2010; Martin et al. 2009). Deep brain stimulation (DBS) has provided remarkable therapeutic benefits for otherwise treatment-resistant movement and affective disorders such as chronic pain, Parkinson’s disease, tremor and dystonia (Kringelbach et al. 2007; Gildenberg 2005; Krishnamurthi et al. 2012). Also many previous experimental studies have revealed that electric field modulation can improve the cerebral cortex neurons oversynchronous firing, suppress the epileptiform activity and affect neuronal excitability (Bikson et al. 2004; Durand and Bikson 2001; Durand 2003; Ghai et al. 2000; Gluckman et al. 1996). These pioneering experiments demonstrated that the neural excitability can be modulated in some extent by the extracellular electric field induced by either applied electromagnetic fields or endogenous electric activities. Thus, it is significant to study the dynamics of neurons in the presence of electric fields.
From the microscopic electrical point of view, brain is a complex volume conductor constituted by numerous cells filled with conductive medium. The exogenous and endogenous induced electric fields are added in neurons and alter the internal activities via extracellular medium. The interaction of electrical activity via the electrical properties of extracellular medium, independent of the synapse, is named “ephaptic transmission” or field effect, that is to say, ephaptic transmission is the interaction process between extracellular and intracellular electrical signals (Anastassiou et al. 2011; Dudek et al. 1998; Jefferys 1995). The synaptic transmission, as the dominant communication among neurons, has been widely researched and the ephaptic transmission is commonly ignored in most researches (Du et al. 2012; Wang and Zhang 2007; Meng et al. 2013; Gerstner and Kistler 2002). However, some evidences indicate that electric field effects may induce the epileptiform activity propagating in granule cells and pyramidal cells of the hippocampus after active chemical synaptic transmission has been blocked (Schweitzer et al. 1992; Yaari et al. 1983; Macvicar and Dudek 1981). Under certain conditions an action potential can be induced in an inactive axon by a nearby one (Holt and Koch 1999). For example, the Mauthner cells (M-cells) are a pair of big and easily identifiable neurons (one for each half of the body) located in the rhombomere 4 of the hindbrain in teleost fish that are responsible for a very fast escape reflex (a so-called C-start response). The C-start escape behavior initiated by the rapid inhibition of one M-cell has been demonstrated to be related to a specialized region called the axon cap in M-cell, with an extracellular volume resistivity that is approximately ninefold greater than the surrounding medium, which results the very strong ephaptic coupling between the M-cell and the inhibitory interneuron (Furukawa and Furshpan 1963). However, the mechanisms of ephaptic transmission are still unclear and how much the electric field is sufficient to modulate activity of individual neurons ephaptically has not been easy to address because of the difficulty of testing apart ephaptic effects from synaptic ones.
Therefore, modeling electric field effect of neurons is particularly significant to study those mechanisms. Although the simplified single-compartment models of neurons are often used to investigate their dynamics exposed to applied electric field stimulus which are simply regarded as the current directly injected into the soma or a potential fluctuation on the cell membrane (Njap et al. 2012; Schutt and Claussen 2012; Yu et al. 2013), some major effects of extracellular electric fields such as spatial polarization in pyramidal neurons could not be reflected by these models (Durand 2003), where ephaptic transmission has never been considered and extracellular space is assumed to be isopotential. To simulate this spatial polarization of neuron exposed to extracellular electric field, the minimal individual neuronal unit must have at least two spatially separated compartments. Several researchers have developed neuron dynamic model in which the conductive extracellular medium was considered, to study the effects of applied electric fields on neuronal synchronization and spike timing (Anastassiou et al. 2010; Park et al. 2005). However, there so far have less detailed researches about the dynamical mechanism of neuronal activities under the ephaptic transmission. Thus, we focus on ephaptic transmission to study extracellular field effects on neural activities with respect to firing patterns detailedly and systematacially in a two-compartment model embedded in a resistive array.
Pyramidal cells are distributed parallelly in hippocampal CA3 region that is beneficial for the electric field modulation. We use the parallel orientation of the external electric field with the somato-dendritic axis in our two-compartment resistive array model. The resistive characteristic is an important feature of our model which represents the conductive extracellular medium in which the neurons are embedded. Therefore, an applied electric potential parallel to somato-dendritic axis simulates electrodes placed on the brain for the application of electric fields and for the measurement of extracellular local differential voltages.
The organization of the paper is arranged as following. In “Methods and models” section, a two-compartment hippocampal pyramidal neuron model in the presence of electric field is constructed under the ephaptic transmission and its analysis and validation is shown with different frequency extracellular electric fields. Simulation results and the dynamic analysis are given in “Extracellular DC electric field effects with three different important electronic parameters” and “Extracellular AC electric field effects” sections under direct-current (DC) and alternating-current (AC) extracellular electric field respectively. Neuronal firing properties are studied in a variety of three important electronic parameters in the presence of DC electric field. The sensitivity of neuronal firing patterns to extracellular AC electric field frequency and amplitude is investigated. The neuronal sensitivity for the electric field, modulating by the ephapse, is also analyzed. Finally, we make some discussion on effects of electric field on neural tissue under ephaptic transmission.
Methods and models
Model of the field effect on a two-compartment neuron
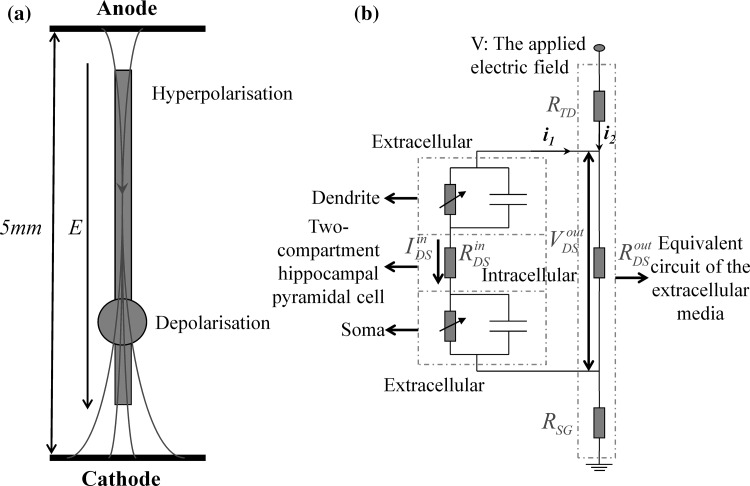
Because the individual pyramidal cells are aligned such that adjacent cells have parallel dendrites, which favor interaction with fields aligned along the collective soma-to-dendritic axes, the spatially uniform electric fields were applied to hippocampal slices with varying frequencies and amplitudes by passing current between two large parallel Ag–AgCl electrodes submerged in the artificial cerebrospinal fluid (ACSF) in most field effect experiments. (Durand 2003; Ghai et al. 2000; Reato et al. 2010; Deans et al. 2007). The schematic diagram of the uniform electric field with the orientation parallel to the somatic-dentritic axis of a single pyramidal cell is shown in Fig. 1a. Neurons are important for information processing in the brain. However, such integrative processes do not occur in a vacuum. Instead, neurons are located in a conductive extracellular medium i.e. the ephapse. As shown in Fig. 1a, the extracellular electric field alters the neural activities by the current flow inside and outside the cell between the anode and cathode, which induces spatial polarization in neurons (Durand and Bikson 2001; Durand 2003; Park et al. 2005; Tranchina and Nicholson 1986), and therefore, the minimal individual neuronal unit must have at least two spatially separated compartments. We therefore chose the two-compartment Pinsky–Rinzel (PR) model neuron, which consists of a dendrite and a soma compartment separated by a coupling conductance gc (Pinsky and Rinzel 1994). Considering the conductive properties of the extracellular medium which can be described as a resistance array under the electric field with the lower frequency (<300 Hz), we established an equivalent model of the electric fields effect (Fig. 1a) on a two-compartment single neuron embedded within a resistive array consisting of RTD, RoutDS, and RSG to model the ephapse, as shown in Fig. 1b. It would be noted that the applied externally electric field is modeled by imposing an extracellular voltage difference V between the top and the ground in Fig. 1b. Furthermore, we assume that the orientation of the extracellular electric field is parallel to the somatic-dendritic axis for the current research. To facilitate the following description, here we give the abbreviation “WFEM” for whole field effect model of a two-compartment pyramidal cell, which are detailed presented in “Appendix”.
Fig. 1.
The two-compartment electric field effects model under the ephaptic transmission. a The schematic diagram of a single hippocampal pyramidal neuron in uniform electric field generated by two wire electrodes. An anode is located close to the apical dendrites and the cathode close to the soma and basilar dendrites. Current enters the apical dendrites, generating membrane hyperpolarization, and leaves the cell in the somatic and basilar region, generating membrane depolarization. With the conversion of cathode and anode, the current direction is reversed, generating hyperpolarization in the soma and depolarization in the apical dendrites respectively. b An equivalent model of the electric fields effect on a two-compartment single neuron embedded within a resistive array modeling the extracellular medium i.e. the ephaptic transmission. Here we define the three currents i 1, i 2 and I inDS with the reference positive direction shown in this figure, which are detailed described and used in “Appendix”
After the construction of the ephaptic transmission model, we investigate neuronal dynamics in terms of neuronal firing properties by modulating the applied potential difference V and adjusting three electronic parameters including the coupling conductance gc, the reversal potential of potassium ion VK and the extracellular resistance RoutDS. Numerical simulations are performed in a standard procedure: a 4th order Runge–Kutta algorithm with a fixed integration time step in MATLAB.
Corresponding relation of the extracellular voltage difference V and applied externally electric field E
Our resistive array model can be supposed to be a morphologic model of a hippocampal pyramidal cell placed between two uniform field-generating Ag–AgCl parallel plate electrodes. According to the distance of about 5 mm between the two electrodes in some experiments (Reato et al. 2010; Deans et al. 2007), we can get the ratio among the extracellular resistances in the normal condition of homogeneous medium in Table 1 in terms of the whole length of about 200 μm for a single pyramidal cell, where r is the ratio of RoutDS/RinDS with the standard value 0.1 in “Appendix” and  with the total membrane area A about 6 × 10⁻⁶ cm2 (Park et al. 2005). Therefore, in the present model, the relation of electric potential difference V and applied field intensity E between the two parallel electrodes in Fig. 1a can be described as
 |
1 |
where d = 5 mm is the distance of two parallel wire electrodes. This linear relation should provide an intuition as to the effective strength of the field on a single-neuron level. To facilitate the description of our proposed model in Fig. 1, in following paper, we use the equivalent voltage difference V between the two parallel electrodes to represent the applied electric field intensity. When the voltage difference V varies from −600 to 600 mV, the corresponding electric field changes in the range of −120 to 120 (mV/mm).
Table 1.
The extracellular resistance values (Park et al. 2005)
| Resistances between | Ratio of resistances |
|---|---|
| Dendrite and soma | R outDS = r × R inDS |
| Top plate and dendrite | R TD = 12 × R outDS |
| Soma and ground | R SG = 12 × R outDS |
The strength of the electric field is comparable to fields applied in cells by extracellular electrodes in the brain slices experiments (Chan et al. 1988; Chan and Nicholson 1986; Bawin et al. 1984; Jefferys 1981). The applied electric fields affect the neuronal activity via the induced voltage VoutDS directly adding to the neuron. As the main component,  is the steady DC component of the induced voltage VoutDS corresponding to the applied electric field. In order to explore the efficiency of the applied field effects on the neuron, the relationship between
  and V is investigated. The ranges of
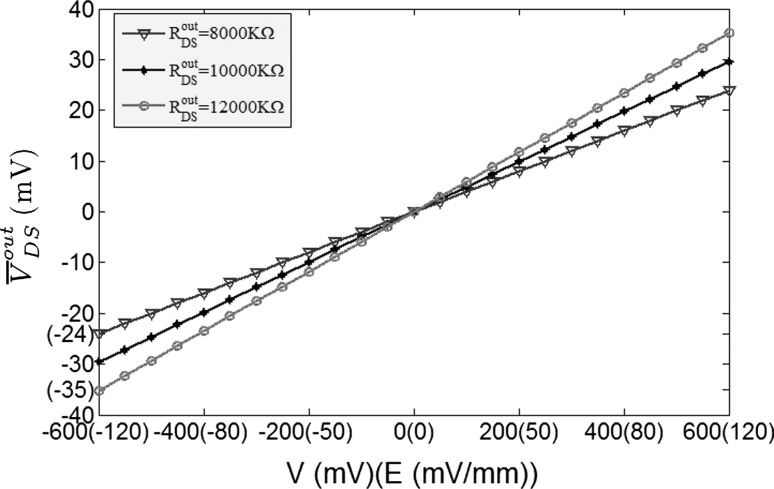
  response to the electric field for three different extracellular resistances RoutDS are shown in Fig. 2. It is obvious that the relationship between the applied field and the response voltage
  is linear. Three lines with different slopes reveal that the incremental extracellular resistance RoutDS could enhance the applied field effects by improving the induced voltage VoutDS across the neuron.
Fig. 2.
The steady DC component of the induced voltage ( ) response to the applied extracellular electric field is plotted in different extracellular resistances R
outDS = 8,000, 10,000, 12,000 (KΩ). The voltage difference V varying from −600 to 600 mV correspond to the range of electric field magnitudes
Subthreshold frequency response characteristic analysis and model verification
The extracellular field effect model should be tested and verified through comparisons with other theoretical models and experimental data. As the validity of PR model has been evaluated by Pinsky and Rinzel (1994) in their studies, the extracellular field effect under the ephaptic transmission is the major consideration in this section. Recent researches implicate that the generation of action potentials is heavily dependent on the dynamic activity of the subthreshold membrane potential i.e. the biological physical mechanism of nerve excitability (Xie et al. 2004). Deans et al. (2007) explored the sensitivity of brain tissue to the weak extracellular electric fields in adult male Sprague–Dawley rats. In their experiments, field-induced changes in membrane potential are measured to characterize the passive electrical properties of the neurons. Here, we explore the passive electrical properties of the neurons in our ephaptic model by studying the subthreshold response of membrane potential to the applied electric field at the resting state. Applying various frequency electric fields, the changes of the membrane potential are discussed.
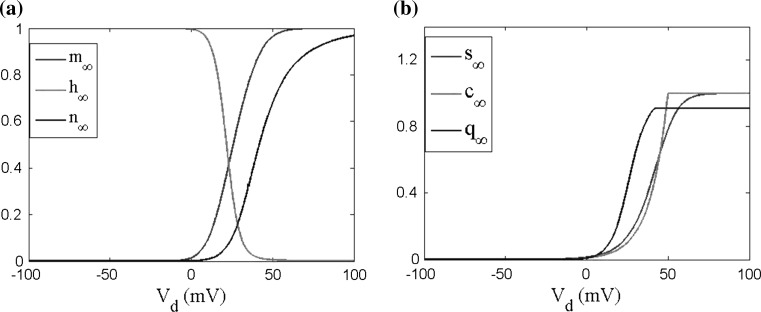
To achieve the silent state neuron, the transmembrane potential is normally set to be −80 to −70 mV in experiments. To simulate the experiment condition, according to the reference potential −60 mV used in our proposed two-compartment field effect model in “Appendix”, the resting potential in our model should be hold as −20 to −10 mV which exactly corresponds to −80 to −70 mV. It is obvious that all of the ion channel activation variables exhibit a very small value, but instead the ion channel inactivation variable value approximates to one in Fig. 3. For the research of the membrane potential subthreshold oscillation, we set the injected currents Id = −1 μA/cm2 into the dendrite to keep somatic and dendritic membrane potentials resting at about −10 mV. In the following, we will study the subthreshold response of a pyramidal cell at the resting state according to the following three field effect models including WFEM including nonlinear active ion channels (Eqs. 8–10 in “Appendix”) and the two linearized models deduced from the WFEM.
Fig. 3.
The ion channels activation and inactivation variables in different membrane potentials. V s and V d are the somatic and dendritic membrane potentials from a reference potential of −60 mV a for soma and b for dendrite. m is Na + channel (I Na) activation gated variable; h is Na + channel (I Na) inactivation gated variable; n is K + channel (I KDR) activation gated variable; s is Ca 2+ channel (I Ca) activation gated variable; c is Ca 2+ activated K + (I KC) activation; q is K + AHP channel (I KAHP) activation gated variable
The linearized field effect model by eliminating the active ion channels (K+, Na+ and Ca2+): LFEM-1
Due to the ion channels almost have no activity in the resting state, firstly we ignore the active ion channels in our model and only consider the passive properties of membrane. Then the linearized model LFEM-1 of WFEM can be acquired by only remaining the passive leakage conductance, just described as the following
 |
2 |
To unify the unit, the extracellular resistances are converted to the form of conductance. So VoutDS could be expressed by
 |
3 |
From the expressions (2) and (3), we can get the transfer function of the linear system with the extracellular electric field as input and the change of the somatic membrane as output, by the simplification and Laplace transform. The transfer function can be shown as following:
 |
4 |
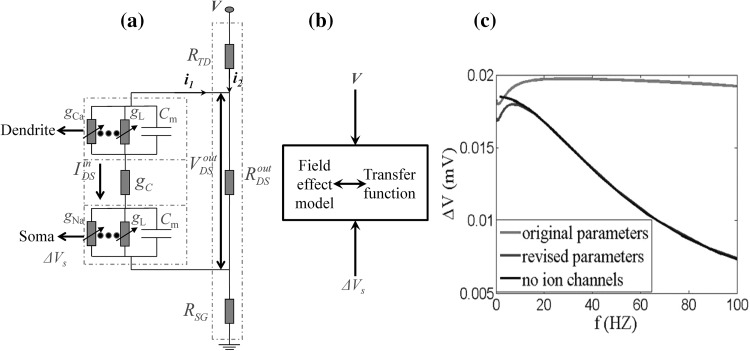
From the system transfer function, we can find that it is equivalent to a first-order system by a pole-zero cancellation. This may be explained for the symmetry of the two compartments in circuits. Thus, it is in line with the characteristic of first-order system, which is amplitude attenuation with increasing frequency (Fig. 4c, black line). The amplitude-frequency characteristic can be modulated by a time constant τ and here τ = Cm/[gL + 100gc/(25 + 24r)] (Cm is the membrane capacitance and gL is the leaking conductance). We expected that the input–output frequency response characteristic of LFEM-1 (in Eq. 2) could match the reported experimental data in rat hippocampus (Reato et al. 2010; Deans et al. 2007). However, no matter how to adjust these key parameters, the peak point cannot be obtained in this linearized model while there exists a peak one at approximate 7 Hz in the amplitude-frequency curve in the corresponding experiments (Reato et al. 2010; Deans et al. 2007), which may be the result of the excessive linearized processing by eliminating all the active ion channels in LFEM-1. In fact, although the active ion channels are not fully activated by subthreshold electric field during the resting state, their elaborate activities could affect the input–output response characteristic of a cell.
Fig. 4.
The structure of LFEM-2 in Eqs. (5) and (6) and the input–output frequency response characteristic comparison between LFEM-2 and LFEM-1 in Eqs. (2–4). a The structure of LFEM-2 with linearization of the ion channels in circuit level. b The system diagram in transfer function with the extracellular electric field as input and the change of the somatic membrane as output. c The comparison of three amplitude-frequency curves. The red line denotes LFEM-2 with the original parameters (C m = 3 μF/cm2, g c = 2.1 mS/cm2, r = 0.1). The blue line denotes LFEM-2 with the revised parameters (C m = 5 μF/cm2, g c = 2.1 mS/cm2, r = 6). The black line refers to LFEM-1 mentioned above, only considering the passive properties of the membrane. All these results are obtained with I d = −1 μA/cm2. (Color figure online)
The linearized field effect model in the vicinity of the resting state (considering all linearized active ion channels including K+, Na+ and Ca2+): LFEM-2
As the above analysis, we do not excessively ignore the effect of the subthreshold activities of the active ion channels in WFEM in “Appendix”. So we simply the two-compartment field effect model (Eqs. 8–10 in “Appendix”) by linearizing the active ion channels near the stable equilibrium point (i.e. resting state). The equilibrium point is given by the vector EP in “Appendix”. Then the linearized field effect model LFEM-2 with all the linearized ion channels including K+, Na+ and Ca2+, shown in Fig. 4a, is an eight-order linear system which could be achieved in the following form of state space.
 |
5 |
Here, x is state variable, including eight state variables, Vs, Vd, h, n, s, c, q, Ca respectively. The input variable u is the extracellular electric field V and the output variable y is the change of the somatic membrane ΔVs. A denotes the Jacobian matrix, B is input matrix, C is output matrix, and D is feedforward matrix. The values of matrixes are given in “Appendix”. The numerical results are simulated by MATLAB. Thus, the system transfer function could be obtained by the following formula (Fig. 4b):
 |
6 |
In this case, it is a high order system and its characteristics are very similar to the experimental data. A better match to experimental data could be observed by the parameters regulation. With the original parameters, the low-pass characteristics are exhibited indistinctly in Fig. 4c with red line, in which amplitude decays slowly with increasing frequency. However, some model parameters could be adjusted to match the experimental data better where there is a peak at the frequency about 7 Hz in amplitude-frequency response characteristic (Reato et al. 2010; Deans et al. 2007). There are three key parameters, membrane capacitance Cm, coupling conductance gc, and the ratio r of RoutDS/RinDS. In the process of parameters adjustment, we find that Cm and gc primarily affect the peak frequency and r mainly affect the decay rate of the amplitude. Then the above linearized field effect model help us to obtain the key parameters which dominate the subthreshold frequency response characteristic. Moreover, we can adjust these key parameters to match experimental data of the subthreshold electric field effect.
The whole two-compartment electric field effect model (considering all nonlinear active ion channels including K+, Na+ and Ca2+): WFEM
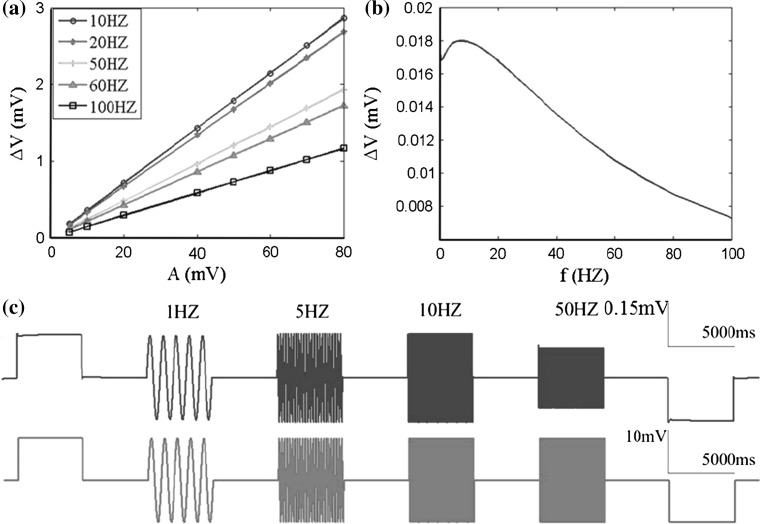
Following, we will numerically simulate the input–output frequency response characteristic of WFEM with the adjusted key parameters matching the corresponding experimental data, just as presented in Fig. 5. The somatic subthreshold membrane oscillations responding to the applied electric field are shown in Fig. 5c, where the responsive frequency is in agreement with the electric field frequency. As a function of the applied AC electric field intensity, the somatic membrane potential reveals a approximately linear relationship over the whole range of applied electric field intensity used here with five frequencies from 10 to 100 Hz (see Fig. 5a). Figure 5b suggests that the membrane potential changes in every millivolt applied electric field (normalized membrane potential changes) vary with frequency in a non-monotonic way, and there is a maximum value at a low frequency about 7 Hz, and then the normalized values decay gradually with the increasing frequency. Compared with Fig. 4b, it can be found that the input–output frequency response characteristic of WFEM matches very well with both LFEM-2 and the corresponding experimental data in (Reato et al. 2010; Deans et al. 2007).
Fig. 5.
Effect of applied electric fields on neuronal membrane potential in subthreshold oscillation based on the WFEM shown in Eqs. (8–10) in “Appendix”. a Membrane potential as a function of applied field strength in different frequencies. b The normalized membrane potential changes versus applied field frequency i.e. the change of membrane potential per unit of applied electric field V. c Somatic membrane potential responses to the applied electric fields (10 mV) including positive (excitatory, left), negative (inhibitory, right) DC fields which polarity has been defined in Fig. 1 and 1, 5, 10, 50 Hz of AC fields, the red line at the bottom denotes the applied fields VE and the blue line at the top denotes the membrane potential responses. The results are obtained with C m = 5 μF/cm2, g c = 2.1 mS/cm2, r = 6, I d = −1 μA/cm2. (Color figure online)
Difference of subthreshold response properties of the soma with the dendrite and its biophysical mechanism
We have discussed the subthreshold frequency response characteristic of soma compartment of pyramidal cell exposed to electric field. In fact, the band-pass phenomenon reflects the neuron’s intrinsic property-frequency preference, which has been observed in not only soma but also dendrites of single neurons in response to synaptic inputs. Then, how the applied extracellular electric field affects the response property of the dendritic membrane potential? Similar to the somatic analysis above, we compare the subthreshold frequency response characteristic of dendrite with that of the soma in the vicinity of stable resting state.
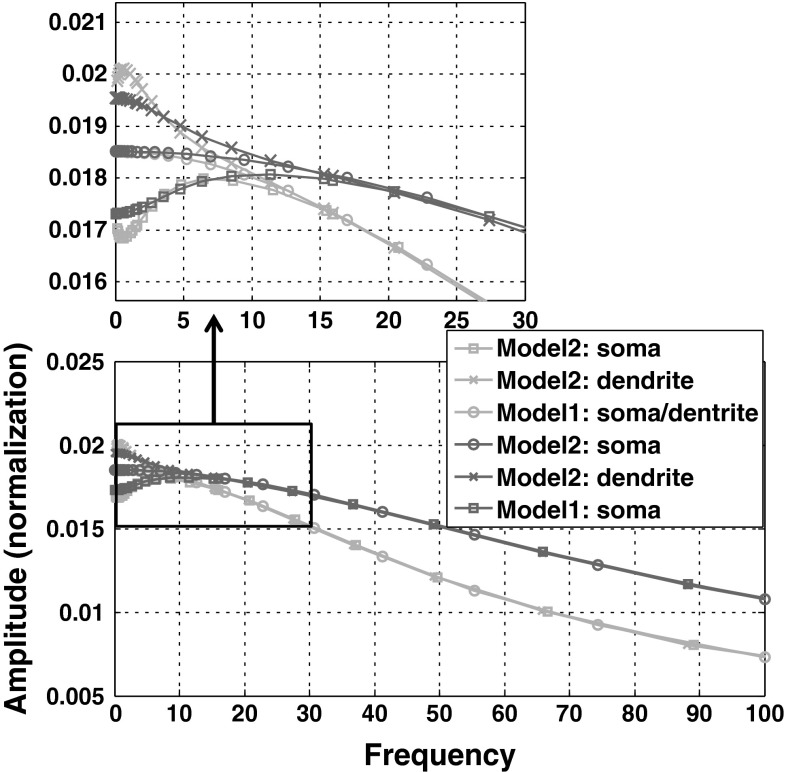
As seen from Fig. 6, the frequency response characteristics for soma and dendrite in LFEM-1 are exactly the same curve owing to the symmetrical passive properties of soma and dendrite. And LFEM-2 has the almost same high frequency somatic and dendritic responses with LFEM-1 except for the main differences in the low frequency band (<20 Hz), which suggests that LFEM-1, the simplest linearized one of WFEM, can be used to predict the frequency bandwidth and high frequency gain of the subthreshold response of cell in the vicinity of the stable resting state. As described in Eq. (2) in “The linearized field effect model by eliminating the active ion channels (K+, Na+ and Ca2+): LFEM-1” section, the key parameters i.e. the membrane capacitance Cm and the ratio r between RoutDS/RinDS can adjust the frequency bandwidth and the response gain, respectively. Here, we give the simulated results for adjustment of Cm shown in the red (Cm = 5) and blue (Cm = 3) lines respectively in Fig. 6, where if Cm tiny decreasing, the bandwidth will increase significant, which can be directly understood from the band-pass biophysical properties of cell. And with the increased r which biophysically means the enhanced sensitivity of cell for extracellular electric field (seen in Fig. 2), the membrane response gain will increase (here is not shown).
Fig. 6.
Comparison of the subthreshold response between the somatic and dendritic compartments of LFEM-1 and LFEM-2 exposed to extracellular electric field stimulus. M1, M2 refer to LFEM-1 and LFEM-2. Here is the two parameter sets: one is for the red lines (C m = 5 μF/cm2, g c = 2.1 mS/cm2, r = 6) which have been described in Fig. 4c; another is for the green lines (C m = 3 μF/cm2, g c = 2.1 mS/cm2, r = 6). I d = −1 μA/cm2 is applied into two cases. (Color figure online)
Moreover, the biophysical mechanism of those high frequency response properties is that the active ion channels difficultly response to the high frequency membrane fluctuations owing to their intrinsic hysteresis properties (the relatively slow dynamics with large time constant), which make the two models i.e. LFEM1 and LFEM2 can be equivalent for the high frequency bands. However, the active ion channels can relative strongly response to lower frequency stimulus, which enable the active ion channels to involve in shaping the cellular input–output response properties in low-frequency band. As the result of the diverse ion channels with the unsymmetrical intrinsic properties in somatic and dendritic compartments, their membrane response characteristics will diverge from each other for the lower frequency stimulus, just as shown in Fig. 6. There are the excitatory Na channel and inhibitory KDR channel in somatic membrane while the excitatory Ca channel and inhibitory KAHP and KC channels in dendritic membrane. Because the activity of the short-term calcium-dependent KC current are far weaker than that of the long-term calcium-dependent KAHP current during the resting state (seen in the parameters in “Appendix”), we can only consider Ca channel and KAHP channel in dendritic membrane. In addition, the Na channel in soma has the weaker activities than the KDR channel while the Ca channel in dendrite has the stronger activities than KAHP channel during the cellular resting state. Owing to these rather unsymmetrical subthreshold competition between excitatory and inhibitory currents in these two compartments, compared with LFEM-1 without the active ion channels, the somatic response curve of LFEM-2 in the low-frequency band drops down while the dendritic one upturns. Once the activities of both excitatory and inhibitory ion channels decay with the gradually increased frequency, the response competition of two compartments gradually tend to equivalent and then the two separated response curves will move close to each other, eventually almost overlapping on that of LFEM-1.
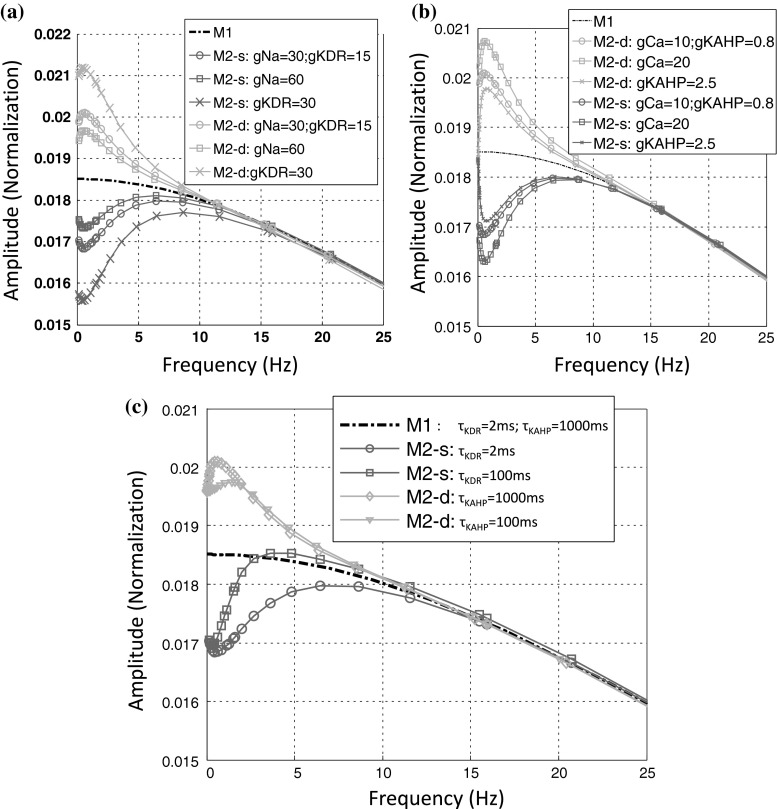
Next, we change the key dynamical parameters of these ion channels including maximum conductance (gNa, gKDR, gCa, and gKAHP) and time-constants of KDR and KAHP channels (τKDR and τKAHP) to verify the above biophysical mechanism. From the results shown in Fig. 7a, b, same as we expected, increasing excitatory conductance both in soma and in dendrite could enhance their respective response in the low-frequency bands while increasing inhibitory conductance could weaken them. Furthermore, it can be seen in Figs. 7a, b and 6 that all the peak frequency in soma is a bit larger than that in the dendrite, which can be biophysically explained as the results of the very different time scale of inhibitory channels’ dynamics in soma (KDR) and dendrite (KAHP). The fast KDR channel could induce the even stronger inhibition with the gradually increasing frequency than the slow KAHP channel and then the peak point in soma will reach at the higher frequency. Just as presented in Fig. 7c, changing the two time-constants can fine-tune the peak frequency of response curve in the low frequency band and in fact this adjustment could not realize the arbitrary assignment of peak frequency which is largely restricted by the band-width of the frequency response.
Fig. 7.
Subthreshold response properties of LFEM-1 and LFEM-2 in low-frequency bands with the different parameters of active ion channels. s soma, d dendrite. The normal parameters are set with g Na = 30; g KDR = 15; g Ca = 10; g KAHP = 0.8 and other parameters are set in “Appendix”. Only one parameter changes in every response curve. a Varying g Na and g KDR of somatic compartment; b varying g Ca and g KAHP of dendritic compartment; c varying the time-constants of KDR and KAHP channels i.e. τ KDR and τ KAHP. Note: the normal values of τ KDR (2 ms) and τ KAHP (1,000 ms) are achieved at the somatic resting state with about −10 mV
In a word, LFEM-1, the simplest linearized electric field model of WFEM, can be used to analyse and predict the bandwidth and high-frequency gain of the subthreshold response of neuron exposed to the applied electric field at the stable resting state. With the subthreshold response matching WFEM very well not only in high-frequency bands but also in low-frequency ones, LFEM-2, as the moderate linearized electric field model of WFEM, can be utilized to analyse and predict the subthreshold response properties specially in low-frequency bands sophisticatedly modulated by the subthreshold active excitatory and inhibitory ion channels. Subthreshold response analyses of LFEM-1, LFEM-2 and WFEM have the two important purposes: on the one hand, the frequency response characteristic matching to the experimental results of subthreshold electric fields can demonstrate the validity of our proposed electric field effect model; on the other hand, they help us to achieve the key parameters which dominate the subthreshold response properties and can be adjusted or estimated to build the more realistic electric field model from the experimental data.
Because LFEM-1 and LFEM-2 are suitable for studying the subthreshold electric field effect on single cell at the stable resting state rather than neuronal firing properties. Next, we will use WFEM in Eqs. (8–10) in “Appendix” to discuss the abundant firing properties of the hippocampal pyramidal cell exposed to the applied DC and AC electric fields. To facilitate description, if not specially specified, the model discussed in the following sections refers to WFEM with the standard parameters in “Appendix”. Because the generation of action potential is located in the somatic-axonal area of cell, the firing patterns in following sections are referred to the somatic compartment of pyramidal cell.
Extracellular DC electric field effects with three different important electronic parameters
The states and outputs of a system are dependent on its structure and parameters. Here the structure of our proposed field effect model is deterministic, so the variation of parameters will play a critical role in the system. Based on the standard parameter values (Tables 2, 3, 4 in “Appendix”), the firing patterns of the hippocampal pyramidal neuron exposed to the applied DC electric fields are studied over a large range of three significant electronic parameter values including the coupling conductance (coupling strength) gc, the reversal potential of potassium ion VK and the extracellular resistance between dendrite and soma RoutDS.
Table 2.
| Constant parameters | Values | Constant parameters | Values |
|---|---|---|---|
| p | 0.5 | gKDR | 15 (mS/cm2) |
| V Na | 120 (mV) | gCa | 10 (mS/cm2) |
| V Ca | 140 (mV) | g KAHP | 0.8 (mS/cm2) |
| V L | 0 (mV) | gKC | 15 (mS/cm2) |
| V syn | 60 (mV) | gNMDA | 0.03 (mS/cm2) |
| gL | 0.1 (mS/cm2) | gAMPA | 0.0045 (mS/cm2) |
| gNa | 30 (mS/cm2) | I s | 0 (μA/cm2) |
Table 3.
| Variable parameters | Standard values | Special values |
|---|---|---|
| g c | 2.1 (mS/cm2) | 5 (mS/cm2) |
| C m | 3.0 (μF/cm2) | 5.0 (μF/cm2) |
| V K | −38.56 (mV) | −15 (mV) |
| I d | 0 (μA/cm2) | −1 (μA/cm2) |
| r | 0.1 | 6 |
Table 4.
| Gate variables | α i | β i |
|---|---|---|
| m |

|

|
| h |

|

|
| n |

|

|
| s |

|

|
| c |

|

|
| q |

|

|
Coupling conductance gc
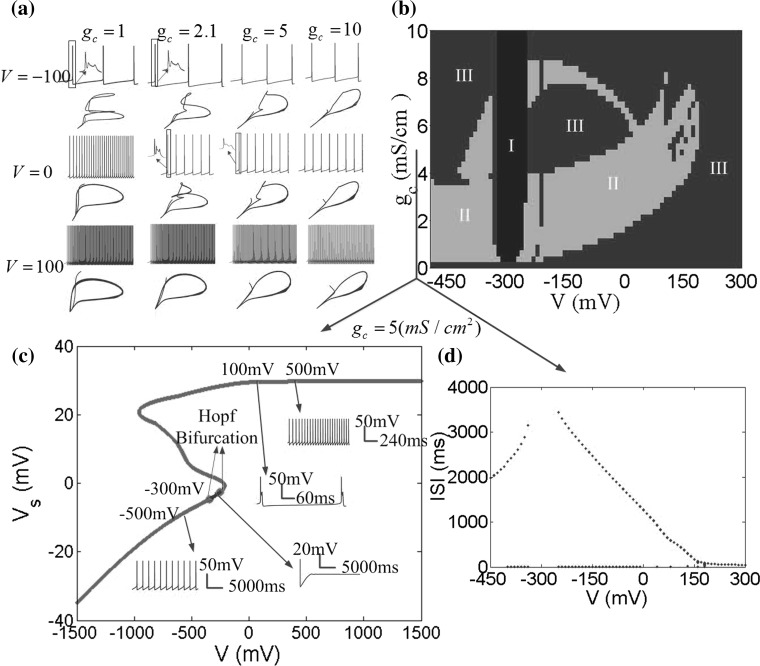
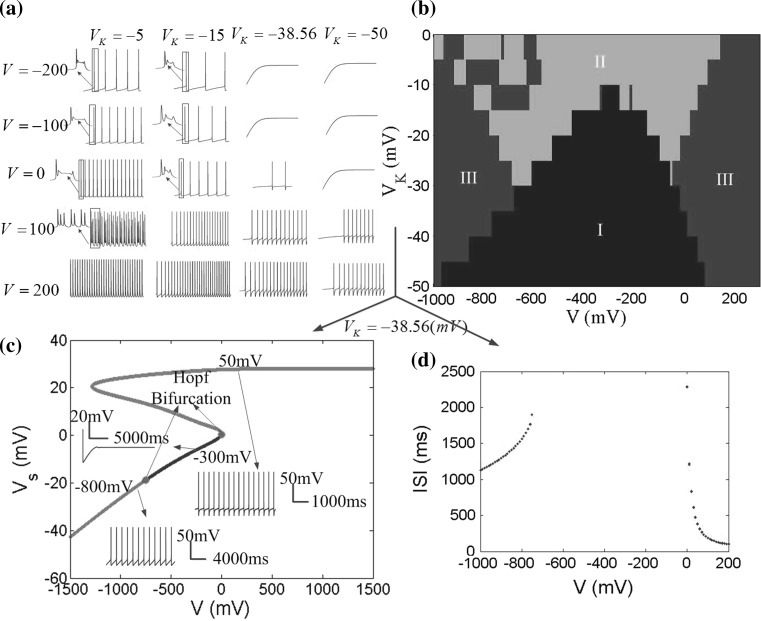
The coupling conductance gc is the only channel of the internal interactions between the soma and dendrite. Furthermore, a reasonable coupling conductance is required for the model to reflect the hippocampal pyramidal neuron authentically. When the coupling conductance varies, time courses of somatic membrane potential Vs and the phase plane between the somatic potential Vs and dendritic potential Vd in different electric fields are shown in Fig. 8a. The firing patterns are described by the different colors with two parameters changing in large ranges in Fig. 8b. In this section, in order to reveal the rich bursting of the hippocampal pyramidal neuron, the reversal potential of potassium ion is set to VK = −15 mV.
Fig. 8.
a Variety of firing patterns and the phase plane between the somatic potential V s and dendritic potential V d for different coupling conductance g c in three DC electric field V = −100, V = 0 and V = 100. b Different firing patterns in the parameter space of applied field V and the coupling conductance g c. The blue region (I) denotes no firing, the green region (II) denotes bursting, and the red region (III) denotes periodic spiking. c V s − V bifurcation diagram for g c = 5 (mS/cm2), where applied field V is considered as the bifurcation parameter. The red points refer to unstable equilibrium points and the blue points are for asymptotically stable equilibrium ones. Two green points are Hopf Bifurcation points. The bifurcation diagram is plotted with V K = −15 mV in the XPPAUT (Ermentrout 2002). d ISI (interspike interval) bifurcation diagram for g c = 5 (mS/cm2). (Color figure online)
It is obvious to find that there is a no firing region with the applied field V near −300 mV separating the firing region as two parts in Fig. 8b. When gc < 4, bursting is the dominant firing pattern with the applied electric field strengths used here, specially, in the presence of negative field. For 4 < gc < 9, the neuron exhibits various firing patterns with the increase of the applied field strength. In this range of gc, the periodic spiking and bursting are nested within each other. With 9 < gc < 10, the bursting pattern disappears, and only the periodic spiking pattern is divided into two parts by the no firing region. From the phase plane diagrams in Fig. 8a, it is found that the phase diagrams between the somatic and dendritic membrane potential are close to a line gradually with the coupling conductance increasing, that is to say, the synchronization of the two compartments enhances in the higher coupling conductance. From the above, we can draw a conclusion that when the coupling conductance gc = 2.1, two compartments of the neuron have a certain correlation rather than completely synchronization or no relation. In this case, the phase plane contains more information and the neuron has more complex dynamical behaviour that is in line with the actual characteristics of the hippocampal pyramidal neuron.
From negative to positive field, there are two Hopf bifurcation points (green in Fig. 8c). Both of the Hopf bifurcation points correspond to subcritical Hopf bifurcation with the emergence of an unstable limit cycle. In this cases, the neuron generates a regular sequence of spikes (Fig. 8c for V = −500 mV, V = 100 mV and V = 500 mV). The bursting and spiking states are not distinction in the bifurcation diagram, which lead to an identical unstable limit cycle. The blue points refer to stable equilibrium points and the somatic membrane potential reaches a fixed point (Fig. 8c for V = −300 mV). While the negative field was known as inhibitory field, Gluckman’s group discovered that larger negative field could alert two neurons from silence back to synchronization (Park et al. 2005). This may be explained that due to dendritic activation, the inward current reverses its direction from dendrite-to-soma during initial field application to soma-to-dendrite. This effect is perfectly verified in Figs. 8b–d and 9b–d. This phenomenon is never found in the single-compartment neuron model and this further suggests that our two-compartment electric field model is more close to the actual neuron.
Fig. 9.
Different firing patterns in the parameters space of V K and V with g c = 2.1 (mS/cm2), and V s − V bifurcation diagram. a Time sequences of neuronal firing in different values of V K and V. b Different firing patterns in the parameters space of V K and V. The blue region (I) represents no firing at figure bottom center, the green region (II) represents bursting at figure top center and the red region (III) represents periodic spiking on the left and right of the figure. c V s − V bifurcation diagram for V K = −38.56. The red points indicate unstable equilibrium points and the blue points are for asymptotically stable equilibrium ones. Two Hopf Bifurcation points are shown in green. d ISI bifurcation diagram for V K = −38.56. (Color figure online)
Reversal potential of potassium ion VK
Another important parameter, the reversal potential of potassium ion VK, will be examined for the response properties of the neuron in different electric field strengths. Researches indicate that the reversal potential of potassium ion is dependent on the concentration of extracellular potassium ion ([K+]o) directly by the following formula (Ullah and Schiff 2009):
 |
7 |
[K+]o and [K+]i are the concentration of extracellular and intracellular potassium ion respectively, and the standard value for [K+]i is 130 mM (Ullah and Schiff 2009).
It is found that the concentration of extracellular potassium ion can affect significantly on neuron firing activities. Moreover, many nervous diseases are induced by high concentration of extracellular potassium ion (Mcbain et al. 1990). Therefore, we investigate the response of the neuron to different values of VK for studying the influence of [K+]o on the neuronal dynamics.
To analyze the effects of VK on the neuron firing patterns in Fig. 9a, we can find that with the VK increasing (absolute value), the neuron firing pattern moves from bursting to periodic spiking undergoing a bifurcation. As the VK further increase, even there are two bifurcation points by moving bursting to periodic spiking and then to resting state in the presence of low negative electric field or in the absence of electric field. Figure 9b summarizes the neuron firing behavior on a two-parameter grid of V and VK. It is easy to obtain that the negative electric field is not always supposed to suppress neuronal activity, but could excite neuronal behavior when it reaches a certain level. The bifurcation diagram in Fig. 9c shows the transition process of the firing pattern as the applied field increasing in a large range with the parameter VK = −38.56 mV.
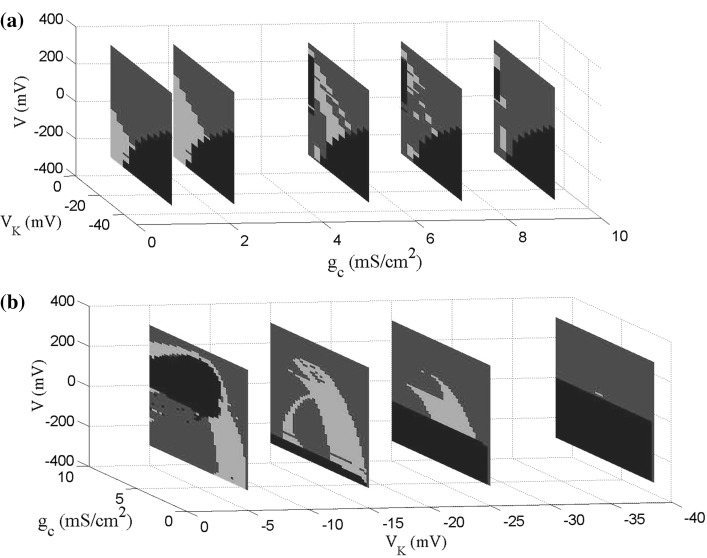
The robustness of the neuronal firing properties for large changes of VK and a wide range of gc are confirmed by the 3-parameters diagrams in Fig. 10. The neuronal firing properties are observed for different values of gc in VK − V planes, shown in Fig. 10a. No firing region (blue) remains the same in different gc, however, as gc increasing the periodic spiking region gets smaller in the beginning and then becomes larger. These results are different from the bifurcation diagrams of gc − V obtained for different VK in Fig. 10b. The no firing region changes not only its location but also its size rather than remains unchanged. With VK negatively increasing, the applied external electric field to maintain the resting state alters from the positive polarity to the negative one, accompanied by the size of parameters space (V − gc) first decreases and then increases. Firing regions including bursting ones and periodic spiking ones shrink with VK negatively increasing, specially the bursting ones gradually vanishing, and only no firing and periodic spiking regions remain when VK is negative larger.
Fig. 10.
The 3-parameters firing property diagrams for large range of parameters. a Firing property diagrams in V K − V planes for different values of g c [g c = 1, 2.1, 5, 7, 9 (mS/cm2)]. b Firing property diagrams in g c − V planes for different values of V K [V K = −5, − 15, − 25, − 38.56 (mV)]
Extracellular resistance RoutDS
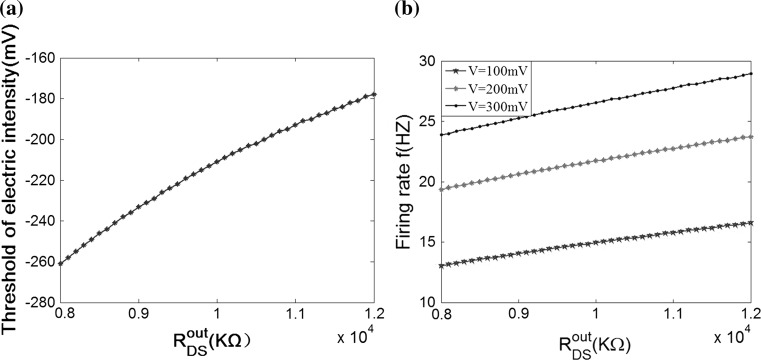
Different from other neural computational models, the extracellular field effect model under the ephaptic transmission has an important resistive characteristic for taking account of the electric resistance property of the extracellular medium. Specially, the extracellular resistance between dendrite and soma RoutDS is significant element for the modulation in the neuron electric activities ephaptically. As we know from the above study, the modest negative electric field can suppress the neuronal excitability. In order to examine the modulation of ephapse in extracellular field effects, we analyze the sensitivity of neuronal firing to the extracellular electric field intensity in different extracellular resistances RoutDS. Here, we define the threshold of inhibitory electric field intensity as the critical value which makes the neuron transmit from firing state to resting one. And the threshold of inhibitory electric intensity versus the extracellular resistance (RoutDS) is shown in Fig. 11a. It is observed that as the extracellular resistance RoutDS increases, a lower intensity of negative electric field is required to suppress the neuronal firing. That is to say, the sensitivity of the hippocampal pyramidal cell to inhibitory electric field increases with the extracellular resistance RoutDS. Figure 11b shows that the extracellular resistance (RoutDS) modulates the neuron firing rate with different intensities of the electric field. Both of them suggest that the electric field effects on the neuron are reinforced with the increase of RoutDS. The results can be explained from Fig. 2 that the DC component of the induced voltage  along the dendritic-to-soma axis will increase with RoutDS, which results in the enhanced sensitivity of the neuron to the applied extracellular electric field.
Fig. 11.
The neuronal sensitivity to the extracellular resistance R outDS with V K = −15 mV. a The electric field threshold for suppressing the neuronal excitability in different R outDS. b The neuron firing rate versus R outDS in three electric field intensities V = 100 mV, V = 200 mV, V = 300 mV respectively
The above simulation results coincide with the hippocampal slices experiments about the suppression of epileptiform activity (Durand 2003; Yaari et al. 1983; Shuai et al. 2003). It has been reported in either the low calcium conditions or high potassium ones that the extracellular potassium concentration can all be notably elevated, which may induce not only the hyperexcitability of cell but also the enhanced sensitivity of cell to the extracellular electric field intensity. Here, the underlying mechanisms can be explained the following: On the one hand, enhanced extracellular potassium concentration make the VK positively increase (referring to Eq. 7), which in turn lead to more depolarization of the membrane so that the firing states are still maintained for even stronger inhibitory electric field. On the other hand, since increasing extracellular potassium concentration increases cell swelling and in turn decreases the extracellular volume space as well as the cross-sectional area of the extracellular medium which is reciprocally related to the extracellular resistance RoutDS (Park et al. 2005), RoutDS increases with elevated extracellular potassium concentration and then the sensitivity of cell to the extracellular electric field is enhanced.
In some studies, it is observed that an active neuron can produce a depolarization on the membrane of adjacent inactive neuron (Weiss and Faber 2010). These effects are dramatic in the case of the high extracellular resistance, as the current flows along an alternative parallel pathway. In the teleost M-cell system, this could occur in a specialized region called the axon cap, with an extracellular volume resistivity that is approximately ninefold greater than the surrounding medium (Korn and Faber 1975, 2005). And these effects may be amplified at the network level, especially, in the tissue with parallel layered structure, such as the pyramidal cell in hippocampus.
Overall, the electric field effects on a single hippocampal pyramidal neuron are closely related to the intercellular electronic properties (the coupling conductance between soma and dendrite and the reversal potential of potassium ion) and the extracellular electronic properties (the electric properties of the extracellular medium and the electric field intensity).
Extracellular AC electric field effects
Frequency effects on neuronal firing pattern
The rhythmical behaviors are the most basic activities of our brain, and all the neurons are influenced by the endogenous and external electric field. Therefore, it is a critical issue that what the effects of the electric field on neuronal firing rhythm are. In our ephaptic model, the electric field modulates the neuronal electric activities through the neural tissue equivalent to a resistive array. In order to investigate the effects on the neuron firing rhythm with different frequency extracellular fields, we apply a sinusoidal electric field to the pyramidal neuron with the form of V = A sin (2πft). In this section, the spiking phase lock is mainly concerned, so the reversal potential of potassium ion is set to the standard value VK = −38.56 mV.
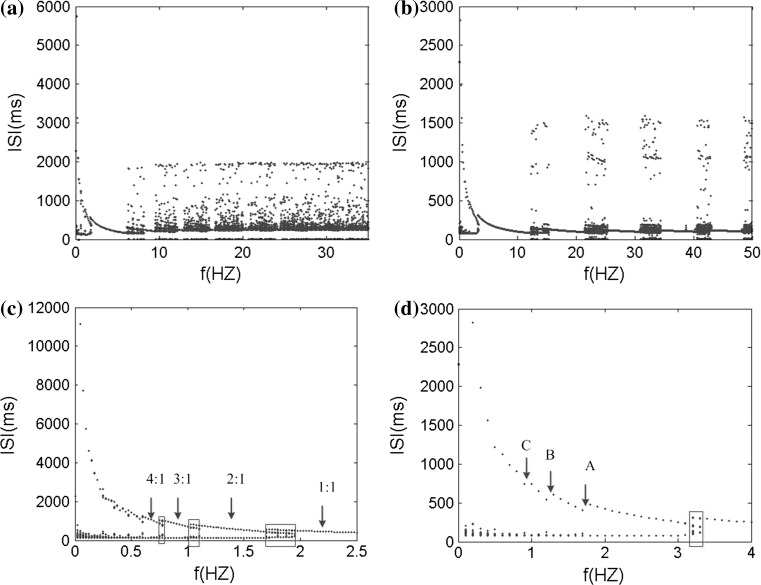
In order to systemically and globally study the extracellular electric field frequency modulating the neuronal firing rhythm, we analyze the interspike interval (ISI) bifurcation and the average firing rate of the somatic membrane potential sequences in different frequencies. The ISI bifurcation diagrams are shown in Fig. 12a, b as the electric field frequency varying from f = 0 Hz to f = 50 Hz with A = 150 mV and A = 300 mV respectively. It is found that when the frequency increases gradually, the neuron firing patterns move from bursting to periodic spiking, and then to chaos alternation. Among these abundant firing patterns, we can find that the 1:1 synchronously periodic spiking phase locking pattern has the widest frequency band and frequency bands of other periodic spiking phase locking patterns between the two chaotic spiking patterns decrease progressively with the increase of frequency. Compare the two ISI bifurcation diagram, it can be found that the stronger electric field will activate the wider frequency bands with stable spike-field coherence and the narrower frequency bands with chaos spiking patterns between phase-locking patterns. And an amplitude threshold of electric field increasing with the input frequency is required to obtain the spiking-field coherence. When spike-field coherence is obtained, as we know, the spiking signals will best contain the frequency components of the applied electric field. Therefore, our simulated results indicate that the weak electric field information cannot be better coded in the spikes by the pyramidal cell. However, in this paper, owing to facilitate the analysis of electric field effect on a single cell, we do not consider the complex synaptic background activities like in vivo. In fact, the synaptic background activities could facilitate spike-field coherence and transmission of the even weak electric field signal via modulate the spiking time to amplify the weak electric field effect in neural network (Radman et al. 2007; Anastassiou et al. 2011; Reato et al. 2010). Here, we do not discuss the synaptic background activities which go beyond the concerning contents in this paper.
Fig. 12.
The ISI bifurcation diagram versus the electric field frequency in two amplitudes. a A = 150 mV, b A = 300 mV, c and d are the local enlargement of a and b respectively
Figure 12c, d are the local enlargement of the bifurcation diagrams of ISI sequences in the low frequency band in Fig. 12a, b respectively. The points A–C are bifurcation points from one bursting pattern to another. And there exist the transition states between the adjacent two bursting patterns (average locking firing rate n:1, n is the integer greater than 1), as shown in the red boxes. These transition patterns present that there always have the different spiking numbers in each burst i.e. either n − 1 or n from n − 1:1 bursting pattern to n:1 bursting one (not give the detailed graph here). It can be found that there are more transition states with a wider frequency bands in the presence of weaker electric field while there are less transition states with a narrower frequency bands in the presence of stronger electric field.
The average firing rate of the somatic membrane potential sequences is defined as the ratio of the number of firing destiny in electric field cycles to the number of electric field cycles with the expression as:  . Where p represents the number of the action potential generated in the electric field cycles, q represents the number of the electric field cycles. As the definition, the phase locking ratios mentioned above equal to the average firing rate (Shoji and Lee 2000).
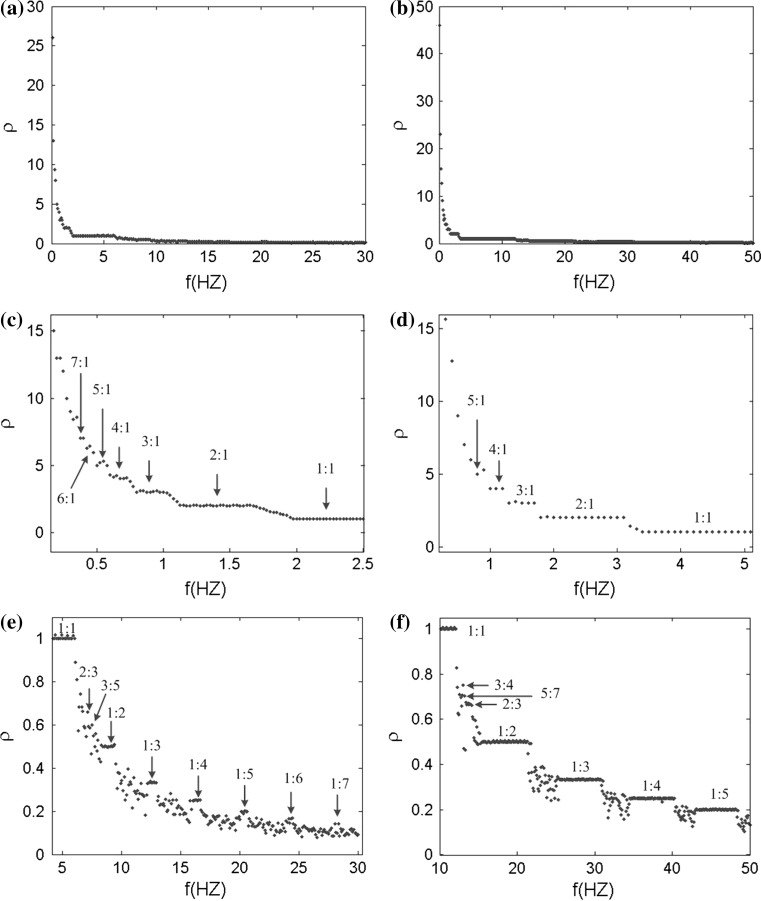
The average firing rate diagrams with different frequencies in two amplitudes of electric field A = 150 mV and A = 300 mV are shown in left and right panels of Fig. 13 respectively. Figure 13c–f is the partial enlarged details. From Fig. 13, we can find that the neuronal average firing rate decreases with the field frequency increasing and the decline is particularly remarkable in ultralow frequency band. In two amplitudes of electric field, there are more and longer steps in the average firing rate diagram with the higher amplitude. This is in accordance with the bifurcation diagrams in Fig. 12 corresponding to the phase locking frequency bands. The transition states are more clearly observed between the phase locking firing patterns in Fig. 13c, e than in Fig. 13d, f. These also verify the high amplitude stimulus activating the larger frequency bands by reducing the transition states. In general, there are affluent phase locking spiking patterns with the effects of the sinusoidal electric field under the ephaptic transmission. Furthermore, a very small change in the frequency can arouse considerable transition in neuronal firing state, specially, in the low frequency bands.
Fig. 13.
Bifurcation diagrams of average firing rate ρ versus the field frequency in two amplitudes. a A = 150 mV, b A = 300 mV, c, e and d, f are the local enlargement of a and b respectively
Amplitude effects on neuronal firing pattern
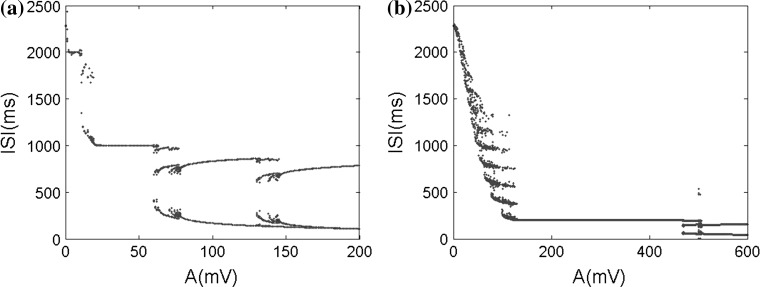
From the above study, it is believed that the extracellular electric field amplitude can regulate the neuron firing rhythm in a certain extent. The ISI bifurcation and the average firing rate versus different electric field amplitudes will be investigated with two field frequencies f = 1 Hz and f = 5 Hz. From the ISI bifurcation diagrams in Fig. 14 and the phase locking states in Fig. 15, it can be found that neuronal firing patterns change from the alteration of chaos and p:q(p, q ≠ 1, p < q) phase locking to 1:1 synchronously spiking, then to the alteration of transition state and p:1(p ≥ 2) bursting. Compared (a) and (b) in Figs. 14 and 15, furthermore, it can be found that each stable spike-field coherent pattern can maintain within the narrower range of the applied electric field intensity in (a) than in (b). For example, 1:1 stable phase locking pattern can only maintain over the change of about less 50 mV for 1 Hz input frequency but maintain over the change of about more than 300 mV for 5 Hz one. This leads to over the same range of the electric field amplitude, there should exist the more abundant spike-field coherent patterns for the lower input frequency. In the other word, these simulated results suggest that the pyramidal cells are more sensitive to the low frequency electric fields than high frequency ones, which is easy to understand from the fact that filter characteristic of the neuron makes the high frequency response for the same electric field intensity often weaker than the low frequency one.
Fig. 14.
The ISI bifurcation diagrams versus the electric field amplitude in two frequencies. a f = 1 Hz, b f = 5 Hz
Fig. 15.
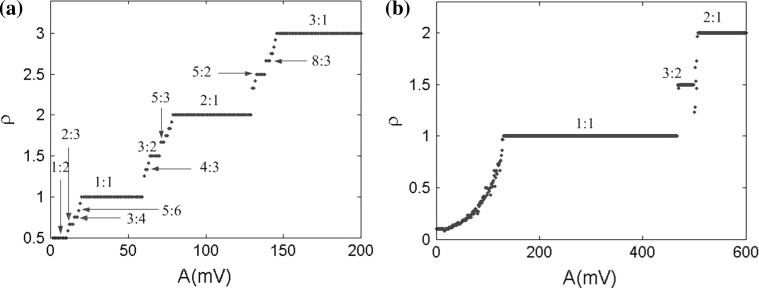
Bifurcation diagrams of average firing rate ρ versus the stimulus frequency in two amplitudes. a f = 1 Hz, b f = 5 Hz. The marked ratios are the special average firing rate standing for the various phase locking patterns
To analyze the concrete phase locking patterns in different electric field amplitudes, the average firing rate is studied with two frequencies f = 1 Hz and f = 5 Hz in Fig. 15. The average firing rate rises like stairs with the increase of the amplitude. In the same amplitude range, more phase locking patterns are observed in the low frequency. It indicates that larger amplitude range is required to activate more neuronal firing properties in the high frequency field. These results again demonstrate that the neuronal firing is more sensitive to the low frequency field. As a result, there are more abundant phase locking patterns as Fig. 15a shown. With sufficient amplitude, the neuron can exhibit some phase locking patterns in low frequency, however, it still loses most of the rich phase locking.
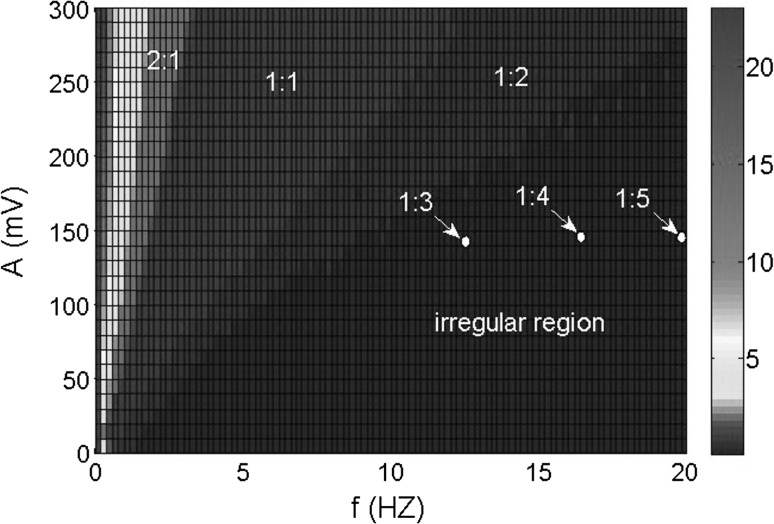
To investigate the effect of the electric field on neuronal firing pattern more systematically, firing patterns based on the average firing rate in the two-parameter space of applied field frequency and amplitude are shown in Fig. 16. Some typical phase locking regions are marked and some irregular firing patterns are also shown in Fig. 16. It is obvious that there are rich phase locking patterns in the low frequency band in accordance with the above research.
Fig. 16.
Firing patterns based on the average firing rate in the two-parameter space of applied field frequency and amplitude. The color depth denotes the firing rate. The marked regions are the specific phase locking patterns. The irregular region reveals most states in this region are irregular spiking patterns except for very few phase locking patterns such as 1:3, 1:4, 1:5 mixed up with them. (Color figure online)
Extracellular resistance effects on neuronal average firing rate
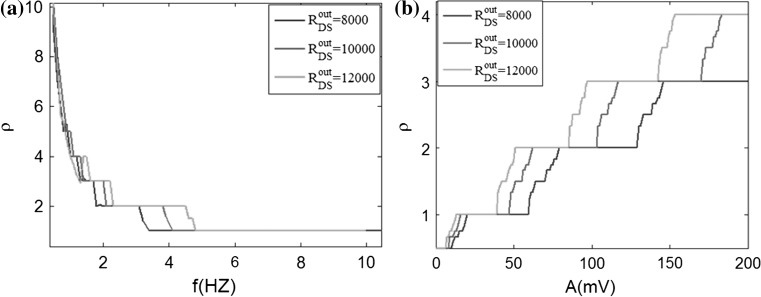
The extracellular resistance affects not only the DC electric field threshold, but also could have profound effects on the neuron firing rhythm in the presence of sinusoidal electric field. With different extracellular resistance values, the average firing rates have been studied in sinusoidal electric field to explore the effects of ephaptic interactions on neuronal activities. When the amplitude is fixed in A = 300 mV, the step-curves of the average rate are shown in Fig. 17a as a function of the frequency in different extracellular resistance values. It is obvious that as the resistance increase, a higher frequency is required to achieve a special phase locking state such as 2:1 and 1:1 phase locking state, and the special states possess wider frequency bands. This indicates that the change of extracellular medium property could affect the neuronal sensitivity to the electric field frequency. That is to say, with the same frequency electric field, the neuron firing rhythm may obviously vary from different extracellular environment. These conclusions coincide with the results, that slow (<8 Hz) fluctuations of the extracellular field could change the course of neuron membrane potentials by ephaptic coupling, obtained in Anastassiou’s experiment (Anastassiou et al. 2011).
Fig. 17.
Fix the electric field amplitude (frequency), the average firing rate versus the frequency (amplitude) in different extracellular resistance. a The fixed amplitude A = 300 mV, b the fixed frequency f = 1 Hz. As the legend shows, the three colors denote different extracellular resistance values. (Color figure online)
From Fig. 17b, it demonstrates that with the extracellular resistance increasing, the neuron is more sensitive to the electric field amplitude. In other words, the neuron membrane potentials exhibit more abundant phase locking patterns with the larger extracellular resistance in certain amplitude range. Overall, the larger extracellular resistance could raise the neuronal average firing rate to some extent and enhance the neuronal sensitivity to the extracellular field effect. In other words, extracellular environment can modulates the ephaptic interaction effect on neurons by increasing the extracellular resistance value.
Discussion
The focus of our study is to investigate the responses of the neuronal membrane potential to the extracellular applied electric field under the ephaptic transmission in a more biologically plausible model. Although ephaptic transmission does not have a major effect in neural communication system, as a new mode of coordination within the brain, ephaptic transmission separated from the usual neuron-synapse channels contributes on many levels during brain processing (Radman et al. 2007; Anastassiou et al. 2011; Jefferys 1995; Deans et al. 2007; Chan and Nicholson 1986; Traub et al. 1985). Under DC electric field, we can find that the concentration of extracellular potassium ion and the extracellular resistance can alert the neuron from silence to firing. The result reveals that the efficacy of the fields at modulating neural activity is dependent on ephapse transmission. This is consistent with the results of the low-calcium hippocampal slices experiments that as a result of cell swelling, the increased extracellular resistance enhances electric fields effects (Durand 2003; Yaari et al. 1983). In most of DC electric field models, as inhibitory electric fields, negative electric fields always suppress neuronal excitability (Durand 2003; Gluckman et al. 1996; Duong and Chang 1998). However, it is interesting that while positive electric fields can promote neuronal excitability, the larger negative also can excite the neuron in our model. This can be explained from the two-compartment model by noting that due to dendritic activation, the inward current reverses its direction from dendrite-to-soma during initial field application to soma-to-dendrite. Moreover such results never appear in those electric fields modeled by direct stimulation via input currents. However, chaotic phenomenon could be generated in DC current stimulation that could not occur in the presence of DC electric field in our model (not shown in the paper). More of differences and deviations between voltage electric field effects and direct current stimulation effects can be further studied in the future. The electric field effects on neurons in our ephaptic transmission model could also be investigated detailedly and systematacially in the background of synapse.
As discussed in Fig. 16 in “Amplitude effects on neuronal firing pattern” section, neuronal firing patterns is sensitive to both the frequency and amplitude of the applied electric field. Particularly, for low frequency stimulus, even small change of electric field strength could induce the transition of the firing patterns, which means that neuronal firing activity is more sensitive to the low frequency fields. Furthermore, the critical value of electric field intensity that is needed to achieve the stable phase locking patterns for the low frequency band is far less than that for the high frequency one. Just seen in Fig. 16, it seems that this critical value is descending with the decreasing input frequency. In fact, this descending tendency cannot last forever. It is interesting that more simulations about the even lower frequency (<1 Hz) electric field (here these graphs do not list in this paper) suggest that the critical electric field intensity to achieve the stable phase locking patterns will increase with the decreasing input frequency (<1 Hz). And there exist a globally most sensitive point (about 1 Hz) to obtain spike-field coherence for the whole frequency band, which is very similar to phase-locking results (Figs. 4, 8 in Yang et al. 2012) even though these points are different quantitatively. The underlying mechanism may involve the resonant properties of individual neurons having the preferred frequency. The pyramidal neuron usually has the low natural spiking frequency which is about 1 Hz without exerting extracellular electric field in our simulations. This natural frequency makes the neuron most easily achieve the stable spike-field coherence (i.e. most sensitive) for the electric field with the frequency around its preferred one.
The effects of ephaptic transmission on neuronal spike-field coherence are prominent in the presence of AC electric field. It suggests that ephaptic transmission have played a constructive role in applied electric field modulating the neural activities during brain processing.
For purpose of exploring ephaptic transmission mechanism clearly, ephaptic interactions are separated from others in the model and electric field effects are investigated under the ephaptic transmission in a lager range which is under physiological conditions. The fields in our model are comparable to fields applied in cells by extracellular electrodes in the brain slices experiments (Chan et al. 1988; Chan and Nicholson 1986; Bawin et al. 1984; Jefferys 1981). The weak extracellular fields cannot trigger any additional action potentials. However, it did induce substantial shifts in the spike timing that is important for memory information (Radman et al. 2007; Reato et al. 2010). Furthermore, the weak field effects may be amplified for certain structure and conditions, such as neural network and the M-cell axon cap with a high resistivity (Korn and Faber 1975; Weiss et al. 2008). The strong extracellular fields can entrain neural firing, for instance, during the violent seizures of epilepsy, portions of the brain generate very strong electrics fields (Netoff and Schiff 2002; Traynelis and Dingledine 1988). Larger scale network framework research will be required in order to replicate biological effects more accurately. Field effects exert across a large population of laminar neurons is amplified and overlapped by network interactions between the affected neurons network architectures (Francis et al. 2003; Deans et al. 2007; Fujisawa et al. 2004; Purpura and Mcmurtry 1965). The hippocampal CA3 pyramidal neurons with parallel laminar structure are very conductive to electric field modulation. The exquisite sensitivity of neurons to weak electric fields would be observed in this network, and ephaptic transmission may have a more important role in neuronal network than is generally appreciated. This study may contribute to the prediction of ephaptic interactions in neural system in experiments and also be potentially helpful in the development and application of electromagnetic stimulation technique for the treatment of neural diseases.
Acknowledgments
This work is supported by the National Natural Science Foundation of China (Grant Nos. 61372010, 61172009, 61302002, 61072012, 60901035, and 61104032) and by Tianjin Municipal Natural Science Foundation (12JCZDJC21100).
Appendix
The whole field effect model of two-compartment pyramidal neuron (WFEM) under the ephaptic transmission is governed by the following equations (Park et al. 2005; Pinsky and Rinzel 1994):
 |
8 |
Vs and Vd are the somatic and dendritic membrane potentials. The somatic compartment contains leakage current IsLeak, sodium current INa and delayed rectifier potassium current IKDR, and generates fast spiking. The dendritic compartment possesses leakage current IdLeak, calcium current ICa, potassium after hyperpolarization current IKAHP, calcium activated potassium current IKC, synaptic currents Isyn, and can produce slow voltage oscillations. IinDS is the current flowing between the two chambers of the neuron and Is(Id) is the injected currents into the soma (dendrite). p = somatic area/total membrane area expresses the asymmetry between the areas of the two compartments. The two compartments are electrically connected with a coupling conductance gc. The values of model parameters are shown in Tables 2 and 3. Special values of the variable parameters are only used in some cases with the corresponding declarations in the context.
According to the Kirchhoff current law in the equivalent circuit (Fig. 1b), we can get the following equations:
 |
9 |
So the VoutDS and IinDS will be shown as:
 |
10 |
The kinetic equations for the gating variables of different ionic channels (h, n, s, c, q) take the form:
 |
11 |
The argument U equals Vs when y = h, n; Vd when y = s, c; Ca when y = q. The details for αy and βy are shown in Table 4. The dynamics of the intracellular Ca2+ concentration is given by:
 |
12 |
The weighting functions for the two synaptic conductances (NMDA and AMPA) are governed by the following differential equations:
 |
13 |
where H(x) = 1 if x ≥ 0 and 0 otherwise. We set S, W = 0 in our simulation to separate the chemical synapse.
 |
 |
References
- Anastassiou CA, Montgomery SM, Barahona M, et al. The effect of spatially inhomogeneous extracellular electric fields on neurons. J Neurosci. 2010;30(5):1925–1936. doi: 10.1523/JNEUROSCI.3635-09.2010. [DOI] [PMC free article] [PubMed] [Google Scholar]
- Anastassiou CA, Perin R, Markram H, et al. Ephaptic coupling of cortical neurons. Nat Neurosci. 2011;14(2):217–223. doi: 10.1038/nn.2727. [DOI] [PubMed] [Google Scholar]
- Bawin SM, Sheppard AR, Mahoney MD, et al. Influences of sinusoidal electric fields on excitability in the rat hippocampal slice. Brain Res. 1984;323(2):227–237. doi: 10.1016/0006-8993(84)90293-2. [DOI] [PubMed] [Google Scholar]
- Bernhardt J. The direct influence of electromagnetic fields on nerve- and muscle cells of man within the frequency range of 1 Hz to 30 MHz. Radiat Environ Biophys. 1979;16(4):309–323. doi: 10.1007/BF01340569. [DOI] [PubMed] [Google Scholar]
- Bikson M, Inoue M, Akiyama H, et al. Effects of uniform extracellular dc electric fields on excitability in rat hippocampal slices in vitro. J Physiol. 2004;557(Pt 1):175–190. doi: 10.1113/jphysiol.2003.055772. [DOI] [PMC free article] [PubMed] [Google Scholar]
- Casarotto S, Romero LL, Bellina V, et al. EEg responses to TMS are sensitive to changes in the perturbation parameters and repeatable over time. PLoS One. 2010;5(4):e10281. doi: 10.1371/journal.pone.0010281. [DOI] [PMC free article] [PubMed] [Google Scholar]
- Chan CY, Nicholson C. Modulation by applied electric fields of purkinje and stellate cell activity in the isolated turtle cerebellum. J Physiol. 1986;371:89–114. doi: 10.1113/jphysiol.1986.sp015963. [DOI] [PMC free article] [PubMed] [Google Scholar]
- Chan CY, Hounsgaard J, Nicholson C. Effects of electric fields on transmembrane potential and excitability of turtle cerebellar purkinje cells in vitro. J Physiol. 1988;402:751–771. doi: 10.1113/jphysiol.1988.sp017232. [DOI] [PMC free article] [PubMed] [Google Scholar]
- Daskalakis ZJ, Levinson AJ, Fitzgerald PB. Repetitive transcranial magnetic stimulation for major depressive disorder: a review. Can J Psychiatry. 2008;53(9):555–566. doi: 10.1177/070674370805300902. [DOI] [PubMed] [Google Scholar]
- de Ruyter VSR, Lewen GD, Strong SP, et al. Reproducibility and variability in neural spike trains. Science. 1997;275(5307):1805–1808. doi: 10.1126/science.275.5307.1805. [DOI] [PubMed] [Google Scholar]
- Deans JK, Powell AD, Jefferys JG. Sensitivity of coherent oscillations in rat hippocampus to ac electric fields. J Physiol. 2007;583(Pt 2):555–565. doi: 10.1113/jphysiol.2007.137711. [DOI] [PMC free article] [PubMed] [Google Scholar]
- Du Y, Wang R, Han F, Lu Q, Qu J. Firing pattern and synchronization property analysis in a network model of the olfactory bulb. Cogn Neurodyn. 2012;6(2):203–209. doi: 10.1007/s11571-011-9189-2. [DOI] [PMC free article] [PubMed] [Google Scholar]
- Dudek FE, Yasumura T, Rash JE. ‘Non-synaptic’ mechanisms in seizures and epileptogenesis. Cell Biol Int. 1998;22(11–12):793–805. doi: 10.1006/cbir.1999.0397. [DOI] [PubMed] [Google Scholar]
- Duong DH, Chang T. The influence of electric fields on the epileptiform bursts induced by high potassium in ca3 region of rat hippocampal slice. Neurol Res. 1998;20(6):542–548. doi: 10.1080/01616412.1998.11740561. [DOI] [PubMed] [Google Scholar]
- Durand DM. Electric field effects in hyperexcitable neural tissue: a review. Radiat Prot Dosimetry. 2003;106(4):325–331. doi: 10.1093/oxfordjournals.rpd.a006368. [DOI] [PubMed] [Google Scholar]
- Durand DM, Bikson M. Suppression and control of epileptiform activity by electrical stimulation: a review. Proc IEEE. 2001;89(7):1065–1082. doi: 10.1109/5.939821. [DOI] [Google Scholar]
- Eichwald C, Kaiser F. Model for external influences on cellular signal transduction pathways including cytosolic calcium oscillations. Bioelectromagnetics. 1995;16(2):75–85. doi: 10.1002/bem.2250160203. [DOI] [PubMed] [Google Scholar]
- Ermentrout B. Simulating, analyzing, and animating dynamical systems: a guide to XPPAUT for researchers and students. Philadelphia, PA: Society for Industrial Mathematics Press; 2002. [Google Scholar]
- Francis JT, Gluckman BJ, Schiff SJ. Sensitivity of neurons to weak electric fields. J Neurosci. 2003;23(19):7255–7261. doi: 10.1523/JNEUROSCI.23-19-07255.2003. [DOI] [PMC free article] [PubMed] [Google Scholar]
- Fujisawa S, Matsuki N, Ikegaya Y. Chronometric readout from a memory trace: gamma-frequency field stimulation recruits timed recurrent activity in the rat ca3 network. J Physiol. 2004;561(Pt 1):123–131. doi: 10.1113/jphysiol.2004.066639. [DOI] [PMC free article] [PubMed] [Google Scholar]
- Furukawa T, Furshpan EJ. Two inhibitory mechanisms in the Mauthner neurons of goldfish. J Neurophysiol. 1963;26:140–176. doi: 10.1152/jn.1963.26.1.140. [DOI] [PubMed] [Google Scholar]
- Gerstner W, Kistler WM. Spiking neuron models: single neurons, populations, plasticity. Cambridge: Cambridge University Press; 2002. [Google Scholar]
- Ghai RS, Bikson M, Durand DM. Effects of applied electric fields on low-calcium epileptiform activity in the ca1 region of rat hippocampal slices. J Neurophysiol. 2000;84(1):274–280. doi: 10.1152/jn.2000.84.1.274. [DOI] [PubMed] [Google Scholar]
- Gildenberg PL. Evolution of neuromodulation. Stereotact Funct Neurosurg. 2005;83(2–3):71–79. doi: 10.1159/000086865. [DOI] [PubMed] [Google Scholar]
- Gluckman BJ, Neel EJ, Netoff TI, et al. Electric field suppression of epileptiform activity in hippocampal slices. J Neurophysiol. 1996;76(6):4202–4205. doi: 10.1152/jn.1996.76.6.4202. [DOI] [PubMed] [Google Scholar]
- Holt GR, Koch C. Electrical interactions via the extracellular potential near cell bodies. J Comput Neurosci. 1999;6(2):169–184. doi: 10.1023/A:1008832702585. [DOI] [PubMed] [Google Scholar]
- Jefferys JG. Influence of electric fields on the excitability of granule cells in guinea-pig hippocampal slices. J Physiol. 1981;319:143–152. doi: 10.1113/jphysiol.1981.sp013897. [DOI] [PMC free article] [PubMed] [Google Scholar]
- Jefferys JG. Nonsynaptic modulation of neuronal activity in the brain: electric currents and extracellular ions. Physiol Rev. 1995;75(4):689–723. doi: 10.1152/physrev.1995.75.4.689. [DOI] [PubMed] [Google Scholar]
- Jefferys JG, Deans J, Bikson M, et al. Effects of weak electric fields on the activity of neurons and neuronal networks. Radiat Prot Dosimetry. 2003;106(4):321–323. doi: 10.1093/oxfordjournals.rpd.a006367. [DOI] [PubMed] [Google Scholar]
- Klimesch W, Sauseng P, Gerloff C. Enhancing cognitive performance with repetitive transcranial magnetic stimulation at human individual alpha frequency. Eur J Neurosci. 2003;17(5):1129–1133. doi: 10.1046/j.1460-9568.2003.02517.x. [DOI] [PubMed] [Google Scholar]
- Korn H, Faber DS. An electrically mediated inhibition in goldfish medulla. J Neurophysiol. 1975;38(2):452–471. doi: 10.1152/jn.1975.38.2.452. [DOI] [PubMed] [Google Scholar]
- Korn H, Faber DS. The Mauthner cell half a century later: a neurobiological model for decision-making? Neuron. 2005;47(1):13–28. doi: 10.1016/j.neuron.2005.05.019. [DOI] [PubMed] [Google Scholar]
- Kringelbach ML, Jenkinson N, Owen SL, et al. Translational principles of deep brain stimulation. Nat Rev Neurosci. 2007;8(8):623–635. doi: 10.1038/nrn2196. [DOI] [PubMed] [Google Scholar]
- Krishnamurthi N, Mulligan S, Mahant P, Samanta J, Abbas JJ. Deep brain stimulation amplitude alters posture shift velocity in Parkinson’s disease. Cogn Neurodyn. 2012;6(4):325–332. doi: 10.1007/s11571-012-9201-5. [DOI] [PMC free article] [PubMed] [Google Scholar]
- Macvicar BA, Dudek FE. Electrotonic coupling between pyramidal cells: a direct demonstration in rat hippocampal slices. Science. 1981;213(4509):782–785. doi: 10.1126/science.6266013. [DOI] [PubMed] [Google Scholar]
- Marshall L, Helgadottir H, Molle M, et al. Boosting slow oscillations during sleep potentiates memory. Nature. 2006;444(7119):610–613. doi: 10.1038/nature05278. [DOI] [PubMed] [Google Scholar]
- Martin PI, Naeser MA, Ho M, et al. Research with transcranial magnetic stimulation in the treatment of aphasia. Curr Neurol Neurosci Rep. 2009;9(6):451–458. doi: 10.1007/s11910-009-0067-9. [DOI] [PMC free article] [PubMed] [Google Scholar]
- Mcbain CJ, Traynelis SF, Dingledine R. Regional variation of extracellular space in the hippocampus. Science. 1990;249(4969):674–677. doi: 10.1126/science.2382142. [DOI] [PubMed] [Google Scholar]
- Meng P, Wang Q, Lu Q. Bursting synchronization dynamics of pancreatic β-cells with electrical and chemical coupling. Cogn Neurodyn. 2013;7(3):197–212. doi: 10.1007/s11571-012-9226-9. [DOI] [PMC free article] [PubMed] [Google Scholar]
- Netoff TI, Schiff SJ. Decreased neuronal synchronization during experimental seizures. J Neurosci. 2002;22(16):7297–7307. doi: 10.1523/JNEUROSCI.22-16-07297.2002. [DOI] [PMC free article] [PubMed] [Google Scholar]
- Njap F, Clausssen JC, Moser A, Hofmann UG. Modeling effect of GABAergic current in a basal ganglia computational model. Cogn Neurodyn. 2012;6(4):333–341. doi: 10.1007/s11571-012-9203-3. [DOI] [PMC free article] [PubMed] [Google Scholar]
- Park EH, Barreto E, Gluckman BJ, et al. A model of the effects of applied electric fields on neuronal synchronization. J Comput Neurosci. 2005;19(1):53–70. doi: 10.1007/s10827-005-0214-5. [DOI] [PMC free article] [PubMed] [Google Scholar]
- Partsvania B, Sulaberidze T, Modebadze Z, et al. Extremely low-frequency magnetic fields effects on the snail single neurons. Electromagn Biol Med. 2008;27(4):409–417. doi: 10.1080/15368370802473513. [DOI] [PubMed] [Google Scholar]
- Pinsky PF, Rinzel J. Intrinsic and network rhythmogenesis in a reduced traub model for ca3 neurons. J Comput Neurosci. 1994;1(1–2):39–60. doi: 10.1007/BF00962717. [DOI] [PubMed] [Google Scholar]
- Purpura DP, Mcmurtry JG. Intracellular activities and evoked potential changes during polarization of motor cortex. J Neurophysiol. 1965;28:166–185. doi: 10.1152/jn.1965.28.1.166. [DOI] [PubMed] [Google Scholar]
- Radman T, Su Y, An JH, et al. Spike timing amplifies the effect of electric fields on neurons: implications for endogenous field effects. J Neurosci. 2007;27(11):3030–3036. doi: 10.1523/JNEUROSCI.0095-07.2007. [DOI] [PMC free article] [PubMed] [Google Scholar]
- Reato D, Rahman A, Bikson M, et al. Low-intensity electrical stimulation affects network dynamics by modulating population rate and spike timing. J Neurosci. 2010;30(45):15067–15079. doi: 10.1523/JNEUROSCI.2059-10.2010. [DOI] [PMC free article] [PubMed] [Google Scholar]
- Rubin JE, Terman D. High frequency stimulation of the subthalamic nucleus eliminates pathological thalamic rhythmicity in a computational model. J Comput Neurosci. 2004;16(3):211–235. doi: 10.1023/B:JCNS.0000025686.47117.67. [DOI] [PubMed] [Google Scholar]
- Sandrini M, Umilta C, Rusconi E. The use of transcranial magnetic stimulation in cognitive neuroscience: a new synthesis of methodological issues. Neurosci Biobehav Rev. 2011;35(3):516–536. doi: 10.1016/j.neubiorev.2010.06.005. [DOI] [PubMed] [Google Scholar]
- Schaefer AT, Angelo K, Spors H, et al. Neuronal oscillations enhance stimulus discrimination by ensuring action potential precision. PLoS Biol. 2006;4(6):e163. doi: 10.1371/journal.pbio.0040163. [DOI] [PMC free article] [PubMed] [Google Scholar]
- Schutt M, Claussen JC. Desynchronizing effect of high-frequency stimulation in a generic cortical network model. Cogn Neurodyn. 2012;6(4):343–351. doi: 10.1007/s11571-012-9199-8. [DOI] [PMC free article] [PubMed] [Google Scholar]
- Schweitzer JS, Patrylo PR, Dudek FE. Prolonged field bursts in the dentate gyrus: dependence on low calcium, high potassium, and nonsynaptic mechanisms. J Neurophysiol. 1992;68(6):2016–2025. doi: 10.1152/jn.1992.68.6.2016. [DOI] [PubMed] [Google Scholar]
- Shoji FF, Lee HH. On a response characteristics in the Hodgkin–Huxley model of nerve and muscle fiber to a periodic stimulation. Ind Electron Soc (IECON 2000) 2000;3:2035–2041. [Google Scholar]
- Shuai J, Bikson M, Hahn PJ, et al. Ionic mechanisms underlying spontaneous ca1 neuronal firing in ca2+-free solution. Biophys J. 2003;84(3):2099–2111. doi: 10.1016/S0006-3495(03)75017-6. [DOI] [PMC free article] [PubMed] [Google Scholar]
- Tranchina D, Nicholson C. A model for the polarization of neurons by extrinsically applied electric fields. Biophys J. 1986;50(6):1139–1156. doi: 10.1016/S0006-3495(86)83558-5. [DOI] [PMC free article] [PubMed] [Google Scholar]
- Traub RD, Dudek FE, Taylor CP, et al. Simulation of hippocampal afterdischarges synchronized by electrical interactions. Neuroscience. 1985;14(4):1033–1038. doi: 10.1016/0306-4522(85)90274-X. [DOI] [PubMed] [Google Scholar]
- Traynelis SF, Dingledine R. Potassium-induced spontaneous electrographic seizures in the rat hippocampal slice. J Neurophysiol. 1988;59(1):259–276. doi: 10.1152/jn.1988.59.1.259. [DOI] [PubMed] [Google Scholar]
- Ullah G, Schiff SJ. Tracking and control of neuronal Hodgkin–Huxley dynamics. Phys Rev E Stat Nonlin Soft Matter Phys. 2009;79(4 Pt 1):40901. doi: 10.1103/PhysRevE.79.040901. [DOI] [PMC free article] [PubMed] [Google Scholar]
- Wang R, Zhang Z. Energy coding in biological neural networks. Cogn Neurodyn. 2007;1(3):203–212. doi: 10.1007/s11571-007-9015-z. [DOI] [PMC free article] [PubMed] [Google Scholar]
- Weiss SA, Faber DS. Field effects in the CNS play functional roles. Front Neural Circuits. 2010;4:15. doi: 10.3389/fncir.2010.00015. [DOI] [PMC free article] [PubMed] [Google Scholar]
- Weiss SA, Preuss T, Faber DS. A role of electrical inhibition in sensorimotor integration. Proc Natl Acad Sci USA. 2008;105(46):18047–18052. doi: 10.1073/pnas.0806145105. [DOI] [PMC free article] [PubMed] [Google Scholar]
- Xie Y, Xu JX, Hu SJ, Kang YM, Yang HJ, Duan YB. Dynamical mechanisms for sensitive response of aperiodic firing cells to external stimulation. Chaos, Solitons Fractals. 2004;22(1):151–160. doi: 10.1016/j.chaos.2004.01.001. [DOI] [Google Scholar]
- Yaari Y, Konnerth A, Heinemann U. Spontaneous epileptiform activity of ca1 hippocampal neurons in low extracellular calcium solutions. Exp Brain Res. 1983;51(1):153–156. doi: 10.1007/BF00236813. [DOI] [PubMed] [Google Scholar]
- Yang L, Liu W, Ming Y, Wang C, et al. Vibrational resonance induced by transition of phase-locking modes in excitable systems. Phys Rev E. 2012;86:016209. doi: 10.1103/PhysRevE.86.016209. [DOI] [PubMed] [Google Scholar]
- Yi G, Wang J, Bian H, Han C, Deng B, Wei X, Li H. Multi-scale order recurrence quantification analysis of EEG signals evoked by manual acupuncture in healthy subjects. Cogn Neurodyn. 2013;7(1):79–88. doi: 10.1007/s11571-012-9221-1. [DOI] [PMC free article] [PubMed] [Google Scholar]
- Yu K, Wang J, Deng B, Wei X. Synchronization of neuron population subject to steady DC electric field induced by magnetic stimulation. Cogn Neurodyn. 2013;7(3):237–252. doi: 10.1007/s11571-012-9233-x. [DOI] [PMC free article] [PubMed] [Google Scholar]


