Abstract
Background
The aim of our study is to prospectively evaluate and compare the waist circumference-to-height ratio (WHtR) to waist-hip ratio, waist circumference, and body mass index as predictors of subsequent coronary heart disease (CHD) in a group of predominantly post-menopausal women.
Methods
The data comes from a prospective cohort study. The included subjects were 45563 women from the Nurses' Health Study cohort, aged 40-65 years in 1986, who were free of heart disease, stroke and cancer. Waist circumference, hip circumference, height, weight, age, and other covariates were collected by questionnaire. The primary endpoint was incident coronary heart disease that was reported by June 2002. Areas under the receiver operating characteristic curves (AUC) were estimated non-parametrically for each of anthropometric measures, and differences between that for WHtR and the other measures, and corresponding 95% confidence intervals were estimated. Cox proportional hazard models were used to estimate the relationships with risk of CHD.
Results
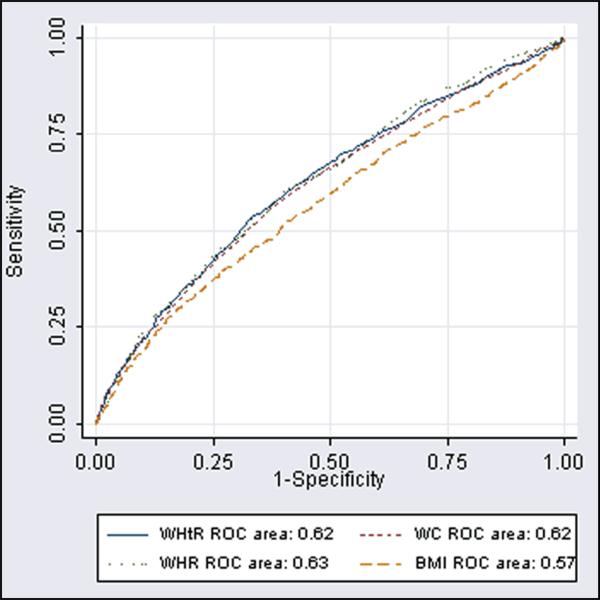
Waist-height ratio, waist-hip ratio and waist circumference were similar in predicting subsequent risk of CHD. All three waist derived measures were superior to BMI in predicting CHD. The unadjusted AUC (95% Confidence Interval) were 0.62 (0.60,0.64) for WHtR, 0.63 (0.61,0.65) for waist-hip ratio, 0.62 (0.60,0.64) for waist-circumference, and 0.57 (0.55,0.59) for body mass index.
Conclusion
Waist-height ratio is comparable to waist circumference and waist-hip ratio for prediction of coronary heart disease incidence among middle-aged and older women, but superior to BMI. Future studies are warranted to corroborate these results in other populations.
Introduction
Weight and height are frequently used as measures of nutritional status in epidemiology and medicine. The best anthropometric measure for assessing risks associated with adiposity, has not been established. The body mass index (weight divided by the square of height) is the most common measure of overall adiposity in epidemiological studies.1 However, it is also thought that the distribution of fat mass is an even more important predictor of disease than overall adiposity.1,2
Visceral fat is more metabolically active than subcutaneous fat3 and is closely correlated with insulin resistance.3-6 Waist circumference (abdominal girth), a measure of both subcutaneous and visceral fat, is easily measured and is often used as a measure of visceral fat in epidemiological studies. However, waist circumference is also correlated with body frame size, and the ratio of waist circumference to hip circumference (waist-hip ratio, WHR) is often used instead.1 The circumference of the hip however, is less than perfect as an index of frame size, since in addition to measuring “horizontal” pelvic bone size, pelvic subcutaneous fat mass, and muscle mass contribute to this measure. Since height is a measure of body frame size, the waist circumference-to-height ratio (WHtR) has been proposed as an alternative to the waist-hip ratio, and has been found to be slightly superior in terms of the prediction of metabolic disturbances among Chinese diabetic women7, Japanese men,8 and rural Bangladeshi women.9
To evaluate and compare these anthropometric measures in a large-scale cohort, we assessed waist circumference-to-height ratio as a predictor of coronary heart disease (CHD – nonfatal myocardial infarction and fatal CHD) in middle-aged and elderly women in the Nurses Health Study, and compared it to waist circumference, waist-hip ratio, and body mass index. We seek to answer two primary questions among middle aged and elderly women: 1) How does the waist circumference-to-height ratio compare to waist circumference, waist-hip ratio, and body mass index, at predicting CHD? 2) What are the relationships between the anthropometric measures and later incidence of CHD?
Methods
Study population
The Nurses’ Health Study cohort was established in 1976 when 121,700 female registered nurses aged 30 to 55 years and living in eleven US states completed and returned a mailed questionnaire about their lifestyle and medical history. The cohort continues to be followed every 2 years by questionnaire to update exposure status and to identify cases of newly diagnosed disease. We restricted our analysis to those 45,563 women who responded to the 1986 questionnaire (when waist circumference was first collected) who were also free of a prior history of heart disease, stroke, or cancer.
Exposure measurement
Data on height were collected in 1976, weight was collected biennially, and waist circumference and hip circumference measurements were collected in 1986. Women were instructed to measure their waist at the level of the umbilicus and their hips at the largest circumference between the waist and the thighs with a measuring tape, while standing relaxed; values were recorded to the nearest quarter inch. In a validation study of the weights reported by the participants, a sub-sample consisting of 184 women was chosen, and these women were weighed 6 to 12 months after completing the mailed questionnaire. Reported weights were highly correlated with measured weights (Spearman’s rank correlation 0.96), although they averaged 1.5 kg (3.3 lb) lower than the measured values.10 The measured weights were performed in clothing and at random times of day, explaining much of the increase in measured weight. The validity of measures of waist and hip circumferences were reported previously.11 In 1987, in a random sample of 140 NHS participants in the greater Boston, Mass, area, the average of 2 technician measurements spaced 6 months apart was compared with the waist and hip circumference values reported on the most recent questionnaire. Women reliably reported waist circumference, but underestimated hip circumference by an average of 1.4 cm (0.54 in). Crude Pearson correlation coefficients for reported and measured circumferences for waist and hip and the WHR were 0.89, 0.84, and 0.70, respectively.12WHtR was calculated by dividing the waist circumference reported in 1986 to the height measured in 1976. Body mass index (BMI) was calculated by dividing the weight reported in 1986 by the square of height reported in 1976 (the reports in pounds and inches were converted to kilograms and meters respectively).
Covariate measurement
Data have been collected on many coronary heart disease risk factors, including cigarette smoking, alcohol use, physical activity, age at menopause, postmenopausal hormone use, diagnosis of hypertension and diabetes mellitus, and parental history of premature myocardial infarction (before age 60).
Outcome measurement
The end-point for this study was incidence of CHD (nonfatal myocardial infarction (MI) or fatal CHD occurring after return of the 1986 questionnaire but before June 2002). Since anthropometric measures are more likely to be predictive of more proximate events, a secondary outcome was CHD occurring within 10 years of start of follow-up. We sought to review medical records for all self-reported MIs. Physicians with no knowledge of the self-reported risk factor status reviewed the records. The diagnosis of MI was confirmed by using World Health Organization criteria: symptoms in addition to either diagnostic electrocardiographic changes or elevated cardiac enzyme levels. Event date for coronary heart disease was the earlier date that a diagnosis of MI was made, or a death from CHD.
Deaths were identified from state vital records and the National Death Index or reported by next of kin and the postal system. Using all sources combined, we estimated that follow-up for the deaths was more than 98 percent complete.13 We designated as presumed fatal CHD those deaths for which coronary heart disease was the underlying cause on the death certificate but for which no records were available.
Statistical analysis
Spearman’s correlation coefficients between the anthropometric variables were calculated.
To directly compare how well the anthropometric measures predict CHD risk, we estimated areas under the receiver operating characteristic (ROC) curve.14,15 The ROC curve is a plot of the complement of cumulative distribution of the exposure (waist circumference, WHtR, waist-hip ratio, and body mass index) among those who subsequently developed CHD to the complement of the cumulative distribution among those who did not develop CHD; equivalently the sensitivity versus 1–the specificity. The areas under the ROC curves were estimated nonparametrically.14 In order to adjust for covariates15, we used residuals from linear regression models with the respective log-transformed anthropometric variable as the response variable and categorical functions of the covariates (indicator functions for quintiles of continuous variables were used) as exposure variables. We also estimated differences between the areas under the ROC curves (AUC) for WHtR and the other anthropometric measures, and their standard errors, by using the algorithm for dependent data developed by DeLong and colleagues.16
Survival was estimated using the method of Kaplan–Meier.17 The time scale used for analysis was person-years from 1986. Person-years were calculated from the time of completion of the 1986 questionnaire to the diagnosis of an outcome endpoint, or censoring, or to June 2002, whichever came first. The hazard ratios between linear functions of the anthropometric variables and the observed outcomes were estimated by Cox proportional hazards models.18 Women were censored if they died from a non-cardiac cause, or if they developed a stroke. For the purposes of this analysis, censoring was considered non-informative. Multivariable models were used to simultaneously control for confounders. To more finely control for confounding by continuous covariates (age, alcohol use), natural cubic splines 19,20 were used to smooth the relationships with the log-hazard of coronary heart disease. Physical activity was entered into the regression models as indicator functions of the quintiles since natural cubic splines did not determine a good fit for this variable. Ties in survival time were handled by using the method of Efron.19 To decrease the influence of extreme measurements, we repeated the analyses by restricting the range of the respective anthropometric variables to between the 5th and the 95th percentiles. Finally, to examine the empiric shape of the relationships to hazard of CHD, we repeated the Cox regression models by fitting the anthropometric variables with natural cubic splines, with four degrees of freedom, and plotted the results.
Analyses were performed using SAS (version 9; SAS Institute, Cary, NC), S-plus (version 8.0.4; Insightful Corp., Seattle, WA), and Stata (version 9.2; StataCorp., College Station, TX).
Human subjects
We certify that all applicable institutional and governmental regulations concerning the ethical use of human volunteers were followed during this research. The study was approved by the Committee on Human Research at the Brigham and Women’s Hospital.
Results
Among the 45,563 women, during 705,227 person-years of follow-up, we documented 790 cases of MI and fatal CHD. In 1986, median (10th, 90th percentiles) waist-height ratio was 0.47 (0.41,0.57). Median (10th, 90th percentiles) waist-hip ratio, waist circumference, and body mass index were 0.77 (0.70,0.86), 0.76 meters (0.66,0.94) [30 inches (26,37)], and 23.6 kg/m2 (20.2,30.2) respectively (see Table 1). Hip circumference, BMI, and waist-hip ratio were all positively correlated with waist-height ratio. Quantity of physical activity, alcohol intake, and number of current smokers decreased with increasing waist-height ratio.
Table 1.
Distribution of Anthropometric Measures and Cardiovascular Risk Factors for the cohort of Women in 1986 (N=45,563)
| Medians (10th to 90th percentiles)a | |
|---|---|
| Age (years) | 53 (43, 63) |
| Waist-Height Ratio | 0.47 (0.41, 0.57) |
| Height (cm) | 163 (157, 173) |
| Waist Circumference (cm) | 76.2 (66.0, 94.0) |
| Hip Circumference (cm) | 99.1 (91.4, 111.8) |
| Body Mass Index (kg/m2) | 23.6 (20.2,30.2) |
| Waist-Hip Ratio | 0.77 (0.70,0.86) |
| Physical Activity (MET hours per week) | 8.1 (0.9,37.7) |
| Mean yearly alcohol consumption (grams/day) | 1.8 (0,17.0) |
| Parental History of MI before age 60 (%) | 22.7 |
| Current Cigarette Smoking (%) | 20.6 |
| History of Hypertension (%) | 14.4 |
| History of Diabetes Mellitus (%) | 2.1 |
| History of High Cholesterol (%) | 7.4 |
| Post-menopausal (%) | 68.0 |
| Current use of postmenopausal hormone therapy in 1986 (%) | 18.8 |
Values (for categorical variables) are percentages where indicated
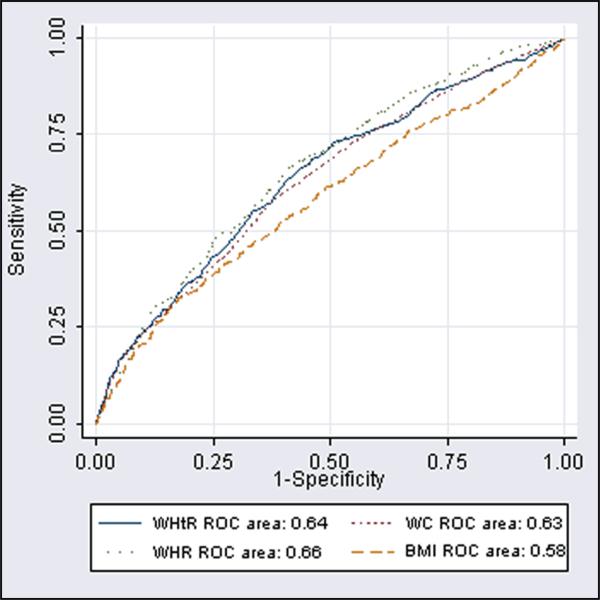
Table 2 shows the areas under the ROC curves (AUC) for the anthropometric measures for predicting CHD. As expected, the AUCs were higher for predicting CHD within the first 10 years of the measurement, relative to predicting CHD over the full 16 years of follow-up. The anthropometric measures that included waist circumference performed relatively similarly to each other (Table 2, Figures 1,2), but were superior to BMI in predicting CHD. The unadjusted AUC for BMI was 0.051 (95% CI 0.039, 0.062) less than the unadjusted AUC for WHtR. Adjusted for age, menopausal status, hormone therapy use, parental history of MI, smoking, physical activity, alcohol intake and aspirin use, the AUC for BMI was 0.022 (95% CI 0.010,0.034) less than the adjusted AUC for WHtR.
Table 2.
Area under the receiver operating characteristic curves (AUC) [and 95% confidence interval (CI)] in predicting CHD by using various anthropometric measures obtained in 1986 among women in the Nurses’ Health Study
| CHD within 10 years | All CHD (within 16 years) | |||
|---|---|---|---|---|
| Measure | AUC (95% CI) | Difference of AUC vs. Waist-Height Ratio (95% CI) | AUC (95% CI) | Difference of AUC vs. Waist-Height Ratio (95% CI) |
| Waist-Height Ratio | ||||
| Unadjusted | 0.64 (0.61, 0.67) | 0.62 (0.60, 0.64) | ||
| Age Adjusted | 0.61 (0.58, 0.64) | 0.59 (0.57, 0.61) | ||
| Adjusteda | 0.59 (0.56, 0.62) | 0.58 (0.56,0.60) | ||
| Adjustedb | 0.55 (0.52,0.58) | 0.55 (0.53,0.57) | ||
|
Waist Circumference | ||||
| Unadjusted | 0.63 (0.60,0.66) | −0.010 (−0.018,−0.002) | 0.62 (0.60,0.64) | −0.008 (−0.013,−0.002) |
| Age Adjusted | 0.60 (0.57,0.63) | −0.008 (−0.017,0.001) | 0.59 (0.56,0.61) | −0.005 (−0.011,0.001) |
| Adjusteda | 0.58 (0.55,0.61) | −0.008 (−0.017,0.001) | 0.58 (0.55,0.60) | −0.005 (−0.011,0.001) |
| Adjustedb | 0.54 (0.51,0.57) | −0.006 (−0.015,0.004) | 0.55 (0.52,0.57) | −0.004 (−0.010,0.002) |
|
Waist-Hip Ratio | ||||
| Unadjusted | 0.66 (0.63,0.69) | 0.020 (0.000,0.040) | 0.63 (0.61, 0.65) | 0.005 (−0.009,0.019) |
| Age Adjusted | 0.63 (0.60,0.66) | 0.018 (−0.003,0.039) | 0.59 (0.57, 0.61) | 0.004 (−0.011,0.019) |
| Adjusteda | 0.60 (0.57,0.63) | 0.006 (−0.016,0.028) | 0.57 (0.55,0.59) | −0.007 (−0.022,0.008) |
| Adjustedb | 0.56 (0.53,0.59) | 0.011 (−0.012,0.034) | 0.55 (0.52,0.57) | −0.004 (−0.020,0.012) |
|
Body Mass Index | ||||
| Unadjusted | 0.58 (0.55,0.61) | −0.057 (−0.074,−0.040) | 0.57 (0.55,0.59) | −0.051 (−0.062,−0.039) |
| Age Adjusted | 0.57 (0.54,0.60) | −0.040 (−0.057,−0.023) | 0.56 (0.54,0.58) | −0.032 (−0.044,−0.020) |
| Adjusteda | 0.57 (0.54,0.60) | −0.024 (−0.041,−0.006) | 0.56 (0.54,0.58) | −0.022 (−0.034,−0.010) |
| Adjustedb | 0.52 (0.49,0.56) | −0.022 (−0.040,−0.003) | 0.53 (0.51,0.55) | −0.022 (−0.035,−0.009) |
Residuals after additionally controlling for menopausal status (postmenopausal vs other), taking post-menopausal hormone therapy, parental history of myocardial infarction, cigarette smoking (never, ex-smokers, current use <15 per day, 15-24 per day, >24 per day), physical activity in MET-hours (quintiles), mean alcohol intake per day (none, use of 1-8 grams, use in excess of 8 grams), aspirin use (none, 1-14 days per month, >14 days per month).
Additional adjustment for history of diabetes mellitus, history of hypertension, and history of hypercholesterolemia.
Figure 1.
Receiver Operating Characteristic Curves of Waist Height Ratio (WHtR), Waist Circumference (WC), Waist Hip Ratio (WHR) and Body Mass Index (BMI) in utility of predicting Coronary Heart Disease within 10 years
Figure 2.
Receiver Operating Characteristic Curves of Waist Height Ratio (WHtR), Waist Circumference (WC), Waist Hip Ratio (WHR) and Body Mass Index (BMI) in utility of predicting Coronary Heart Disease from 1986 to 2002.
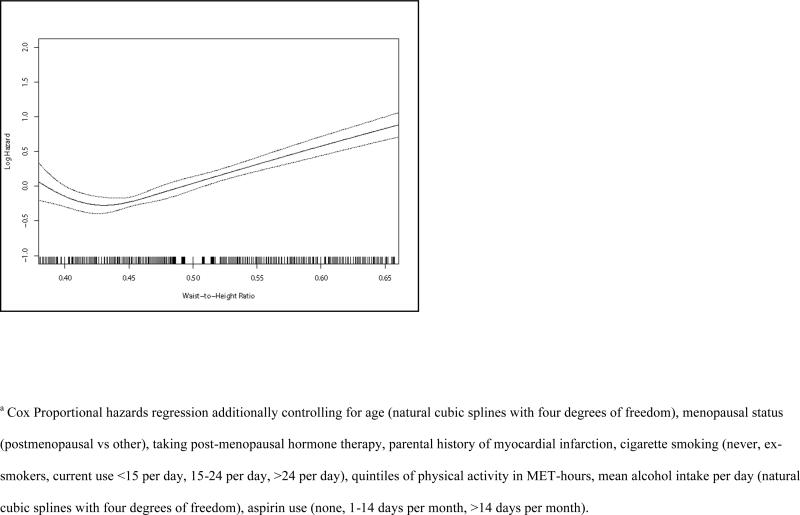
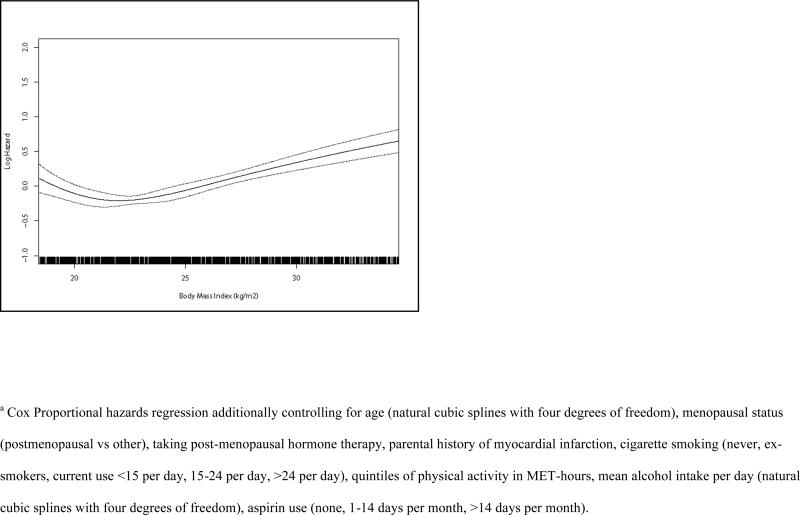
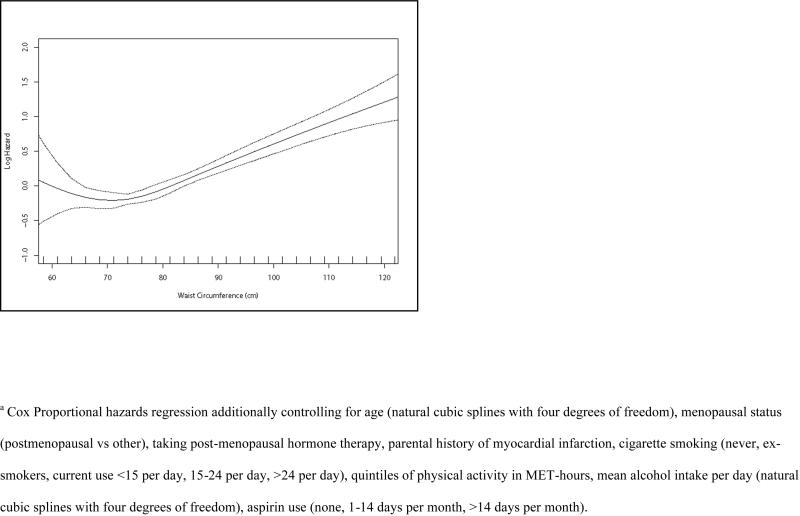
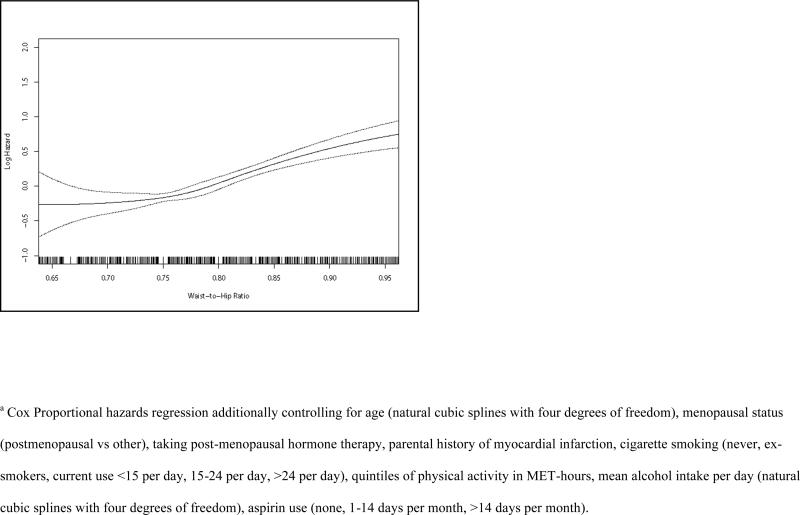
Table 3 shows the mean linear relationship between the anthropometric measures in 1986 and subsequent incidence of CHD. The mean hazard ratio of CHD was 1.046 (95% CI: 1.036, 1.056) per 0.01 increase in waist-height ratio, 1.027 (95% CI: 1.021, 1.033) per cm increase in waist circumference, 1.023 (95% CI: 1.017, 1.030) per 0.01 increase in waist-hip ratio, and 1.054 (1.039, 1.068) per kg/m2 increase in BMI, after adjustment for age, menopausal status, hormone therapy use, parental history of MI, smoking, physical activity, alcohol intake and aspirin use. Restricting the data to the middle 90 % of the respective anthropometric variable resulted in only small changes to respective hazard ratio, except for waist-hip ratio where the hazard ratio per 0.01 increase was 1.046 (1.030, 1.061). Further adjustment for covariates in the biological pathway relating adiposity to risk of CHD (history of diabetes, hypertension, and hypercholesterolemia) attenuated the hazard ratios for all measures (Table 3). Figures 3-6 show that linear approximations to the relationship between the anthropometric measures and CHD hazard were less than perfect, in that women with the smallest measurements did not necessarily have the lowest risk of CHD.
Table 3.
Hazard ratio (HR) of CHD and 95% confidence interval (CI) per unit size of each anthropometric measure, measured in 1986, among women in the Nurses’ Health Study
| Measure | Full dataset | Data truncated to 5th to 95th percentilesc |
|---|---|---|
| Waist-Height Ratio | Unit Size= 0.01 | Unit Size= 0.01 |
| No. of cases (1000-Person-years) | 790 (705) | 654 (639) |
| Unadjusted HR | 1.062 (1.053, 1.071) | 1.071 (1.056,1.086) |
| Age Adjusted HR (95%CI) | 1.050 (1.041, 1.060) | 1.048 (1.033,1.063) |
| Adjusted HRa (95%CI) | 1.046 (1.036, 1.056) | 1.044 (1.029,1.060) |
| Adjusted HRb (95%CI) | 1.028 (1.018, 1.039) | 1.028 (1.012,1.044) |
| Waist Circumference (cm) | Unit Size= 1 cm | Unit Size=1 cm |
| No. of cases (1000-Person-years) | 790 (705) | 674 (636) |
| Unadjusted HR | 1.036 (1.030, 1.041) | 1.039 (1.029, 1.048) |
| Age Adjusted HR (95%CI) | 1.029 (1.024, 1.035) | 1.025 (1.016, 1.035) |
| Adjusted HRa (95%CI) | 1.027 (1.021, 1.033) | 1.023 (1.013, 1.032) |
| Adjusted HRb (95%CI) | 1.016 (1.010, 1.022) | 1.014 (1.004, 1.023) |
| Waist-Hip Ratio | Unit Size= 0.01 | Unit Size= 0.01 |
| No. of cases (1000-Person-years) | 790 (705) | 670 (636) |
| Unadjusted HR | 1.033 (1.028, 1.039) | 1.082 (1.066, 1.097) |
| Age Adjusted HR (95%CI) | 1.028 (1.022, 1.034) | 1.057 (1.041, 1.073) |
| Adjusted HRa (95%CI) | 1.023 (1.017, 1.030) | 1.046 (1.030, 1.061) |
| Adjusted HRb (95%CI) | 1.015 (1.008, 1.022) | 1.033 (1.017, 1.049) |
| Body Mass Index | Unit Size= 1 kg/m2 | Unit Size= 1 kg/m2 |
| No. of cases (1000-Person-years) | 790 (705) | 658 (636) |
| Unadjusted HR | 1.059 (1.046, 1.072) | 1.074 (1.050,1.099) |
| Age Adjusted HR (95%CI) | 1.053 (1.039, 1.067) | 1.054 (1.029,1.079) |
| Adjusted HRa (95%CI) | 1.054 (1.039, 1.068) | 1.055 (1.030,1.080) |
| Adjusted HRb (95%CI) | 1.028 (1.013, 1.043) | 1.028 (1.003,1.053) |
Cox Proportional hazards regression additionally controlling for age (natural cubic splines with four degrees of freedom), menopausal status (postmenopausal vs other), taking post-menopausal hormone therapy, parental history of myocardial infarction, cigarette smoking (never, ex-smokers, current use <15 per day, 15-24 per day, >24 per day), quintiles of physical activity in MET-hours, mean alcohol intake per day (natural cubic splines with four degrees of freedom), aspirin use (none, 1-14 days per month, >14 days per month).
Additional adjustment for history of diabetes mellitus, history of hypertension, and history of hypercholesterolemia.
5th and 95th percentiles for Waist-Height Ratio are 0.39, 0.61; for Waist Circumference are 63.5 cm, 99.1 cm; for Waist-Hip Ratio are 0.69, 0.90; and for Body Mass Index are 19.4, 33.0 kg/m2
Unless stated otherwise otherwise, continuous covariates were modeled with natural cubic splines.
Figure 3.
Relationshipa between Waist Height Ratio in 1986 and subsequent hazard of Coronary Heart Disease among Women.
Figure 6.
Relationshipa between Body Mass Index (kg/m2) in 1986 and subsequent hazard of Coronary Heart Disease among Women.
In a sensitivity analysis that treated strokes and CHD as one outcome, the average adjusted rate ratio corresponding to each 0.01 increase in waist-height ratio was 1.035 (95% CI 1.028, 1.041).
Discussion
We found that the waist circumference-height ratio is comparable to waist circumference and waist-hip ratio, but superior to body mass index, for prediction of coronary heart disease incidence among middle aged women enrolled in the Nurses’ Health Study. A number of studies have now established that measures of abdominal adiposity are predictive of coronary heart disease independent of body mass index in women.11,21 More recently, some studies have indicated that waist-height ratio may be superior to BMI and waist-hip ratio in predicting levels of cardiovascular risk factors in some ethnic groups,7,9,22 and in men.22 Our study, done in middle-aged and older women of predominantly Caucasian race, did not find epidemiologically significant differences in predicting CHD between waist-height ratio, waist-hip or waist circumference.
It is possible that differences in the predictive power of waist-hip ratio between populations may in part be explained by variation in the angle between the sacrum (and pelvis) to the lumbar spine. In this study, we also found that excluding the lower and upper 5% of waist-hip ratio measurements resulted in meaningful differences in the size of the hazard ratios, relative to the using complete data. The influence of including the data at the ends of the distribution had a smaller influence on the size of the hazard ratios for other anthropometric measures. This may be related to errors in measurement of the hip circumference, which may be greater than errors in measuring height. An earlier study found that women reliably reported waist circumference, but underestimated hip circumference by an average of 1.4 cm (0.54 in).11 This study used heights measured 10 years earlier than the other measures. It has been found that on average, due to losses in bone mass, height decreases with age in post-menopausal women.23 This may also be a factor in the differences between the results of this study and those of studies done in other populations.
From the Cox regression analyses, we observed that, as expected, the average risk of CHD increase as each of the anthropometric measures increase. However, the relationship is relatively flat for the lowest levels of the measures as seen in Figures 3-6. This effect has also been observed in other studies of anthropometric measures24,25. This is consistent with a threshold, beyond which increasing adiposity increases risk of CHD. In addition, very low measurements of adiposity often suggest the presence of undernutrition or illness at the time of measurement. We were careful to exclude women who had prior history of heart disease, stroke, or cancer, but this does not rule out the possibility that some of the women may have had undiagnosed illness at the start of follow-up. An examination of the ROC curves (Figures 1,2) reveals that BMI was less discriminating at lower levels (upper regions of the curves) than were the waist-based measures.
To our knowledge, this is the first study to directly compare the areas under the ROC curve in predicting CHD for the various anthropometric measures among middle-aged and older women. Major strengths of this study are its prospective nature, and its consideration of covariates in the predictive ability of the anthropometric measures. A weakness of the study is that only one measurement was used for the various anthropometric measures, and the resultant measurement error may have led to attenuation of hazard ratio estimates. Given that our definition of CHD is very specific, outcome misclassification is likely to have caused minimal error on our estimates of hazard ratios.26 The range for areas under the ROC curve is 0-1, and values below 0.5 imply that the scale of measure should be reversed; the effective range is therefore 0.5 to 1. This fact suggests that differences in areas under the ROC curve may be more important, particularly at a population level, than the small values may suggest.
The Cox regression analyses assumed that censoring was uninformative. However, observations were censored in the case of cerebrovascular accidents, which share several similar risk factors as that for CHD. When we conducted a sensitivity analysis that treated strokes as part of the outcome, the adjusted rate ratio corresponding to each 0.01 increase in waist-height ratio was 1.035 (95% CI 1.028, 1.041) compared to the 1.046 (95% CI 1.036, 1.056) we found when censoring was treated as uninformative. Although attenuated, the substantive conclusion remains unchanged.
In efforts to prevent cardiovascular disease and diabetes mellitus, it is important to identify those with increased abdominal adiposity. Which waist circumference-based measure offers the best risk stratification remains to be decided. None of these measures was clearly superior to the others among the predominantly postmenopausal women in this study, and the favored measure will likely be determined primarily by ease of measurement. Further research is warranted to corroborate these findings in other populations.
Figure 4.
Relationshipa between Waist Circumference (cm) in 1986 and subsequent hazard of Coronary Heart Disease among Women.
Figure 5.
Relationshipa between Waist Hip Ratio in 1986 and subsequent hazard of Coronary Heart Disease among Women.
Acknowledgments
We are grateful to the participants in the Nurses’ Health Study for their continuing dedication and commitment.
Sources of Financial Support:
The work reported in this manuscript was supported by Public Health Service grant HL034594 from the National Heart Lung and Blood Institute, National Institutes of Health, Department of Health and Human Services. Dr John Page was partially supported by the American Heart Association award 0475016N.
References
- 1.Rimm EB, Willett WC, Hu FB, Sampson L, Colditz GA, Manson JE, Hennekens C, Stampfer MJ. Folate and vitamin B6 from diet and supplements in relation to risk of coronary heart disease among women. Jama. 1998;279(5):359–64. doi: 10.1001/jama.279.5.359. [DOI] [PubMed] [Google Scholar]
- 2.Larsson B, Svardsudd K, Welin L, Wilhelmsen L, Bjorntorp P, Tibblin G. Abdominal adipose tissue distribution, obesity, and risk of cardiovascular disease and death: 13 year follow up of participants in the study of men born in 1913. Br Med J (Clin Res Ed) 1984;288(6428):1401–4. doi: 10.1136/bmj.288.6428.1401. [DOI] [PMC free article] [PubMed] [Google Scholar]
- 3.Einstein FH, Atzmon G, Yang XM, Ma XH, Rincon M, Rudin E, Muzumdar R, Barzilai N. Differential responses of visceral and subcutaneous fat depots to nutrients. Diabetes. 2005;54(3):672–8. doi: 10.2337/diabetes.54.3.672. [DOI] [PubMed] [Google Scholar]
- 4.Barzilai N, She L, Liu BQ, Vuguin P, Cohen P, Wang J, Rossetti L. Surgical removal of visceral fat reverses hepatic insulin resistance. Diabetes. 1999;48(1):94–8. doi: 10.2337/diabetes.48.1.94. [DOI] [PubMed] [Google Scholar]
- 5.Bjorntorp P. Abdominal fat distribution and the metabolic syndrome. J Cardiovasc Pharmacol. 1992;20(Suppl 8):S26–8. [PubMed] [Google Scholar]
- 6.Gabriely I, Ma XH, Yang XM, Atzmon G, Rajala MW, Berg AH, Scherer P, Rossetti L, Barzilai N. Removal of visceral fat prevents insulin resistance and glucose intolerance of aging: an adipokine-mediated process? Diabetes. 2002;51(10):2951–8. doi: 10.2337/diabetes.51.10.2951. [DOI] [PubMed] [Google Scholar]
- 7.Tseng CH. Waist-to-height ratio is independently and better associated with urinary albumin excretion rate than waist circumference or waist-to-hip ratio in chinese adult type 2 diabetic women but not men. Diabetes Care. 2005;28(9):2249–51. doi: 10.2337/diacare.28.9.2249. [DOI] [PubMed] [Google Scholar]
- 8.Hsieh SD, Muto T. The superiority of waist-to-height ratio as an anthropometric index to evaluate clustering of coronary risk factors among non-obese men and women. Prev Med. 2005;40(2):216–20. doi: 10.1016/j.ypmed.2004.05.025. [DOI] [PubMed] [Google Scholar]
- 9.Sayeed MA, Mahtab H, Latif ZA, Khanam PA, Ahsan KA, Banu A, Azad Khan AK. Waist-to-height ratio is a better obesity index than body mass index and waist-to-hip ratio for predicting diabetes, hypertension and lipidemia. Bangladesh Med Res Counc Bull. 2003;29(1):1–10. [PubMed] [Google Scholar]
- 10.Willett W, Stampfer MJ, Bain C, Lipnick R, Speizer FE, Rosner B, Cramer D, Hennekens CH. Cigarette smoking, relative weight, and menopause. Am J Epidemiol. 1983;117(6):651–8. doi: 10.1093/oxfordjournals.aje.a113598. [DOI] [PubMed] [Google Scholar]
- 11.Rexrode KM, Carey VJ, Hennekens CH, Walters EE, Colditz GA, Stampfer MJ, Willett WC, Manson JE. Abdominal adiposity and coronary heart disease in women. Jama. 1998;280(21):1843–8. doi: 10.1001/jama.280.21.1843. [DOI] [PubMed] [Google Scholar]
- 12.Rimm EB, Stampfer MJ, Colditz GA, Chute CG, Litin LB, Willett WC. Validity of self- reported waist and hip circumferences in men and women. Epidemiology. 1990;1(6):466–73. doi: 10.1097/00001648-199011000-00009. [DOI] [PubMed] [Google Scholar]
- 13.Stampfer MJ, Willett WC, Speizer FE, Dysert DC, Lipnick R, Rosner B, Hennekens CH. Test of the National Death Index. Am J Epidemiol. 1984;119(5):837–9. doi: 10.1093/oxfordjournals.aje.a113804. [DOI] [PubMed] [Google Scholar]
- 14.Pepe MS. Oxford statistical science series. Vol. 28. Oxford University Press; Oxford ; New York: 2003. The statistical evaluation of medical tests for classification and prediction. [Google Scholar]
- 15.Zhou X-h, Obuchowski NA, McClish DK. Wiley series in probability and statistics. Wiley-Interscience; New York: 2002. Statistical methods in diagnostic medicine. [Google Scholar]
- 16.DeLong ER, DeLong DM, Clarke-Pearson DL. Comparing the areas under two or more correlated receiver operating characteristic curves: a nonparametric approach. Biometrics. 1988;44(3):837–45. [PubMed] [Google Scholar]
- 17.Collett D. Texts in statistical science. 2nd ed. Chapman & Hall/CRC; Boca Raton, FL: 2003. Modelling survival data in medical research. [Google Scholar]
- 18.Lachin JM. Wiley series in probability and statistics. Wiley; New York: 2000. Biostatistical methods : the assessment of relative risks. [Google Scholar]
- 19.Therneau TM, Grambsch PM. Statistics for biology and health. Springer; New York: 2000. Modeling survival data : extending the Cox model. [Google Scholar]
- 20.Hastie T, Tibshirani R, Friedman JH. Springer series in statistics. Springer; New York: 2001. The elements of statistical learning : data mining, inference, and prediction : with 200 full-color illustrations. [Google Scholar]
- 21.Hartz A, Grubb B, Wild R, Van Nort JJ, Kuhn E, Freedman D, Rimm A. The association of waist hip ratio and angiographically determined coronary artery disease. Int J Obes. 1990;14(8):657–65. [PubMed] [Google Scholar]
- 22.Hsieh SD, Yoshinaga H. Abdominal fat distribution and coronary heart disease risk factors in men-waist/height ratio as a simple and useful predictor. Int J Obes Relat Metab Disord. 1995;19(8):585–9. [PubMed] [Google Scholar]
- 23.Forsmo S, Hvam HM, Rea ML, Lilleeng SE, Schei B, Langhammer A. The Nord-Trondelag Health Study. 9. Vol. 18. Osteoporos Int; Norway: 2007. Height loss, forearm bone density and bone loss in menopausal women: a 15-year prospective study. pp. 1261–9. [DOI] [PubMed] [Google Scholar]
- 24.Zhang C, Rexrode KM, van Dam RM, Li TY, Hu FB. Abdominal obesity and the risk of all-cause, cardiovascular, and cancer mortality: sixteen years of follow-up in US women. Circulation. 2008;117(13):1658–67. doi: 10.1161/CIRCULATIONAHA.107.739714. [DOI] [PubMed] [Google Scholar]
- 25.Flegal KM, Graubard BI, Williamson DF, Gail MH. Cause-specific excess deaths associated with underweight, overweight, and obesity. Jama. 2007;298(17):2028–37. doi: 10.1001/jama.298.17.2028. [DOI] [PubMed] [Google Scholar]
- 26.Rothman KJ, Greenland S. Modern epidemiology. 2nd ed. Lippincott-Raven; Philadelphia, PA: 1998. [Google Scholar]


