Abstract
A systematic understanding of genotype-specific sensitivity or resistance to anticancer agents is required to provide improved patient therapy. The availability of an expansive panel of annotated cancer cell lines enables comparative surveys of associations between genotypes and compounds of various target classes. Thus, one can better predict the optimal treatment for a specific tumor. Here, we present a statistical framework, Cell Line Enrichment Analysis (CLEA), to associate the response of anticancer agents with major cancer genotypes. Multi-level omics data, including transcriptome, proteome and phosphatome data, were integrated with drug data based on the genotypic classification of cancer cell lines. The results reproduced known patterns of compound sensitivity associated with particular genotypes. In addition, this approach reveals multiple unexpected associations between compounds and mutational genotypes. The mutational genotypes led to unique protein activation and gene expression signatures, which provided a mechanistic understanding of their functional effects. Furthermore, CLEA maps revealed interconnections between TP53 mutations and other mutations in the context of drug responses. The TP53 mutational status appears to play a dominant role in determining clustering patterns of gene and protein expression profiles for major cancer genotypes. This study provides a framework for the integrative analysis of mutations, drug responses and omics data in cancers.
Keywords: Drug sensitivity and resistance, Cancer cell line modeling, Cancer genotype, Reverse phase protein assay, Network analysis
Introduction
Genotypic variation in cancer cells is a major cause of inconsistency in anticancer drug responses 1–3. Cancer cells exhibit extreme heterogeneity in terms of genomic mutations and DNA copy number (Fig. S1). Thus, understanding the relationship between genotypic variation and therapeutic compound responses is of critical importance for characterizing the mechanism of compound action and predicting the efficacy of compounds in individual cancer types and mutational backgrounds. Because collections of cell lines derived from human cancers also exhibit diverse genotypic variations, they could potentially provide a useful surrogate tool for studying genotype-dependent compound responses in cancers. However, previous efforts have mainly focused on the lineage-dependent association between cell lines and drug responses 4–5. The relationship between genotype and drug response has not been systematically analyzed due to the limited number of tested cell lines and lack of statistical confidence 6.
For example, the NCI60 data set, which includes over 40,000 compounds screened on 60 cell lines 7, has provided a useful resource for studying the cellular response of various chemical structures. Several studies proposed quantitative models on structure-activity relationships using NCI60 dataset, predicting cellular response of compounds with similar structural features 8–10. However, the varied response on diverse compounds has not been interpreted in terms of diversity of mutational genotypes in cancer cell lines. The number of cell lines and genotypic diversity in the NCI60 set is not sufficient for statistically analyzing the relationship between compound response and various cancer genotypes. Genotype-correlated sensitivity to 14 kinase inhibitors has been surveyed using a large number (~500) of cancer cell lines 11. It showed that several kinase inhibitors were highly sensitive to cancer mutations, such as EGFR, MET and BRAF. More recently, over 150 cancer cell lines have been simultaneously used for testing diverse classes of anticancer drugs and drug candidates 12. Omics data such as DNA microarray profiles for the cell lines were also included for an integrative analysis of drug response on selected lineages and genotypes of cancer. Although the data revealed many interesting patterns in the associations, they did not provide a quantitative and statistical measure on genotype-correlated drug sensitivity and gene expression.
It has been suggested that cell line modeling provides a promising tool for recapitulating the association of specific genotypes with drug sensitivity 13. In order to capture complex patterns of association of cancer genotypes with drug response and omics profiles, we need a systematic approach using an appropriate quantitative measure including a statistical confidence. In this study, we developed and implemented a tool to study the relationship between genotypes and compound responses by using a collection of compound screening data on a large, diverse and highly characterized set of cancer cell lines. We obtained the screening data, including a large collection of cell lines (over 300), for profiling the GI50 data of various anticancer compounds 11–12. Genotypic annotation (i.e., sense mutations and gene amplification) is also available from public 14 and internal resources for most of the tested cell lines. In addition, multi-level omics data, including transcriptome, proteome and phosphatome data for the majority of the cancer cell lines were collected for the identification of genotype-specific omics signatures and for better interpretation of genotype-specific compound responses. In order to quantitatively associate various experimental data (such as GI50, gene expression, and protein expression.) with genotypes, we designed a simple rank-based method, Cell Line Enrichment Analysis (CLEA). CLEA yields an enrichment score for the selected cellular property (genotype, lineage) against a given experimental observation (such as drug response, gene/protein expression or protein activation). A rank-based approach provides a consistent measure on heterogeneous data which have varied distributions on different experimental scales. It has been widely used in validating computer-based virtual screening processes in drug discovery. In order to provide a statistical confidence for this enrichment score, we designed a permutation analysis by random shuffling of cell line annotations, i.e., genotype or lineage.
The goal of this study was to provide tools able to recapitulate the association of genotypes with drug sensitivity and/or omics data files. As a proof of concept, we attempted to reproduce many known genotype-specific patterns of drug sensitivity, together with unexpected new association patterns. We also applied CLEA for the identification of genotype-specific signatures in gene expression, protein expression and protein activation. We expect that the present system-level study provides both novel tools and insights on genotype-based cancer therapy and biomarker discovery. Furthermore, it has applications in identifying and optimizing therapeutic windows of single or combined anticancer agents.
Materials and Methods
Data acquisition and generation
GI50 data of 34 compounds on various cell lines were obtained from Greshock and McDermott 11–12. Microarray gene expression data for 300 cell lines were obtained from Bioinformatics Grid™ (caBIG) of the National Cancer Institute (downloaded from https://cabig.nci.nih.gov/caArray_GSKdata/). This data set has 950 arrays performed in triplicate for each cell line. Additionally, the microarray gene expression data for the NCI60 set were obtained from Shankavaram 15. The data sets based on Affymetrix HG-U133A chips are available online at http://discover.nci.nih.gov/cellminer.
The RPPA (Reverse Phase Protein Array) data set was generated using a total of 170 cancer cell lines that were included in the compound screening and DNA microarray experiments. They were purchased from several vendors (American Type Culture Collection; Developmental Therapeutics Program, National Cancer Institute; German Resource Centre for Biological Material; and European Collection of Animal Cell Cultures) and grown to standard culture media recommended by the vendor. Genetic identity of cell lines were determined by cross comparing all cell lines in this set 11–12. Cells were maintained in RPMI 1640 supplemented with 5% fetal bovine serum at 37°C in a humidified 5% CO2 atmosphere. Proteins were harvested when the cells reached approximately 70% confluence. These cells were lysed in buffer containing 1% Triton X-100, 50 mM Hepes pH 7.4, 150 mM NaCl, 1.5 mM MgCl2, 1 mM EGTA, 100 mM NaF, 10 mM NaPPi, 10% glycerol, 1 mM Na3VO4 and Complete Protease Inhibitor Cocktail (Roche Diagnostics). Protein supernatants were isolated using standard methods 16, and protein concentration was determined using the BCA assay (Pierce). Samples were diluted to a uniform protein concentration and denatured in 1% SDS for 10 minutes at 95°C. Samples were stored at −80°C until use. RPPA analysis was performed as described previously 16–18. A logarithmic value reflecting the relative amount of each protein in each sample was generated for subsequent analyses. The RPPA analysis was performed using a total of 108 antibodies. The assignments of mutational genotypes for individual cell lines were determined based on the annotation of the COSMIC Sanger database. Genotypes were further confirmed by direct sequencing of target genes.
CLEA calculation
We designed a statistical analysis to associate experimental data (compound response (GI50), gene/protein expression or protein phosphorylation) with cancer lineages or genotypes (i.e., mutations). Each of tested cell lines were classified into pre-defined 13 lineages and 17 genotypes (Table S1). Since most cell lines contained mutations on multiple genes, each cell line was classified into multiple genotype categories. Minor mutational genotypes were excluded in the categories for the statistical confidence of the analysis. To quantify the association between the experimental observation (GI50G, gene/protein expression or protein phosphorylation) and a lineage (or a genotype), a prioritization score of given lineage (or genotype) on the experimental observation was calculated. For example, the prioritization of cell lines of a particular genotype for the given experiment (e.g., GI50) was analyzed on a Receiver Operator Curve (ROC) plot 19. Ranking the cell lines, starting with the cell line most sensitive to a given drug (or gene/protein expression, protein phosphorylation), was used to generate ROC curves (See details in Figure S2). A ROC curve describes the tradeoff between sensitivity and specificity. Sensitivity is defined as the ability of the model to avoid “false negatives” (i.e., where a cell line without the mutational genotype is a good responder to the experiment), while specificity relates to its ability to avoid “false positives” (i.e., where a cell line with the mutational genotype is a poor responder). Thus, the area under the ROC curve (AUC) is a measure of accuracy in the association of the genotype to the given experimental condition. An AUC value of 0.5 represents no association, while 1.0 represents perfect association. The AUC of the ROC plot is a measure of “sensitivity” or “resistance” of a given genotype to a drug. Number of cell lines in classes of lineages and genotypes are varied, thus the statistical significance (p-value) for the AUC score is assigned through permutation tests by repeating random shuffling of the ranked list of a lineage or a genotypes 1,000 times. For DNA microarray data, we carried out 100-time permutation, due to the overwhelming number of associations for each of >40,000 gene probes. We calculated AUC and its p-value for every lineage and genotype on drug data, gene/protein expression and protein phosphorylation data, independently.
Network analysis
In the analysis of drug response data, Pearson’s correlation coefficient (PCC) between mutational genotypes were calculated using the CLEA values (−log p-value) of the 34 compounds on cancer genotypes. The PCC cutoff values for a link were 0.4 and −0.4 for positive and negative correlations, respectively. The compound, gene and protein signatures that shared a common genotype association as determined through the CLEA calculation were integrated. Pearson’s correlation coefficient (PCC) and its p-value between compound and omics signatures were calculated using the −log(p value) of the AUC values derived from the CLEA calculation. Genes and proteins with a significant correlation to a compound (p<0.01) were selected. In addition, the PCC cutoff values of genes for a link were 0.85 and −0.85 for positive and negative correlations, respectively. Finally, the network was constructed for the selected 1170 links between compounds and omics signatures using the Cytoscape tool 20. In the analysis of the phosphatome data, the Forced-Directed layout algorithm within Cytoscape was used to optimize the network topology based on the PCC values. Only significant PCCs (p<0.01) were selected for the positive and negative correlations, respectively.
Results and Discussion
Genotype-dependent drug response
We integrated the GI50 profile of 34 compounds on 310 human cancer cell lines. These compounds are known to interact with major cancer targets, such as PI3K, IGF1R, VEGFR, ERBB, AKT and MEK (Table S2) 11–12. Individual compounds showed a wide range of GI50 values on the tested cell lines (Fig. S3). For example, compounds such as paclitaxel and GSK637 showed consistently low GI50 values on most cell lines, while other compounds exhibited highly selective inhibitory effects (low GI50) on only a small number of cell lines. Compounds such as GSK212 (MEK inhibitor), GSK916 (AURK inhibitor) and temsirolimus (mTOR inhibitor) showed extreme selectivity in the tested cell lines. This result is compatible with the recent trend of target-oriented design of anticancer agents, which results in a narrow range of sensitivity in a collection of cancer cell lines.
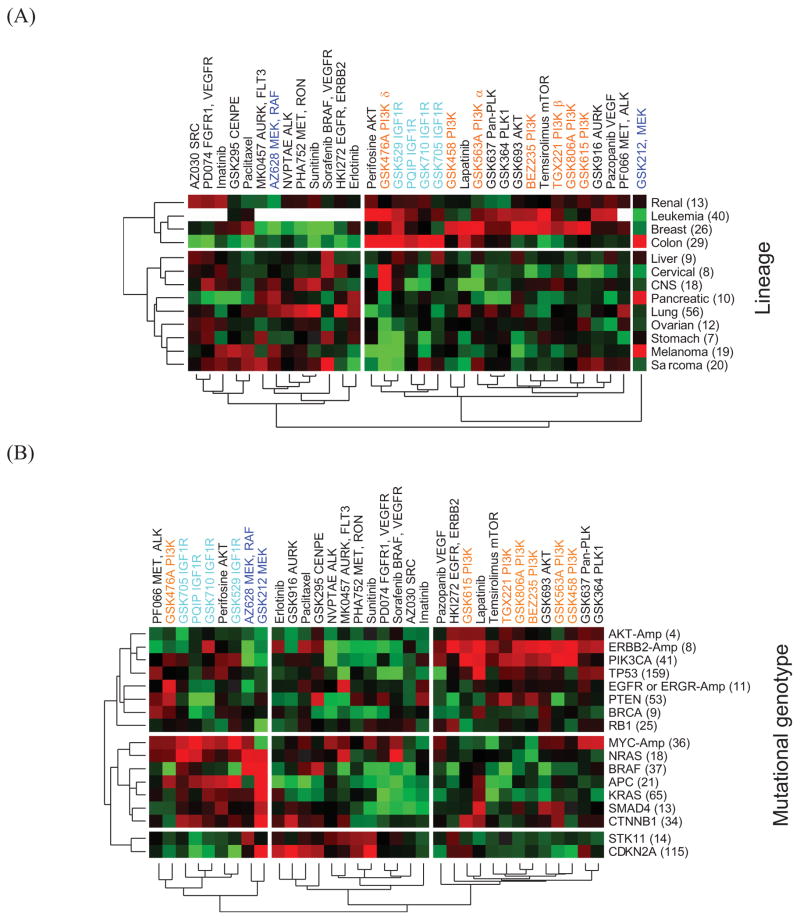
In this study, we quantitatively determined the association of compound response with lineage and genotype using CLEA on a large dataset of GI50 results. A total of 17 genomic aberrations, including mutations and copy number amplification, were used to classify 310 cell lines into different cancer genotypes in addition to a lineage-based classification (Table S3). First, the 310 cell lines were classified into 13 lineage classes, and their CLEA map for 34 given compounds was calculated. The lineage-based CLEA map separated compounds into two major groups (Fig. 1A). Many different target classes of compounds, including IGFR and PI3K inhibitors, were clustered together, exhibiting common sensitivity in breast and leukemia cell lines. In general, compounds with different targets did not show distinguishable associations with lineage classes. In addition, two putative MEK inhibitors, GSK212 and AZ628, showed different patterns of lineage association, potentially due to different off-target activities or different pharmacological activities. GSK212 was uniquely active in colon, pancreas and melanoma cell lines, while AZ628 showed no selectivity in colon lines but was active in CNS, lung and sarcoma lines. These results indicate that the lineage-based association study does not provide a general insight into the mechanism of compound action.
Figure 1. Genotype-based CLEA map for 34 compounds.
The −log(p-value) of the AUC is represented in different colors. Red represents a positive association of a drug with a cell line class, while green represents a negative association. Each cell line was combined into lineage or genotypes using CLEA method. The lineage association map is shown in (A), and the genotype-based association is shown in (B). The number within the bracket (x-axis) represents the total number of cell lines in the category.
The CLEA map for the 34 compounds was generated using 17 genotypic categories (Fig. 1B). Compounds sharing a common target class showed a similar association profile on a number of cancer cell genotypes. The genotype-based CLEA map separated compounds into three major groups in which IGF1R and PI3K compounds showed expected and distinguishable association patterns with cancer genotypes. Interestingly, the genotype associations for less sensitive compounds (middle of Fig. 1B) were weak, including the AURK inhibitors, sunitinib, sorafenib and Met compounds. Generally, genotype association was strong for the PI3K, IGF1R and MEK compounds. MYC amplification (MYC-Amp) and the NRAS mutation were shown to be major genotypes for which IGF1R inhibitors had significant selectivity. In contrast, the ERBB2-Amp and PIK3CA mutant lines were highly sensitive to most PI3K compounds. The only exception was GSK478A, which targets PI3K delta and has a unique association with EGFR mutations. The MEK inhibitors AZ628 and GSK212 clustered together in this analysis, exhibiting common sensitivity to NRAS and BRAF mutations. These data correlate with evidence that BRAF mutations predict sensitivity to MEK inhibition, and this dependency is independent of tissue lineage 21. In the present study, we found that GSK212 shows additional selective activity in other genotypes, including APC, KRAS, CTNNB1 and CDKN2A mutations. This additional sensitivity of GSK212 might cause the discordance between the activities of the two MEK inhibitors in the lineage-dependent CLEA map. These data suggest that the dependency on MEK activity offers a rational therapeutic strategy for these genetically defined tumor subtypes. The clustering pattern in Fig. 1B indicates that the present genotype-based CLEA method provides a novel, useful tool for identifying sensitive (or resistant) genotypes for a compound and, thus, can potentially be used for optimizing the therapeutic selection of anticancer compounds in clinical applications.
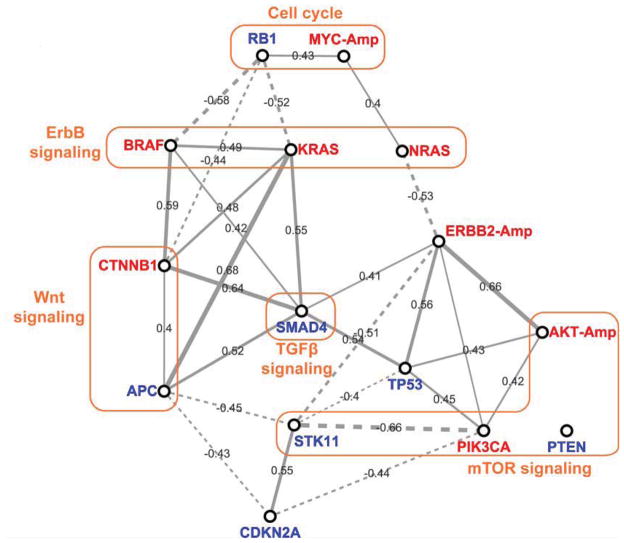
In order to further analyze the compound response among different mutational genotypes, pair-wise correlations between mutation groups were calculated using their CLEA values on 34 compounds (Fig. 2). In general, positive correlations were observed among oncogenic mutations, while negative correlations exist between a tumor suppressor and an oncogene. Additionally, mutations in common signaling pathways were relatively well correlated with their compound responses. Furthermore, the drug response of the BRAF and KRAS mutations in the ErbB signal pathway were positively correlated to that of the CTNNB1 and APC mutations in the Wnt signaling pathway. The mutation of APC, a tumor suppressor in the TGFβ signaling pathway, was strongly correlated with the KRAS oncogenic mutation, which may account for the apparent sensitivity of cells with APC mutations, for example with the MEK inhibitor (GSK212) and the broad activity of the IGF1R inhibitors (Fig. 1B). The mutation of RB1 in the cell cycle pathway was negatively correlated with mutations in the ErbB and Wnt signaling pathways in terms of compound response. The compound response of cells with STK11 (LKB1) mutations was negatively correlated to that of cells with mutations in the mTOR pathway, such as PIK3CA. The STK11 mutation was also negatively correlated to many other mutations, such as ERBB2-Amp, APC and TP53. A logical inference from these observations is that compounds with selectivity for cells with RB1 or STK11 mutations might be good candidates for combination with inhibitors of the ErbB and PI3K/mTOR pathways, thus improving their anticancer efficacy.
Figure 2. Correlation network of mutational genotypes.
Pearson’s correlation coefficient (PCC) values between genotypes was calculated using the CLEA values (−log p-value) of the 34 compounds in Fig. 1B. The PCC cutoff values for a link are 0.4 and −0.4 for positive and negative correlations, respectively. The varied thickness of the links between the genotype nodes quantitatively represents PCCs. Red represents oncogenes, and blue represents repressors.
TP53 dependency in compound response
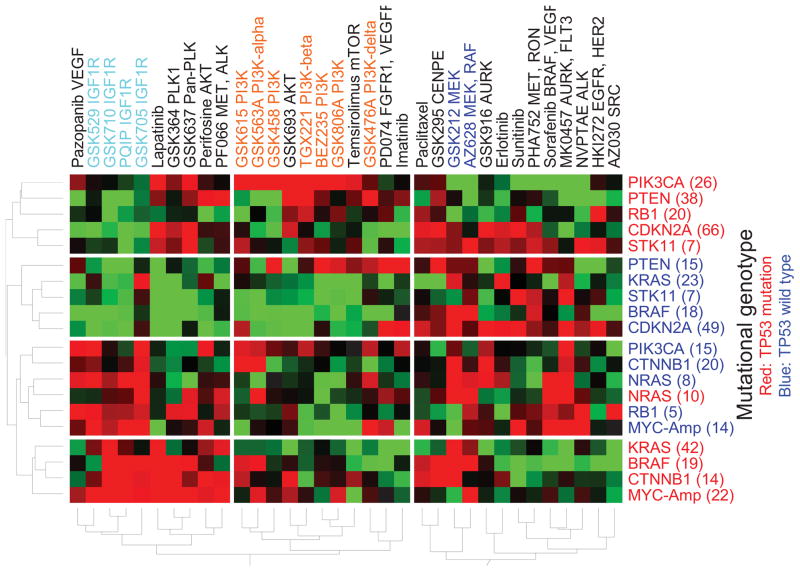
Genotypic categories can be further divided by combining different mutations, thus assessing the effects of coordinate mutations in single tumors. The activation of oncogenes by nonsynonymous mutations or copy gains is often considered independently. However, results from Modrek et al. (2009) suggest that activating mutations and copy gains may often occur within the same tumor. Survey data in Fig. S1 show that mutation of TP53 is frequent in all major cancer lineages. To reflect this observation, we divided each of the genotypic categories in Fig. 1B into two groups: one with TP53 mutations and the other without TP53 mutations. A genotype-based CLEA map for the 34 compounds was recalculated using 20 categories of combined mutations (Fig. 3). Strikingly, the inclusion of the TP53 co-mutation improved the clustering of most compounds based on their target classes, such as IGF1R, AKT, PLK, MEK and PI3Ks, suggesting that TP53 mutations alter the response to multiple classes of targeted therapeutics. Furthermore, the response of the different genotypic classes clustered based on the existence of a TP53 co-mutation. With the exception of NRAS mutations, all genotypes showed TP53 mutation-dependent classification patterns.
Figure 3. Genotype-based CLEA maps for compound response.
The drug response is associated with co-mutational genotypes. The −log(p-value) of the AUC is represented in different colors. Red represents a positive association of a drug with a cell line class, while green represents a negative association.
PI3K, mTOR and AKT inhibitors were highly correlated with PI3KCA mutation status when TP53 was co-mutated, but less so when wild type TP53 was present. IGF1R inhibitors were highly active in cells with NRAS and RB1 mutations and wild type TP53 compared to cells with mutant TP53. Three IGF1R inhibitors were also active in cells with BRAF and CTNNB1 mutations when TP53 was co-mutated. Interestingly, lapatinib was active in most mutational categories with TP53 co-mutation, while MK0467, AURK and FLT3 inhibitors were exclusively active in cells without TP53 co-mutation. This result supports the fact that lapatinib was selectively active in cells with TP53 mutations but that MK0467, AURK and FLT3 inhibitors were inactive in the same cell sets. Thus, the genotype-based sensitivity to compounds in many classes of targeted therapeutics is highly dependent on the co-mutational status of TP53. TP53 plays a critical role in the progression in most cancer lineages 22–24. CLEA maps showed that consideration of the co-mutational status of TP53 in various cancer genotypes is of critical importance in evaluating the sensitivity of target-oriented compounds in cancer therapy.
In contrast, the activity of MEK inhibitors was relatively independent of TP53 co-mutation. GSK212 and AZ628 showed activity against cell lines with BRAF and NRAS mutations, which was independent of TP53 mutational status. GSK212 showed activity against KRAS and CTNNB1 mutations, regardless of TP53 mutational status. MYC-Amp cell lines were consistently sensitive to IGF1R inhibitors, regardless of TP53 mutations status. Previous studies have shown that MYC expression is disrupted by IGF1R inhibition 25–26. The present analysis, which demonstrates that MYC amplification can predict TP53-independent sensitivity to IGF1R inhibitors in cancer cells, corroborates this observation.
Genotype-based analysis of omics data
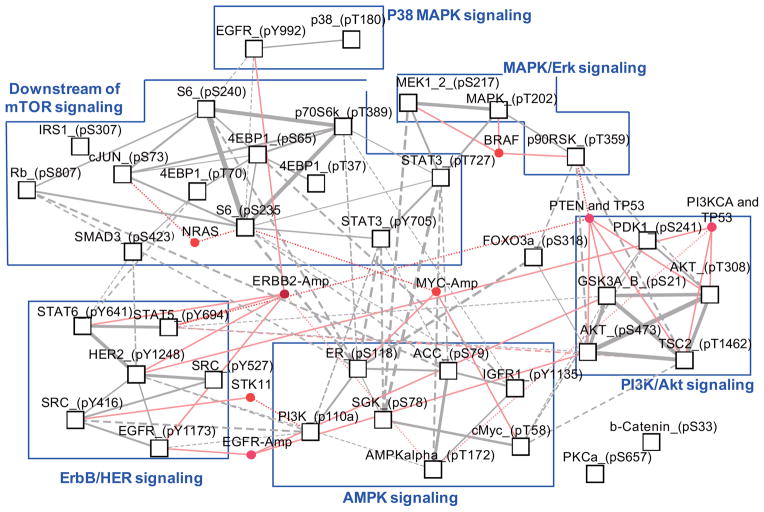
In addition to compound responses, a genotype-based CLEA map for protein activation was generated using the RPPA data for 32 independent phosphoproteins (Fig. S4). As indicated above, with drug response, the mutational status of TP53 plays a major role in determining the sensitivity of many genotypes. In contrast, protein phosphorylation patterns were relatively consistent in a genotype, regardless of the mutational status of TP53. Overall, the major signaling network-specific signatures were clustered together in the present genotypic categories (Fig. 4). Proteins associated with the PI3K/AKT signaling network (phospho GSK3, TSC2, AKT and PDK1) were specifically activated in cell lines that contained a PTEN or PIK3CA mutation with a TP53 co-mutation. The genotypic association of these signatures was consistent with their sensitivity to the PI3K inhibitors (Fig. 3). These data provide evidence that sensitivity to PI3K inhibitors in a given genotype is related to the signaling cascades reflected by these four signature phosphorylation events. MEK1, MAPK and p90RSK signatures of MAPK/Erk signaling networks clustered together with BRAF mutations. Their phosphorylation pattern was not dependent on the mutational status of TP53, thus explaining the TP53-independent sensitivity of MEK inhibitors in BRAF mutations. IGF1R inhibitors were highly associated with MYC-amp genotypes (Fig. 3). The phosphorylation of cMYC and ER was highly associated with the MYC-amp genotype, as expected. In addition, SGK and IGFR1 were shown to be specifically activated in MYC-amp genotypes (Fig. S4). SGK has been reported to play a role in cMYC stabilization 27. Network analysis showed that SGK phosphorylation is directly correlated with MYC activity (Fig. 4). The ERBB2-amp genotype was associated with the phosphorylation of many proteins in the ErbB/HER signaling networks.
Figure 4. Correlation network of genotype-dependent protein phosphorylation.
PCC values between phospho-proteins were calculated using the CLEA values [−log(p-value)] of the 34 compounds in Fig. S3. Only significant PCCs (p<0.01) were selected for the positive and negative correlations, respectively. The varied thickness of the links between the phospho-protein nodes quantitatively represents PCCs. Nodes and links in red represent genotypes that are significantly (p<0.01) associated with protein phosphorylation.
The expression of 76 cancer-related proteins was also analyzed against mutational genotypes using the CLEA method. The overall association of protein expression with mutant genotypes was dependent on the co-mutational status of TP53 (Fig. S5). Many different genotypes clustered together based on the mutational status of TP53. In wild type TP53 cell lines, mutations such as CTNNB1, KRAS, PIK3CA, CDKN2A and STK11 were enriched with respect to the over-expression of signatures in the cell cycle signaling network (Rb, Cyclin D1, p21, c-Myc and β-Catenin). MYC-amp and NRAS mutations were highly associated with high levels of proteins in the MAPK and apoptosis signaling networks (JNK2, HER2, ER, Stathamin, Caspase7, BIM, cKIT, FOXO3α and Caspase3), which were also independent of the TP53 genotype.
A CLEA map of gene expression was also produced using microarray data for the 310 cell lines. A total of 1,722 gene probes showed a significant (p<0.01 and AUC>80) association with a particular genotype (Fig. S6A). In general, the gene expression data separated the genotypes into clusters based on the mutational status of TP53. When we selected 252 gene probes with consistent patterns (p<0.01) of genotype association between the GSK and NCI60 data sets, they clearly separated based on the mutational status of TP53 (Fig. S6B). Most of selected 252 gene signatures that had significant association with mutational genotypes were involved in cancer-related pathways when they were analyzed against the KEGG pathway database (i.e., p53 signaling pathway, focal adhesion, cell cycle, MAPK signaling pathway, apoptosis, ERBB signaling pathway, PI3K signaling pathway, mTOR signaling pathway) (Table S4). Interestingly, genes involved in p53 signaling and cancer pathways were the most abundant in the selected genotype-specific gene signatures. These observations confirm that the mutational status of TP53 plays a major role in the genotype-based classification of transcriptome data.
Integration of compound and omics data
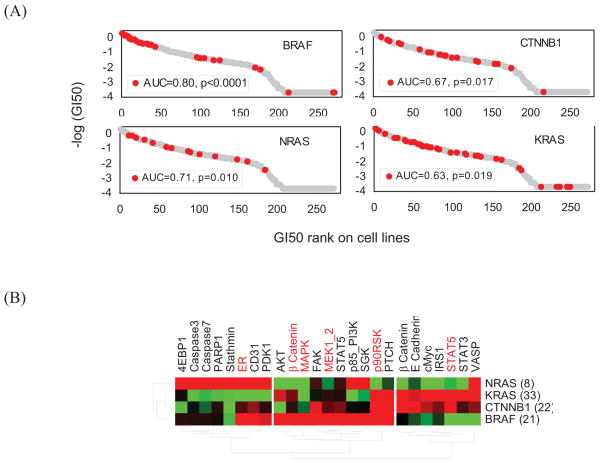
In this study, we demonstrated that CLEA provides a novel and general tool for the analysis and integration of cancer mutations, compound responses and omics profile data. For example, the sensitivity of the MEK inhibitor GSK212 was associated with the NRAS, KRAS and CTNNB1 genotypes in addition to the BRAF genotype (Fig. 3 and 5A) and was not dependent on the mutational status of TP53. From the integrative CLEA analysis of the protein expression and phosphorylation data sets, the ErbB, MAPK and mTOR signaling networks were classified into three groups based on genotype-based specificity (Fig. 4 and 5B). KRAS and CTNNB1 mutations showed a similar profile to each other in protein signatures, while NRAS and BRAF mutations had unique signature proteins. 4EBP1, Caspase3, Caspase7 and Stathmin were highly associated with the NRAS mutation. The phosphorylation or expression of ER, PDK1, p85PI3K and SGK was up-regulated in both NRAS and BRAF mutations. AKT, β-catenin, MAPK, FAK and MEK1/2 were uniquely associated with BRAF mutations. p90RSK and PTCH were up-regulated in association with KRAS, CTNNB1 and BRAF mutations. In the case of KRAS or CTNNB1 mutations, β-catenin, E Cahedrin, cMyc and STAT were exclusively up-regulated.
Figure 5. Genotypic association of GSK 212 and protein signatures.
(A) The four genotypes that are most highly associated with GSK212 (MEK inhibitor) are shown. (B) The CLEA of protein expression (black) and protein phosphorylation (red) is shown for the four selected genotypes. The −log(p-value) of the AUC is represented in different colors. All proteins on the map have a p-value < 0.05 in at least one of the four selected genotypes. Red represents a positive association of protein expression with a cell line class, while green represents a negative association.
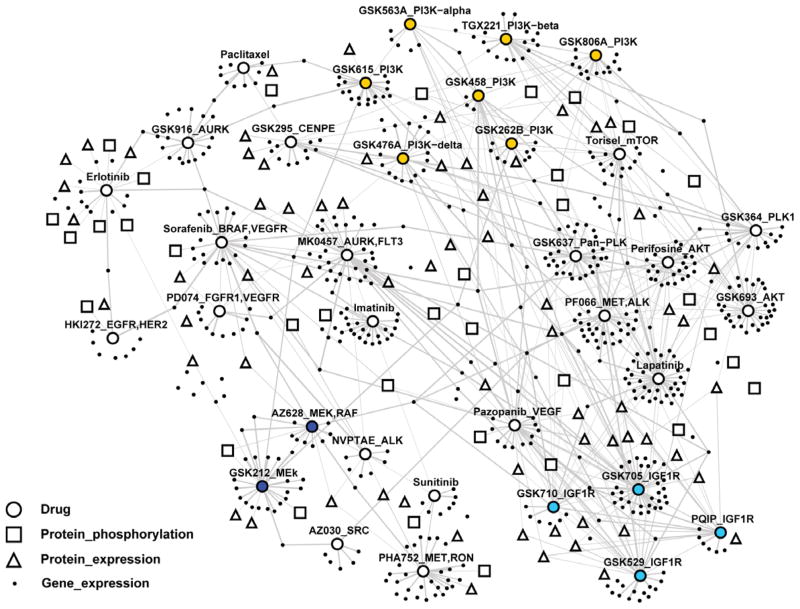
In conclusion, CLEA enables associations to be made between mutational genotypes and compound responses, transcriptome data and proteomics data with high statistical confidence. Using the p-value of the association between a genotype and experimental data, we generated a network that integrates compound and omics data based on the similarity of genotype association (Fig. 6). This network reveals drug-oriented clustering of omics signatures for cancer genotypes. A complete list of gene and protein signatures for individual clusters of compounds is available in Table S4 and provides direct clues on how genotype-specific signatures in diverse cancer pathways are correlated to compound responses, thus providing insights on the mechanism of action of the tested drugs.
Figure 6. Integrated correlation network of compound and omics data.
The genes and proteins that show a significant correlation (p<0.01) with a compound in the CLEA maps are linked with the compound in the network. Groups of blue, sky blue and orange colors represent drugs targeting MEK, IGF1R and PI3K proteins, respectively. Complete list of drugs, genes and proteins are available in Table S4.
Supplementary Material
Statements.
Unexpected drug efficacy or resistance has been poorly understood in cancers due to the lack of systematic analysis of drug response profiles on cancer tissues that have various genotypic backgrounds. In this study, we present an integrative profiling system to correlate cancer genotypes with drugs, gene expression and protein regulation using a large collection of cancer cell lines, drug data and omics data, thus providing a surrogate system to predict the genotype-dependent response of targeted therapies in patients.
Acknowledgments
The authors thank Hyun-Young Lee for her professional work in improving the graphic quality and visibility of the figures. This work was supported by the National Research Foundation of Korea (KRF) grants funded by Korea government (MEST) (No. 2009-0076307), NLRL program (No. 2011-0028816) and SRC program (No. R11-2005-017-04003-0). This study was also supported by a grant from the National R&D Program for Cancer Control, Ministry for Health and Welfare, Republic of Korea (No. 1020200). This study was support by CCSG grant P30 CA16672-34, Stand Up to Cancer Dream Team Translational Research Grant, a Program of the Entertainment Industry Foundation (SU2C-AACR-DT0209), U54CA112970 grant to GBM, and sponsored research from GSK, AstraZeneca and Wyeth/Pfizer to GBM. JG and RW are employees of GlaxoSmithKlein (GSK).
Abbreviations
- CLEA
Cell Line Enrichment Analysis
- RPPA
Reverse Phase Protein Assay
- ROC
Receiver Operator Curve
- AUC
Area Under the Curve
- PCC
Pearson’s Correlation Coefficient
Footnotes
- SAB/Consultant: Asuragen, Aushon, Catena, Daiichi Pharmaceutical, Foundation Medicine, Komen Foundation
- Stock/ Options/Financial: Catena, PTV Ventures
- Sponsored research: AstraZeneca, Celgene, CeMines, Exelixis, GSK, LPATH, Roche, SDI, Wyeth/Pfizer
GM will discuss off label use and/or investigational use of drugs. JG and RW are employees and shareholders of GlaxoSmithKline.
References
- 1.Danesi R, de Braud F, Fogli S, de Pas TM, Di Paolo A, Curigliano G, Del Tacca M. Pharmacogenetics of anticancer drug sensitivity in non-small cell lung cancer. Pharmacol Rev. 2003;55:57–103. doi: 10.1124/pr.55.1.4. [DOI] [PubMed] [Google Scholar]
- 2.Cheok MH, Evans WE. Acute lymphoblastic leukaemia: a model for the pharmacogenomics of cancer therapy. Nat Rev Cancer. 2006;6:117–29. doi: 10.1038/nrc1800. [DOI] [PubMed] [Google Scholar]
- 3.Marsh S, McLeod HL. Pharmacogenomics: from bedside to clinical practice. Hum Mol Genet. 2006;15(Spec No 1):R89–93. doi: 10.1093/hmg/ddl087. [DOI] [PubMed] [Google Scholar]
- 4.Amatschek S, Koenig U, Auer H, Steinlein P, Pacher M, Gruenfelder A, Dekan G, Vogl S, Kubista E, Heider KH, Stratowa C, Schreiber M, et al. Tissue-wide expression profiling using cDNA subtraction and microarrays to identify tumor-specific genes. Cancer Res. 2004;64:844–56. doi: 10.1158/0008-5472.can-03-2361. [DOI] [PubMed] [Google Scholar]
- 5.Dawany NB, Tozeren A. Asymmetric microarray data produces gene lists highly predictive of research literature on multiple cancer types. BMC Bioinformatics. 2010;11:483. doi: 10.1186/1471-2105-11-483. [DOI] [PMC free article] [PubMed] [Google Scholar]
- 6.Di Nicolantonio F, Arena S, Gallicchio M, Zecchin D, Martini M, Flonta SE, Stella GM, Lamba S, Cancelliere C, Russo M, Geuna M, Appendino G, et al. Replacement of normal with mutant alleles in the genome of normal human cells unveils mutation-specific drug responses. Proc Natl Acad Sci U S A. 2008;105:20864–9. doi: 10.1073/pnas.0808757105. [DOI] [PMC free article] [PubMed] [Google Scholar]
- 7.Shoemaker RH. The NCI60 human tumour cell line anticancer drug screen. Nat Rev Cancer. 2006;6:813–23. doi: 10.1038/nrc1951. [DOI] [PubMed] [Google Scholar]
- 8.Wan P, Li Q, Larsen JE, Eklund AC, Parlesak A, Rigina O, Nielsen SJ, Bjorkling F, Jonsdottir SO. Prediction of drug efficacy for cancer treatment based on comparative analysis of chemosensitivity and gene expression data. Bioorg Med Chem. 2012;20:167–76. doi: 10.1016/j.bmc.2011.11.019. [DOI] [PubMed] [Google Scholar]
- 9.Shivakumar P, Krauthammer M. Structural similarity assessment for drug sensitivity prediction in cancer. BMC Bioinformatics. 2009;10 (Suppl 9):S17. doi: 10.1186/1471-2105-10-S9-S17. [DOI] [PMC free article] [PubMed] [Google Scholar]
- 10.Tiikkainen P, Poso A, Kallioniemi O. Comparison of structure fingerprint and molecular interaction field based methods in explaining biological similarity of small molecules in cell-based screens. J Comput Aided Mol Des. 2009;23:227–39. doi: 10.1007/s10822-008-9253-0. [DOI] [PubMed] [Google Scholar]
- 11.McDermott U, Sharma SV, Dowell L, Greninger P, Montagut C, Lamb J, Archibald H, Raudales R, Tam A, Lee D, Rothenberg SM, Supko JG, et al. Identification of genotype-correlated sensitivity to selective kinase inhibitors by using high-throughput tumor cell line profiling. Proc Natl Acad Sci U S A. 2007;104:19936–41. doi: 10.1073/pnas.0707498104. [DOI] [PMC free article] [PubMed] [Google Scholar]
- 12.Greshock J, Bachman KE, Degenhardt YY, Jing J, Wen YH, Eastman S, McNeil E, Moy C, Wegrzyn R, Auger K, Hardwicke MA, Wooster R. Molecular target class is predictive of in vitro response profile. Cancer Res. 2010;70:3677–86. doi: 10.1158/0008-5472.CAN-09-3788. [DOI] [PubMed] [Google Scholar]
- 13.Settleman J. Cell culture modeling of genotype-directed sensitivity to selective kinase inhibitors: targeting the anaplastic lymphoma kinase (ALK) Semin Oncol. 2009;36:S36–41. doi: 10.1053/j.seminoncol.2009.02.006. [DOI] [PubMed] [Google Scholar]
- 14.Bamford S, Dawson E, Forbes S, Clements J, Pettett R, Dogan A, Flanagan A, Teague J, Futreal PA, Stratton MR, Wooster R. The COSMIC (Catalogue of Somatic Mutations in Cancer) database and website. Br J Cancer. 2004;91:355–8. doi: 10.1038/sj.bjc.6601894. [DOI] [PMC free article] [PubMed] [Google Scholar]
- 15.Shankavaram UT, Reinhold WC, Nishizuka S, Major S, Morita D, Chary KK, Reimers MA, Scherf U, Kahn A, Dolginow D, Cossman J, Kaldjian EP, et al. Transcript and protein expression profiles of the NCI-60 cancer cell panel: an integromic microarray study. Mol Cancer Ther. 2007;6:820–32. doi: 10.1158/1535-7163.MCT-06-0650. [DOI] [PubMed] [Google Scholar]
- 16.Vasudevan KM, Barbie DA, Davies MA, Rabinovsky R, McNear CJ, Kim JJ, Hennessy BT, Tseng H, Pochanard P, Kim SY, Dunn IF, Schinzel AC, et al. AKT-independent signaling downstream of oncogenic PIK3CA mutations in human cancer. Cancer Cell. 2009;16:21–32. doi: 10.1016/j.ccr.2009.04.012. [DOI] [PMC free article] [PubMed] [Google Scholar]
- 17.Stemke-Hale K, Gonzalez-Angulo AM, Lluch A, Neve RM, Kuo WL, Davies M, Carey M, Hu Z, Guan Y, Sahin A, Symmans WF, Pusztai L, et al. An integrative genomic and proteomic analysis of PIK3CA, PTEN, and AKT mutations in breast cancer. Cancer Res. 2008;68:6084–91. doi: 10.1158/0008-5472.CAN-07-6854. [DOI] [PMC free article] [PubMed] [Google Scholar]
- 18.Tibes R, Qiu Y, Lu Y, Hennessy B, Andreeff M, Mills GB, Kornblau SM. Reverse phase protein array: validation of a novel proteomic technology and utility for analysis of primary leukemia specimens and hematopoietic stem cells. Mol Cancer Ther. 2006;5:2512–21. doi: 10.1158/1535-7163.MCT-06-0334. [DOI] [PubMed] [Google Scholar]
- 19.Hand DJ, Mannila H, Smyth P. Principles of data mininged. Cambridge, Mass: MIT Press; 2001. [Google Scholar]
- 20.Shannon P, Markiel A, Ozier O, Baliga NS, Wang JT, Ramage D, Amin N, Schwikowski B, Ideker T. Cytoscape: a software environment for integrated models of biomolecular interaction networks. Genome Res. 2003;13:2498–504. doi: 10.1101/gr.1239303. [DOI] [PMC free article] [PubMed] [Google Scholar]
- 21.Solit DB, Garraway LA, Pratilas CA, Sawai A, Getz G, Basso A, Ye Q, Lobo JM, She Y, Osman I, Golub TR, Sebolt-Leopold J, et al. BRAF mutation predicts sensitivity to MEK inhibition. Nature. 2006;439:358–62. doi: 10.1038/nature04304. [DOI] [PMC free article] [PubMed] [Google Scholar]
- 22.Carson DA, Lois A. Cancer progression and p53. Lancet. 1995;346:1009–11. doi: 10.1016/s0140-6736(95)91693-8. [DOI] [PubMed] [Google Scholar]
- 23.Hainaut P, Hollstein M. p53 and human cancer: the first ten thousand mutations. Adv Cancer Res. 2000;77:81–137. doi: 10.1016/s0065-230x(08)60785-x. [DOI] [PubMed] [Google Scholar]
- 24.Petitjean A, Achatz MI, Borresen-Dale AL, Hainaut P, Olivier M. TP53 mutations in human cancers: functional selection and impact on cancer prognosis and outcomes. Oncogene. 2007;26:2157–65. doi: 10.1038/sj.onc.1210302. [DOI] [PubMed] [Google Scholar]
- 25.Misawa A, Hosoi H, Arimoto A, Shikata T, Akioka S, Matsumura T, Houghton PJ, Sawada T. N-Myc induction stimulated by insulin-like growth factor I through mitogen-activated protein kinase signaling pathway in human neuroblastoma cells. Cancer Res. 2000;60:64–9. [PubMed] [Google Scholar]
- 26.Coulter DW, Wilkie MB, Moats-Staats BM. Inhibition of IGF-I receptor signaling in combination with rapamycin or temsirolimus increases MYC-N phosphorylation. Anticancer Res. 2009;29:1943–9. [PubMed] [Google Scholar]
- 27.Huang M, Kamasani U, Prendergast GC. RhoB facilitates c-Myc turnover by supporting efficient nuclear accumulation of GSK-3. Oncogene. 2006;25:1281–9. doi: 10.1038/sj.onc.1209174. [DOI] [PubMed] [Google Scholar]
Associated Data
This section collects any data citations, data availability statements, or supplementary materials included in this article.


