

Abstract
Background
During emerging adulthood, alcohol and substance use peak. Previous research has suggested that prefrontal and subcortical brain volumes may relate to risk for development of substance abuse. Epidemiological studies indicate that early initiation of alcohol or drug use significantly increases the likelihood of later substance use disorder diagnoses. We hypothesized that frontal regions would be smaller in young adults with early substance use and related problems (early-risk, ER), compared with a control group without early use/problems (C). We further hypothesized that these volumes would be associated with more externalizing behaviors, an additional robust predictor of substance abuse.
Methods
One hundred and six subjects, ages 18–23, underwent high-resolution anatomical magnetic resonance image scanning. Individuals were categorized as C (n = 64) or ER (n = 42) using a composite-score of early alcohol/drug use and problems based on prospectively collected assessments; externalizing behaviors were also previously assessed during adolescence. Neuroanatomical volumes were compared between groups and correlated with behavioral measures.
Results
ER subjects exhibited more externalizing behaviors than their control counterparts. Total left frontal cortex and left superior frontal cortex volumes were significantly smaller in the ER group, controlling for family history of alcoholism and current substance use. Total gray matter volumes were negatively associated with substance risk score. Further, externalizing behavior score was negatively correlated with both left superior cortical and left total cortical volumes.
Conclusions
These findings suggest that smaller frontal cortical volumes, specifically the left superior frontal cortex, represent an underlying risk factor for substance abuse in emerging adults.
Keywords: Emerging adult, Superior frontal cortex, Middle frontal cortex, Substance risk, Externalizing behavior
1. Introduction
The transition years to adulthood, between the late teens and early twenties, is the developmental interval during which alcohol and drug use are at their highest levels and when the highest prevalence of substance use disorder (SUD) occurs (Johnston et al., 2004; Substance Abuse and Mental Health Services Administration (SAMHSA, 2006, 2010). Risk for SUD has been associated with family history and impulsive or externalizing behaviors (see recent reviews by Bava and Tapert, 2010; Stone et al., 2012). Externalizing behaviors, including aggression or delinquency, have been linked by numerous studies to both early onset and frequency of substance use (i.e., Boyle et al., 1992; Brook et al., 1996; Tarter et al., 1999; King et al., 2004; Olson et al., 2007; Hayatbakhsh et al., 2008). Further, early initiation of substance use is associated with subsequent problem use and dependence (Brook et al., 2007; King and Chassin, 2007; Roche et al., 2008), highlighting the interdependence of risk factors.
Much important work has looked at morphological differences in youth at high-risk for substance abuse based on a family history of alcoholism (FH+). For example, high-risk adolescents (average age 17) were found to have smaller right amygdala volumes than a matched group of FH− adolescents with no familial liability (FH−) – a difference not explained by past month alcohol consumption (Hill et al., 2001). Similarly, high-risk adolescents had decreased right-to-left hemisphere orbitofrontal volume ratio, which was not accounted for by a history of SUD – used as a proxy for alcohol and drug exposure (Hill et al., 2009). Related work hrevealed larger cerebellum and total intracranial and gray matter (GM) volumes in high-risk subjects aged 14–23 (Hill et al., 2007) and in high-risk subjects aged 8–29, when controlling for a history of SUD (Hill et al., 2011).
Other work has focused specifically on the relationships between substance use/abuse and brain structure. The most robust finding, summarized in a recent review, is prefrontal GM deficits in individuals with alcohol use disorders (AUD), particularly those under the age of 40 (Welch et al., 2013). For example, 14–21 year olds with early-onset AUD had smaller prefrontal cortex volumes than matched controls (De Bellis et al., 2005). AUD has also been associated with smaller hippocampal volume (De Bellis et al., 2000) but no cerebellar volume differences compare with controls (De Bellis et al., 2005) in this same age range. As the authors discuss, it is difficult to know whether these differences are a result of alcohol use or are a pre-existing risk factor for AUD. One approach to investigate this issue is to study high-risk youth with no alcohol exposure. Benegal et al. (2007) conducted a study of alcohol naïve high-risk (FH+) males aged 9–23 and found smaller volumes of superior frontal cortex, cingulate and parahippocampal gyri, thalamus, and cerebellum compared with FH− controls, which negatively correlated with externalizing behaviors (Benegal et al., 2007). These studies converge to suggest heritable anatomical differences related to risk for AUD.
We sought to build on this work, using a narrow age range to minimize variability in brain maturation. In addition, we sought to take into account that, while family history is a powerful predictor of later SUD, it is likely that there are neurobiological contributions to outcome differences even within a high-risk sample. Early onset of drinking has been shown to be a robust predictor of later AUD, even when controlling for family history (Dawson et al., 2008). Therefore, we examined early indicators of risky substance involvement, including early initiation and problems associated with use (Webb et al., 1991; Grant and Dawson, 1997; Zucker et al., 2003; Heitzeg et al., 2008), which we refer to as early-risk/endorsement (ER). We focused on emerging adulthood (18–23 years) including subjects with a range of substance use, taking this use, as well as family history, into account in our analyses. We expected that, compared with a less risky control (C) group, ER subjects would have smaller frontal and cingulate cortices and smaller subcortical structures including the thalamus and amygdala, supporting prior work indicating volumes in these regions are related to risk. We further hypothesized that the volumes of these regions would be negatively associated with externalizing behavior scores, linking anatomy to a known risk marker (Crews and Boettiger, 2009). We also report supplementary analyses investigating familial risk as a point of comparison with the existing literature.
2. Methods
2.1. Subjects
Participants were 106 right-handed adolescents (64 males, 42 females) aged 18.0–22.8 years (mean 20.5 ± 1.4). Subjects were recruited from the MLS, an ongoing study of families with parental alcoholism (FH+, 2/3 of sample) and contrast nonalcoholic families (FH−, 1/3 of sample; Zucker et al., 2000). Detailed description regarding MLS recruitment and assessments can be found elsewhere (Zucker et al., 1996).
Exclusionary criteria were: any neurological, acute, uncorrected, or chronic illness; any current or recent (within six months) treatment with centrally active medications including sedative hypnotics; and history of psychosis or schizophrenia in first-degree relatives. The presence of most Axis I psychiatric or developmental disorders was exclusionary. Externalizing disorders, including conduct disorders, attention deficit/hyperactivity disorder (ADHD), or substance use disorder (SUD), were not exclusionary as these may lie on a developmental spectrum with alcoholism risk (Krueger, 1999). This sample represents the first 106 neuroimaging participants within the age range of interest. Subject characteristics are summarized in Table 1. Written informed consent, approved by the University of Michigan Medical School Institutional Review Board, was obtained.
Table 1.
Subject demographics.
| Measure | Control | Early risk | χ2 or t | p |
|---|---|---|---|---|
| N | 64 | 42 | ||
| Males:females | 40:24 | 24:18 | 0.30 | 0.363 |
| Age – At scan (years) | 20.2 (1.4) | 20.5 (1.3) | −0.90 | 0.369 |
| Age – YSR-13 (years) | 13.3 (1.0) | 13.4 (0.8) | −1.01 | 0.313 |
| Age – YSR-16 (years) | 16.4 (1.0) | 16.5 (0.8) | −1.01 | 0.313 |
| IQa | 116 (14) | 113 (13) | 0.91 | 0.366 |
| Alcohol abuse | 0 | 6 | 9.40 | 0.003 |
| Alcohol dependence | 0 | 2 | 3.00 | 0.161 |
| Marijuana abuse | 0 | 8 | 12.80 | <0.001 |
| Marijuana dependence | 0 | 2 | 3.00 | 0.161 |
| Nicotine dependence | 0 | 1 | 1.60 | 0.392 |
| Other substance abuseb | 0 | 5 | 7.80 | 0.009 |
| Other substance dependenceb | 0 | 0 | – | – |
| Major depression disorder | 0 | 2 | 3.00 | 0.158 |
| Conduct disorder | 0 | 3 | 4.60 | 0.061 |
| Attention deficit disorder | 0 | 2 | 3.00 | 0.158 |
| Current marijuana user | 2 | 3 | 1.14 | 0.567 |
| Covariates | ||||
| Cumulative drink volume (lifetime drinks) | 854 (1343) | 3063 (2509) | 5.88 | <0.001 |
| Pack year | 0.08 (0.28) | 0.63 (1.09) | −3.87 | <0.001 |
| Any parent with alcohol diagnosis | 40 | 35 | 4.30 | 0.017 |
| Family history density | 0.51 (0.53) | 0.62 (0.49) | 0.95 | 0.347 |
| Substance risk measuresc | ||||
| Drinking by age 14 | 6 | 37 | 65.20 | <0.001 |
| Drunkenness by age 15 | 0 | 32 | 86.60 | <0.001 |
| Marijuana use by age 14 | 1 | 28 | 54.10 | <0.001 |
| Other illegal drugs by age 16 | 6 | 21 | 22.00 | <0.001 |
| Alcohol use problems by age 17 | 0.8 (2.3) | 5.8 (5.3) | −5.17 | <0.001 |
| Early risk measured | ||||
| Externalizing behaviors-13 | 7.2 (4.5) | 13.2 (8.4) | 4.63 | <0.001 |
| Externalizing behaviors-16 | 8.2 (4.9) | 12.6 (8.1) | 3.34 | <0.001 |
Data presented as mean (standard deviation) where applicable. Significant values in bold at α = 0.05.
Wechsler Intelligence Scale for Children – 3rd edition or Revised. These data were collected when participants were between the ages of 12 and 14 years as part of the ongoing Michigan Longitudinal Study.
Includes one of the following: amphetamines, cocaine, sedatives/hypnotics, or opiates.
Determined from annual assessments using Drinking and Drug History Form (DDHx) since age 11 through scan age; abuse and dependence diagnoses are lifetime measure.
Scores calculated from Youth Self Report (YSR).
2.2. Measures
2.2.1. Substance risk score
Substance use, including abuse or dependence, was assessed using DSM-IV criteria from responses obtained from each subject’s Drinking and Drug History (DDHx) Questionnaire (Zucker et al., 1990; Zucker, 1991; Zucker and Fitzgerald, 1994) assessing onset of use, content–quantity, frequency, and variability of alcohol consumption; frequency of other drug use; and consequences/problems related to use. The measure was administered yearly since age 11 so responses were relatively contemporaneous to the drinking experience.
A substance risk variable was created from five binary (yes/no) measures ascertained from DDHx responses: (1) onset of drinking by age 14; (2) onset of drunkenness by age 15; (3) onset of marijuana use by age 14; (4) onset of other drug use by age 16; and (5) more than four (>30th percentile) problems associated with alcohol use by age 17. The resultant variable ranged from 0 to 5. Subjects were categorized in either the control (C, substance risk = 0–1, n = 64) or ER (substance risk = 2–5, n = 42) groups. Scores were based on cumulative data up until benchmark ages; all participants had sufficient annual assessments between benchmark ages and the MRI scan to allow calculation of this variable despite missing data. The number of missed assessments did not differ between the risk groups (completed assessments age 11 to scan age: C: 72.9 ± 17.0%; ER: 71.5 ± 15.9%; t = 0.41, p = 0.684).
2.2.2. Substance use
Measures derived for covariates for analyses were:
-
Cumulative drink volume (CDV), calculated from annual drink volume (DV):
If data was missing for a year, DV was calculated as an average of the adjacent years.
-
Pack years (PY) was calculated from the most recent assessment: How frequently have you smoked cigarettes during the past 30 days (converted to packs/day), current age, and age at first cigarette (fcig):
The 0.5 multiplier assumes a monotonic increase in use from first cigarette until the most recent assessment.
A urine drug screen was administered to each subject prior to scanning to test for current/recent marijuana use.
2.2.3. Externalizing behaviors
Participants completed the Youth Self Report (YSR) questionnaire (Achenbach, 1991) as part of the ongoing MLS when they were 11.8–15.0 years (mean 13.4 ± 0.9) and again at 14.8–18.4 years (mean 16.4 ± 0.9). The YSR provides standardized scores of a respondent’s social and emotional functioning, and has been used extensively demonstrating strong reliability and validity (Achenbach and Rescorla, 2001). Internal consistency of the YSR across assessments was adequate (Cronbach’s alpha = 0.88). We used the broadband scale of externalizing behavior (EXT) given previous work associating these early behaviors with problem alcohol involvement (SAMHSA, 2005; Zucker et al., 2008).
2.2.4. Family history (FH) and family history density (FHD)
Seventy-five participants study were FH+, having one or both parents with a lifetime history of alcoholism, based on a diagnosis of alcohol abuse or dependence, while 31 participants were FH−, consistent with the entire MLS. FHD was derived from genogram data on parents, aunts/uncles, grandparents and great aunts/uncles. Identified alcoholic relatives were weighted by degree within each generation (1°, 0.5; 2°, 0.25; 3°, 0.125) and summed across generations. FHD cannot be considered a pure measure of genetic load for alcoholism but provides some estimate of heritable risk (Zucker et al., 1996).
2.3. Anatomical data acquisition
High-resolution anatomical T1 scans were acquired on a 3.0 Tesla GE Excite2 scanner (Milwaukee, WI). Motion was minimized with foam pads and an emphasis on the importance of keeping still. FreeSurfer Version 5.1 (Fig. 1), a volumetric segmentation program, was used for 3-D reconstruction of anatomical images for the purpose of statistical analysis.
Fig. 1.
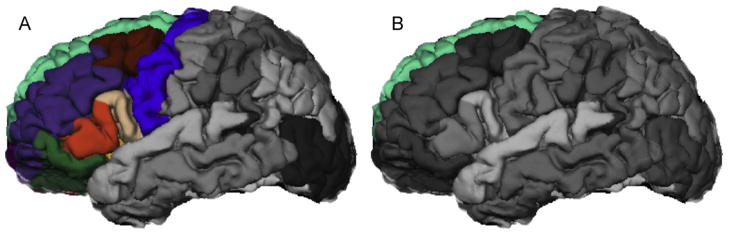
FreeSurfer depiction of (A) left frontal cortex and (B) left superior frontal cortex, regions found to have significantly smaller volumes in early risk versus control emerging adults after controlling for current tobacco use, lifetime drink volume, family history of alcoholism, and total gray matter volume.
2.4. Anatomical data processing
FreeSurfer processing includes motion correction (Reuter et al., 2010), removal of non-brain tissue using a hybrid watershed/surface deformation procedure (Ségonne et al., 2004), automated Talairach transformation, segmentation of cortical and subcortical volumetric structures (Fischl et al., 2002, 2004), intensity normalization (Sled et al., 1998), tessellation of the gray/white-matter boundary, automated topology correction (Fischl et al., 2001; Segonne et al., 2007), and surface deformation using intensity gradients (Dale and Sereno, 1993; Dale et al., 1999; Fischl and Dale, 2000).
Despite evidence of a high degree of accuracy in FreeSurfer’s automated segmentation (Fischl et al., 2002), quality control procedures were established to verify the segmentation and volume-related statistics. Manual spatial manipulation of Talairach registration, based on visual inspection, was performed once for each subject to adjust for any errors in automated alignment at the beginning of the process. Subsequent corrections were made by hand in accordance with FreeSurfer recommendations (Fischl, 2012) in all locations where any of the following defects occurred: inaccurate gray/white-matter boundary segmentation, mislabeling of white matter and skull strip failure. After reconstruction was deemed “complete”, segmentations were closely examined in seven key regions of the brain and assigning an overall PASS or FAIL grade to each one in the manner documented by ADNI: the Alzheimer’s Disease Neuroimaging Initiative (Hartig et al., 2012). These regions included the cortical surface of the frontal, temporal, parietal, and occipital lobes along with the basal ganglia, insula, and an overall cerebral white matter assessment. All regions, for all subjects, analyzed for this study received a PASS grade.
2.5. Data analysis
2.5.1. Demographic and psychometric measures
Independent-samples t- and χ2-tests were used to test for group differences in subject characteristics using the Statistical Package of Social Sciences-19 (SPSS-19). Fisher’s exact test was used for contingency tables with cell sizes less than five.
2.5.2. Total gray matter and region of interest (ROI) volumes by risk group
Volumetric data were analyzed for total GM, frontal cortex, right and left frontal cortices, as well as for 26 a priori ROIs (13/hemisphere) listed in Table 2. All ROI volumes passed normality tests using the Kolmogorov–Smirnov Z-test (p’s > 0.098) in SPSS. Independent-samples t-tests were used to test for group differences with significance thresholds determined using the False Discovery Rate (FDR). FDR controls the proportion of false-positive results expected from all tests declared significant, here, accounting for tests of 30 ROIs (Benjamini et al., 2001).
Table 2.
Results of independent samples t-tests between risk groups for structure volumes.
| Hemisphere | Control group
|
Early risk group
|
t | p | FDR threshold | ||
|---|---|---|---|---|---|---|---|
| Structure | Volume (mm3) | ||||||
| Left | |||||||
| Frontal cortex | 95,763.0 | (9738.6) | 90,225.7 | (10,227.8) | 2.81 | 0.007 | 0.010 |
| Caudal middle frontal cortex | 6995.4 | (1302.9) | 6664.7 | (1470.4) | 1.21 | 0.227 | 0.038 |
| Lateral orbitofrontal cortex | 7134.7 | (1004.8) | 6729.9 | (985.5) | 2.04 | 0.043 | 0.023 |
| Medial orbitofrontal cortex | 5760.2 | (884.3) | 5555.5 | (788.6) | 1.22 | 0.227 | 0.040 |
| Rostral middle frontal cortex | 18,332.7 | (2462.2) | 17,134.9 | (2745.2) | 2.34 | 0.021 | 0.018 |
| Superior frontal cortex | 25,987.1 | (2922.0) | 24,246.8 | (2657.9) | 3.11 | 0.002 | 0.002 |
| Frontal pole | 1100.0 | (232.5) | 976.4 | (224.5) | 2.72 | 0.008 | 0.012 |
| Cingulate cortex | 10,859.8 | (1550.7) | 10,453.3 | (1438.7) | 2.34 | 0.021 | 0.020 |
| Caudal anterior cingulate | 1962.5 | (421.5) | 1991.3 | (413.8) | 0.42 | 0.677 | 0.048 |
| Isthmus cingulate | 2967.2 | (547.8) | 2690.1 | (404.5) | 2.81 | 0.006 | 0.007 |
| Rostral anterior cingulate | 2474.5 | (557.8) | 2294.8 | (407.3) | 1.80 | 0.075 | 0.028 |
| Posterior cingulate | 3455.5 | (541.1) | 3471.0 | (659.6) | 0.13 | 0.895 | 0.050 |
| Amygdala | 1710.6 | (277.0) | 1615.6 | (237.5) | 1.85 | 0.071 | 0.027 |
| Thalamus | 7026.7 | (790.7) | 6695.5 | (942.1) | 1.95 | 0.053 | 0.025 |
| Parahippocampal gyrus | 2121.6 | (536.1) | 1986.0 | (480.4) | 1.34 | 0.185 | 0.037 |
| Right | |||||||
| Frontal cortex | 95,534.5 | (9847.0) | 90,457.0 | (9673.0) | 2.57 | 0.012 | 0.015 |
| Caudal middle frontal cortex | 7522.7 | (1284.8) | 7003.5 | (1249.6) | 2.06 | 0.042 | 0.022 |
| Lateral orbitofrontal cortex | 7499.9 | (1064.9) | 7203.2 | (1007.8) | 1.43 | 0.155 | 0.035 |
| Medial orbitofrontal cortex | 5209.5 | (797.7) | 4969.6 | (686.3) | 1.60 | 0.113 | 0.033 |
| Rostral middle frontal cortex | 18,043.2 | (2366.1) | 16,773.7 | (2595.9) | 2.60 | 0.011 | 0.013 |
| Superior frontal cortex | 24,737.5 | (2805.2) | 23,802.4 | (2437.8) | 1.76 | 0.080 | 0.030 |
| Frontal pole | 1284.1 | (249.1) | 1248.1 | (277.1) | 1.66 | 0.099 | 0.032 |
| Cingulate cortex | 11,013.2 | (1673.2) | 10,069.9 | (1468.7) | 2.98 | 0.004 | 0.005 |
| Caudal anterior cingulate | 2178.8 | (489.0) | 1898.2 | (440.9) | 3.00 | 0.003 | 0.003 |
| Isthmus cingulate | 2989.5 | (635.3) | 2678.4 | (459.5) | 2.76 | 0.007 | 0.008 |
| Rostral anterior cingulate | 2485.6 | (638.1) | 2201.4 | (483.4) | 2.46 | 0.016 | 0.017 |
| Posterior cingulate | 3359.2 | (522.5) | 3281.6 | (541.1) | 0.74 | 0.463 | 0.047 |
| Amygdala | 1728.0 | (240.3) | 1689.5 | (228.2) | 0.82 | 0.413 | 0.043 |
| Thalamus | 7048.0 | (683.3) | 6928.9 | (1060.6) | 0.70 | 0.463 | 0.045 |
| Parahippocampal gyrus | 2094.8 | (380.5) | 2028.1 | (279.9) | 0.98 | 0.332 | 0.042 |
| Total frontal cortex | 129,659.0 | (13,605.7) | 122,308.6 | (13,806.9) | 2.71 | 0.008 | NA |
| Total cingulate cortex | 21,872.9 | (2980.3) | 20,523.2 | (2790.5) | 2.34 | 0.021 | NA |
| Total gray matter | 668,375.7 | (63,651.6) | 645,456.3 | (66,484.8) | 1.78 | 0.078 | NA |
Values reported as mean (standard deviation).
Significant values in bold when p ≤ FDR threshold.
FDR, False Discovery Rate; NA, not applicable.
ROIs with significantly different volumes by group were entered into general linear models (GLMs) to determine if familial risk or substance use were impacting differences. Volume was the dependent variable, the continuous substance risk score (0–5) was the independent variable, and four covariates were included: individual total GM volume, CDV, PY, and the binary FH variable. The model was repeated, using FHD rather than FH to evaluate liability of family density rather than only parental contribution.
Finally, stepwise discriminant analyses were performed, first using only the significant ROI volumes, then including the covariates from the GLMs to determine the best combination of variables to predict membership in either the ER or C groups, assessing statistical significance using Wilks’ lambda. These analyses were analyzed separately using FH as the familial liability variable, then repeated using FHD.
2.5.3. Externalizing behaviors and ROI volumes
For ROIs found significant in the GLM analyses, partial correlations were used to test for associations with externalizing behavior scores controlling for total GM volume. The association between GM volume and externalizing behavior was tested using a Pearson’s correlation.
3. Results
3.1. Demographics and psychometrics
The C and ER groups did not differ by gender, age, or IQ. By design, the groups did differ in substance risk score as well as on all measures used to create the composite score (Table 1). The ER group had higher lifetime drink volume and more parents with AUD diagnosis, but not a higher FHD. ER subjects exhibited a higher incidence of substance use diagnoses and exhibited more externalizing behaviors than controls (Table 1). The groups were not different in current marijuana use based on drug urine tests.
3.2. Volumetric analyses
3.2.1. Independent-samples tests
Total GM did not differ between groups, however the left and right frontal cortices and right cingulate cortex were significantly smaller in the ER versus C group, as were several of their subregions (Table 2); GLMs were then used to investigate the impact of critical covariates on these findings.
3.2.2. General linear models
The GLMs exploring the left frontal volume found a significant effect of both substance risk score and total GM volume but no significant effect of CDV, PY, FH or FHD (see Table 3). These analyses were repeated excluding ER subjects with any lifetime substance abuse/dependence (Dx, n = 8); substance risk had trend level effects (F = 1.98, p = 0.090 with FH and F = 2.15, p = 0.069 with FHD).
Table 3.
General linear model (GLM) statistics for structures where substance risk score was significantly related to volume.
| Structure
| ||
|---|---|---|
| Factors | F | p |
| Left frontal volume | ||
| Substance risk score | 3.02 | 0.015 |
| Total gray matter volume | 473.64 | <0.001 |
| CDV | 0.48 | 0.490 |
| PY | 0.14 | 0.707 |
| FH | 0.90 | 0.347 |
| Left frontal volume | ||
| Substance risk score | 3.16 | 0.012 |
| Total gray matter volume | 452.95 | <0.001 |
| CDV | 0.05 | 0.831 |
| PY | 0.41 | 0.525 |
| FHD | 0.05 | 0.825 |
| Left superior frontal volume | ||
| Substance risk score | 2.64 | 0.029 |
| Total gray matter volume | 129.7 | <0.001 |
| CDV | 0.36 | 0.550 |
| PY | 0.51 | 0.478 |
| FH | 0.02 | 0.903 |
| Left superior frontal volume | ||
| Substance risk score | 3.25 | 0.011 |
| Total gray matter volume | 153.4 | <0.001 |
| CDV | 0.26 | 0.612 |
| PY | 0.47 | 0.496 |
| FHD | 0.59 | 0.446 |
PY, pack-year; CDV, cumulative lifetime drink volume; FH, Any Parent Diagnosis for Alcohol Abuse or Dependence; FHD, family history density.
Significant values in bold at α = 0.05
The GLMs exploring right frontal volume found that total GM volume had a significant: GM (F = 326.90, p < 0.001), but no significant effect of substance risk score (F = 1.25, p = 0.295 with FH and F = 1.32, p = 0.268 with FHD), CDV, PY, FH or FHD.
After controlling for substance use, family liability and GM volume, substance risk score had a significant effect on the left superior frontal cortex, with a smaller volume in the ER than the C group (see Table 3). When excluding Dx, substance risk remained significant (F = 2.43, p = 0.041 with FH; F = 3.49, p = 0.007 with FHD) indicating Dx were not driving these effects.
In all GLMs for all other ROIs, total GM volume had a significant effect (F = 4.03–170.473, all p’s < 0.048) with no other factors significant.
Finally, in a separate exploratory analysis, all ROIs were tested for group differences based on FH with no differences by FH for GM, frontal or cingulate cortical volumes (all t’s < 1.84, all p’s > 0.068) with the exception of the right frontal pole (FH+ < FH−: 1267 < 1384 mm3; t = 2.07, p = 0.041) and a trend for the left superior frontal cortex (t = 1.71, p = 0.056) neither which survive FDR correction.
3.2.3. Discriminant analyses
The discriminant analysis (see Table 4) including only the left frontal volume (Model 1A) resulted in a significant model (p = 0.006) and correctly classified 56.6% of the original grouped cases. When additional predictors were included, the analyses produced best discriminant coefficients with left frontal volume, CDV, PY, and total gray volume included as factors and FH excluded (Model 1B). Similarly, when FHD was investigated, the model retained left frontal volume, CDV and PY, excluding both total gray volume and FHD (Model 1C). The original grouped cases were correctly classified over 77% of the time in both models.
Table 4.
Statistics for discriminant analyses for structures found with significantly smaller volumes in early risk versus control subjects.
| Model | Variables | Test of group means
|
Summary of canonical discriminant function
|
||||||||
|---|---|---|---|---|---|---|---|---|---|---|---|
| Wilks’ lambda | F | p | Standardized coefficient | Eigen-value | Canonical correlation | Wilks’ lambda | χ2 | p | % of original grouped cases correctly classified | ||
| 1A | Left frontal volume | 0.930 | 7.88 | 0.06 | −9.419a | 0.076 | 0.265 | 0.930 | 7.56 | 0.006 | 56.6 |
| 1B | Left frontal volume | 0.915 | 9.65 | 0.002 | −0.455 | 0.549 | 0.595 | 0.646 | 44.82 | <0.001 | 78.3 |
| Total gray volume | 0.970 | 3.17 | 0.078 | Excl. | |||||||
| CDV | 0.759 | 34.61 | <0.001 | 0.739 | |||||||
| PY | 0.874 | 14.98 | <0.001 | 0.463 | |||||||
| FH | 0.950 | 3.17 | 0.021 | Excl. | |||||||
| 1C | Left frontal volume | 0.919 | 8.15 | 0.005 | −0.496 | 0.457 | 0.560 | 0.686 | 34.47 | <0.001 | 77.4 |
| Total gray volume | 0.976 | 2.25 | 0.137 | Excl. | |||||||
| CDV | 0.778 | 26.59 | <0.001 | 0.681 | |||||||
| PY | 0.874 | 13.67 | <0.001 | 0.437 | |||||||
| FHD | 0.990 | 0.90 | 0.347 | Excl. | |||||||
| 2A | Left superior frontal volume | 0.915 | 9.65 | 0.002 | −8.968a | 0.093 | 0.291 | 0.915 | 9.185 | 0.002 | 58.5 |
| 2B | Left superior frontal volume | 0.930 | 7.88 | 0.006 | −0.455 | 0.549 | 0.595 | 0.646 | 44.82 | <0.001 | 81.1 |
| Total gray volume | 0.970 | 3.17 | 0.078 | 0.891 | |||||||
| CDV | 0.750 | 34.61 | <0.001 | 0.739 | |||||||
| PY | 0.874 | 14.98 | <0.001 | 0.463 | |||||||
| FH | 0.950 | 5.49 | 0.04 | Excl. | |||||||
| 2C | Left superior frontal volume | 0.936 | 6.40 | 0.013 | −0.404 | 0.493 | 0.541 | 0.780 | 31.64 | <0.001 | 81.1 |
| Total gray volume | 0.976 | 2.25 | 0.137 | Excl. | |||||||
| CDV | 0.778 | 26.59 | 0.013 | 0.695 | |||||||
| PY | 0.874 | 13.37 | <0.001 | 0.435 | |||||||
| FHD | 0.990 | 0.90 | 0.347 | Excl. | |||||||
CDV, cumulative lifetime drink volume; PY, pack-year; FH, Any Parent Diagnosis for Alcohol Abuse or Dependence; FHD, family history density; Excl., variable excluded from final model.
Unstandardized coefficient due to model containing a single factor.
The discriminant analysis including only the left superior volume (Model 2A) correctly classified 58.5% of the original grouped cases (Table 4). With additional predictors, the discriminant analyses for the left superior volume correctly classified over 80% of the original grouped cases, retaining left superior frontal volume, CDV, PY, and excluding total GM and either FH (Model 2B) or FHD (Model 2C).
3.3. Externalizing behaviors and volumetric correlations
Across the entire sample, significant negative correlations between EXT, at both assessments (age 13 and 16), were found for the left superior frontal cortical volume (EXT-13: R = −0.349, p < 0.000; EXT-16: R = −0.263, p = 0.009) and the total left frontal cortical volume (EXT-13: R = −0.313, p = 0.002; EXT-16: R = −0.249, p = 0.013), when controlling for total GM volume. While the ER group had consistently lower volumes across the entire range of EXT scores, both risk groups showed decreasing volumes of left superior frontal cortex and left frontal cortex as EXT increased (Fig. 2). Total GM volume was correlated with externalizing behavior at the younger assessment, remaining a trend at the older assessment (EXT-13: R = −0.290, p = 0.003; EXT-16: R = −0.159, p = 0.118).
Fig. 2.
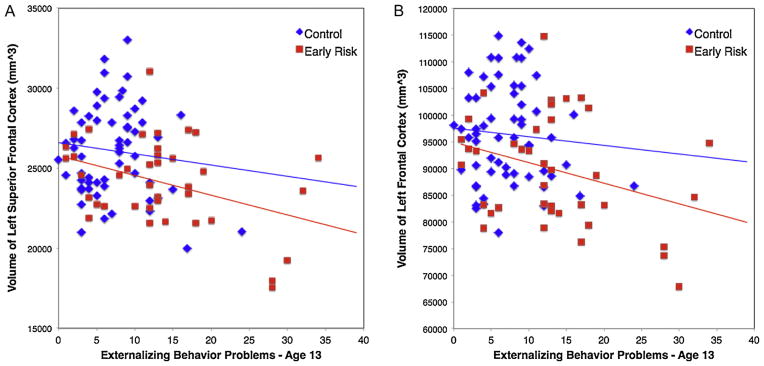
Scatter plots for early risk and control groups of externalizing behavior problems at age 13 and cortical volumes for (A) left superior frontal cortex and (B) left frontal cortex.
4. Discussion
This study reports on structural differences in frontal brain regions between groups of young adults who exhibit early endorsement of substance use and have experienced early problems related to use compared with a lower risk control group. Compared to controls, the ER sample had smaller volumes in the left superior frontal cortex, as well as the entire left frontal cortex, when controlling for total GM volume, substance use, and family history. While other work has reported structural differences between risk groups based on familial liability (Hill et al., 2001, 2007) or early onset of alcohol use disorders (De Bellis et al., 2005; Nagel et al., 2005; Medina et al., 2008), this work shows differences based on early indices of substance use problems. In addition, we report negative relationships between total GM, left frontal, and in particular, left superior frontal, cortical volumes and early externalizing behaviors, suggesting that these anatomical differences may play an underlying role in risk for substance abuse.
Our findings suggest that frontal anatomical differences, particularly in the left superior frontal cortex may contribute to vulnerability in emerging adults. Previous research into volumetric differences associated with substance use identified smaller pre-frontal lobes in older (22–41 years) male polysubstance abusers (Liu et al., 1998) as well as in youth (13–21 years) with early onset of alcohol dependence (De Bellis et al., 2005). Lower gray-matter volumes in bilateral middle frontal gyri have been found in older (31–69 years) alcohol dependent patients versus healthy controls (Mechtcheriakov et al., 2007). Therefore, our finding of smaller left superior cortical volumes, within our fairly narrow age band (18–23 years), even when excluding subjects who have already reached an AUD diagnosis, is an important contribution. The finding that the effect remains when controlling for amount of lifetime alcohol and cigarette use supports the tentative conclusion that this represents a pre-existing vulnerability factor. However, despite using methods to control for substance use, our study cannot determine definitively whether the deficits in frontal volume contributed to risk for becoming early endorsers in these subjects or are a consequence of substance use.
Important anatomical work, looking at subjects with familial loading, has been undertaken to investigate the question of pre-existing vulnerability. For example, Hill et al. (2001, 2009, 2011) have found smaller right amygdala and right orbitofrontal cortex yet increased cerebellar volumes in adolescent offspring of alcoholic families also taking into account alcohol consumption or substance use. With some agreement, Benegal et al. (2007) examined substance naïve youth and reported decreased amygdala, hippocampus, thalami, superior frontal gyri and cingulate although they found decreased cerebellar volumes. These studies suggest that some deficits in volume, particularly in the prefrontal cortex, may represent premorbid conditions (Welch et al., 2013). Of further interest, several of these familial studies have reported larger intracranial volumes in the high-risk subjects (Hill et al., 2007, 2009, 2011), suggesting this may represent a global delay in GM pruning associated with maturation (Pfefferbaum et al., 1994; Giedd et al., 1996; Raznahan et al., 2011), while the prefrontal regions may have more localized deficits. We, however, did not see a larger total GM volume associated with early risk, nor did we find it associated with family history. In fact, our early-risk subjects exhibited a trend for smaller overall brain structure in addition to the smaller frontal regions. Longitudinal studies, evaluating brain structure both before engagement of substance use, and post transition-year use, are needed to fully evaluate understand these differences.
From a behavioral standpoint, we investigated self-reported measures of externalizing behaviors assessed during adolescence, when subjects were 13 and 16 years of age on average. Our finding that the young adult ER subjects had previously reported more externalizing behaviors is consistent with prior working showing associations between externalizing measures and substance abuse risk (Benegal et al., 2007; Bava and Tapert, 2010). In addition, the negative associations between these early adolescent behavior scores and the subjects’ current frontal cortical volumes are in agreement with a recent report that left superior frontal cortical thickness in adolescents was negatively related to impulsiveness, another behavioral measure associated with risk (Schilling et al., 2013). The substance risk variable used in this study was created from measures of early engagement with substances, so, in agreement with the early externalizing measures, further links early behaviors with frontal cortical volumes. Therefore, the left frontal cortical volume, and in particular, the left superior frontal cortical volume, considered part of top-down control regions, may be a potential neurobiological factor underlying this risk. This would align with the conceptual model of substance risk which suggests that later maturation of cortical control regions compared with subcortical dopamine-related reward systems (Giedd et al., 1999; Galvan et al., 2006) may bias the motivation of adolescents toward immediate over long-term reward (Scheres et al., 2006; Olson et al., 2007; Steinberg et al., 2009), increasing their risk for abusing substances.
A methodological limitation to this study is important to note. While FreeSurfer’s automated segmentation method has been shown to have a high degree of accuracy (Fischl et al., 2002), the quality control procedure does require some level of subjective analysis and correction. To minimize this effect, the same research associate processed all anatomical data, blind to the substance risk scores of the participants. Further, as the discriminant analyses reveal, our anatomical findings alone are not sufficient to classify subjects into the early-risk group. Substance use prior to the study, as well as overall brain development, were also significant contributors to the classification highlighting the complexity of determining cause and effect between substance use and structural deficits.
In summary, our results suggest that smaller frontal volumes, specifically the left superior frontal cortex, may be an underlying risk factor for substance abuse in emerging adults. These volumes are related to early behavioral markers of risk and therefore may indicate underlying neural anatomical substrates of vulnerability for substance abuse. In addition, the more global measures of total left frontal cortical volume and total GM volumes were also found associated with vulnerability and may represent maturational slowing in brain development which may influence risky behavior.
Acknowledgments
Role of funding source
This work was supported by NIH grants K01 DA031755 to B.J.W., T32 AA07477 to R.A.Z., K01 DA020088 to M.M.H., R01 AA12217 and R37 AA07065 to R.A.Z., the Phil F. Jenkins Foundation Award to J.K.Z. and a NARSAD Brain and Behavior Early Investigator Award to B.J.W. The NIH, the Jenkins Foundation, and the Brain & Behavior Research Foundation had no further role in study design; in the collection, analysis and interpretation of data; in the writing of the report; or in the decision to submit the paper for publication.
Footnotes
Contributors
M.M.H., J.K.Z. and R.A.Z. designed the study and wrote the protocol. B.J.W., S.T.K. and M.S. performed statistical analysis. B.J.W. and S.T.K. managed the literature searches and summaries of previous related work. B.J.W. and S.T.K. wrote the first draft of the manuscript. All authors contributed to and have approved the final manuscript.
Conflict of interest
The authors report no biomedical financial interests or potential conflicts of interests.
References
- Achenbach TM. Manual for the Youth Self-Report and 1991 Profile. University of Vermont; Burlington, VT: 1991. [Google Scholar]
- Achenbach TM, Rescorla LA. Youth Self-Report for Ages 11–18. ASEBA; Burlington: 2001. [Google Scholar]
- Bava S, Tapert S. Adolescent brain development and the risk for alcohol and other drug problems. Neuropsychol Rev. 2010;20:398–413. doi: 10.1007/s11065-010-9146-6. [DOI] [PMC free article] [PubMed] [Google Scholar]
- Benegal V, Antony G, Venkatasubramanian G, Jayakumar PN. Imaging study: gray matter volume abnormalities and externalizing symptoms in subjects at high risk for alcohol dependence. Addict Biol. 2007;12:122–132. doi: 10.1111/j.1369-1600.2006.00043.x. [DOI] [PubMed] [Google Scholar]
- Benjamini Y, Drai D, Elmer G, Kafkafi N, Golani I. Controlling the false discovery rate in behavior genetics research. Behav Brain Res. 2001;125:279–284. doi: 10.1016/s0166-4328(01)00297-2. [DOI] [PubMed] [Google Scholar]
- Boyle MH, Offord DR, Racine YA, Szatmari P, Fleming JE, Links PS. Predicting substance use in late adolescence: results from the Ontario Child Health Study follow-up. Am J Psychiatry. 1992;149:761–767. doi: 10.1176/ajp.149.6.761. [DOI] [PubMed] [Google Scholar]
- Brook JS, Whiteman M, Finch SJ, Cohen P. Young adult drug use and delinquency: childhood antecedents and adolescent mediators. J Am Acad Child Adolesc Psychiatry. 1996;35:1584–1592. doi: 10.1097/00004583-199612000-00009. [DOI] [PubMed] [Google Scholar]
- Brook JS, Balka EB, Ning Y, Brook DW. Trajectories of cigarette smoking among African Americans and Puerto Ricans from adolescence to young adulthood: associations with dependence on alcohol and illegal drugs. Am J Addict. 2007;16:195–201. doi: 10.1080/10550490701375244. [DOI] [PubMed] [Google Scholar]
- Crews FT, Boettiger CA. Impulsivity, frontal lobes and risk for addiction. Pharmacol Biochem Behav. 2009;93:237–247. doi: 10.1016/j.pbb.2009.04.018. [DOI] [PMC free article] [PubMed] [Google Scholar]
- Dale AM, Sereno MI. Improved localization of cortical activity by combining EEG and MEG with MRI cortical surface reconstruction: a linear approach. J Cogn Neurosci. 1993;5:162–176. doi: 10.1162/jocn.1993.5.2.162. [DOI] [PubMed] [Google Scholar]
- Dale AM, Fischl B, Sereno MI. Cortical surface-based analysis: I. Segmentation and surface reconstruction. Neuroimage. 1999;9:179–194. doi: 10.1006/nimg.1998.0395. [DOI] [PubMed] [Google Scholar]
- Dawson DA, Goldstein RB, Chou SP, Ruan WJ, Grant BF. Age at first drink and the first incidence of adult-onset DSM-IV alcohol use disorders. Alcohol Clin Exp Res. 2008;32:2149–2160. doi: 10.1111/j.1530-0277.2008.00806.x. [DOI] [PMC free article] [PubMed] [Google Scholar]
- De Bellis MD, Clark DB, Beers SR, Soloff PH, Boring AM, Hall J, Kersh A, Keshavan MS. Hippocampal volume in adolescent-onset alcohol use disorders. Am J Psychiatry. 2000;157:737–744. doi: 10.1176/appi.ajp.157.5.737. [DOI] [PubMed] [Google Scholar]
- De Bellis MD, Narasimhan A, Thatcher DL, Keshavan MS, Soloff P, Clark DB. Prefrontal cortex, thalamus, and cerebellar volumes in adolescents and young adults with adolescent-onset alcohol use disorders and comorbid mental disorders. Alcohol Clin Exp Res. 2005;29:1590–1600. doi: 10.1097/01.alc.0000179368.87886.76. [DOI] [PubMed] [Google Scholar]
- Fischl B. FreeSurfer: Failure Modes and Interventions. FreeSurfer; Boston: 2012. [Google Scholar]
- Fischl B, Dale Measuring the thickness of the human cerebral cortex from magnetic resonance images. Proc Natl Acad Sci USA. 2000;97:11050–11055. doi: 10.1073/pnas.200033797. [DOI] [PMC free article] [PubMed] [Google Scholar]
- Fischl B, Liu A, Dale AM. Automated manifold surgery: constructing geometrically accurate and topologically correct models of the human cerebral cortex. IEEE Trans Med Imaging. 2001;20:70–80. doi: 10.1109/42.906426. [DOI] [PubMed] [Google Scholar]
- Fischl B, Salat DH, Busa E, Albert M, Dieterich M, Haselgrove C, van der Kouwe A, Killiany R, Kennedy D, Klaveness S, Montillo A, Makris N, Rosen B, Dale AM. Whole brain segmentation: automated labeling of neuroanatomical structures in the human brain. Neuron. 2002;33:341–355. doi: 10.1016/s0896-6273(02)00569-x. [DOI] [PubMed] [Google Scholar]
- Fischl B, Salat DH, van der Kouwe AJ, Makris N, Segonne F, Quinn BT, Dale AM. Sequence-independent segmentation of magnetic resonance images. Neuroimage. 2004;23 (Suppl 1):S69–S84. doi: 10.1016/j.neuroimage.2004.07.016. [DOI] [PubMed] [Google Scholar]
- Galvan A, Hare TA, Parra CE, Penn J, Voss H, Glover G, Casey BJ. Earlier development of the accumbens relative to orbitofrontal cortex might underlie risk-taking behavior in adolescents. J Neurosci. 2006;26:6885–6892. doi: 10.1523/JNEUROSCI.1062-06.2006. [DOI] [PMC free article] [PubMed] [Google Scholar]
- Giedd JN, Snell JW, et al. Quantitative magnetic resonance imaging of human brain development: ages 4–18. Cerebral Cortex. 1996;6 (4):551–559. doi: 10.1093/cercor/6.4.551. [DOI] [PubMed] [Google Scholar]
- Giedd JN, Blumenthal J, Jeffries NO, Castellanos FX, Liu H, Zijdenbos A, Paus T, Eavns AC, Rapaport JL. Brain development during childhood and adolescence: a longitudinal MRI study. Nat Neurosci. 1999;2:861–863. doi: 10.1038/13158. [DOI] [PubMed] [Google Scholar]
- Grant BF, Dawson DA. Age at onset of alcohol use and its association with DSM-IV alcohol abuse and dependence: results from the National Longitudinal Alcohol Epidemiologic Survey. J Subst Abuse. 1997;9:103–110. doi: 10.1016/s0899-3289(97)90009-2. [DOI] [PubMed] [Google Scholar]
- Hartig M, Truran-Sacrey D, et al. ADNI: Alzheimers Disease Neuroimaging Initiative. San Francisco: 2012. UCSF FreeSurfer Overview and QC Ratings. [Google Scholar]
- Hayatbakhsh MR, McGee TR, Bor W, Najman JM, Jamrozik K, Mamun AA. Child and adolescent externalizing behavior and cannabis use disorders in early adulthood: an Australian prospective birth cohort study. Addict Behav. 2008;33:422–438. doi: 10.1016/j.addbeh.2007.10.004. [DOI] [PubMed] [Google Scholar]
- Heitzeg MM, Nigg JT, Yau WYWZJK, Zucker RA. Affective circuitry and risk for alcoholism in late adolescence: differences in frontostriatal responses between vulnerable and resilient children of alcoholic parents. Alcohol Clin Exp Res. 2008;32:414–426. doi: 10.1111/j.1530-0277.2007.00605.x. [DOI] [PMC free article] [PubMed] [Google Scholar]
- Hill SY, De Bellis MD, Keshavan MS, Lowers L, Shen S, Hall J, Pitts T. Right amygdala volume in adolescent and young adult offspring from families at high risk for developing alcoholism. Biol Psychiatry. 2001;49:894–905. doi: 10.1016/s0006-3223(01)01088-5. [DOI] [PubMed] [Google Scholar]
- Hill SY, Muddasani S, Prasad K, Nutche J, Steinhauer SR, Scanlon J, McDermott M, Keshavan M. Cerebellar volume in offspring from multiplex alcohol dependence families. Biol Psychiatry. 2007;61:41–47. doi: 10.1016/j.biopsych.2006.01.007. [DOI] [PMC free article] [PubMed] [Google Scholar]
- Hill SY, Wang S, Kostelnik B, Carter H, Holmes B, McDermott M, Zezza N, Stiffler S, Keshavan MS. Disruption of orbitofrontal cortex laterality in offspring from multiplex alcohol dependence families. Biol Psychiatry. 2009;65:129–136. doi: 10.1016/j.biopsych.2008.09.001. [DOI] [PMC free article] [PubMed] [Google Scholar]
- Hill SY, Wang S, Carter H, Tessner K, Holmes B, McDermott M, Zezza N, Stiffler S. Cerebellum volume in high-risk offspring from multiplex alcohol dependence families: association with allelic variation in GABRA2 and BDNF. Psychiatry Res. 2011;194:304–313. doi: 10.1016/j.pscychresns.2011.05.006. [DOI] [PMC free article] [PubMed] [Google Scholar]
- Johnston LD, O’Malley PM, Bachman JG, Schulenberg JE. Secondary School Students. I. National Institute on Drug Abuse; Bethesda, MD: 2004. Monitoring the Future National Survey Results on Drug Use, 1975–2003. [Google Scholar]
- King KM, Chassin L. A prospective study of the effects of age of initiation of alcohol and drug use on young adult substance dependence. J Stud Alcohol Drugs. 2007;68:256–265. doi: 10.15288/jsad.2007.68.256. [DOI] [PubMed] [Google Scholar]
- King SM, Iacono WG, McGu M. Childhood externalizing and internalizing psychopathology in the prediction of early substance use. Addiction. 2004;99:1548–1559. doi: 10.1111/j.1360-0443.2004.00893.x. [DOI] [PubMed] [Google Scholar]
- Krueger RF. Personality traits in late adolescence predict mental disorders in early adulthood: a prospective-epidemiological study. J Person. 1999;67:39–65. doi: 10.1111/1467-6494.00047. [DOI] [PubMed] [Google Scholar]
- Liu X, Matochik JA, Cadet JL, London ED. Smaller volume of prefrontal lobe in polysubstance abusers: a magnetic resonance imaging study. Neuropsychopharmacology. 1998;18:243–252. doi: 10.1016/S0893-133X(97)00143-7. [DOI] [PubMed] [Google Scholar]
- Mechtcheriakov S, Brenneis C, Egger K, Koppelstaetter F, Schocke M, Marksteiner J. A widespread distinct pattern of cerebral atrophy in patients with alcohol addiction revealed by voxel-based morphometry. J Neurol Neurosurg Psychiatry. 2007;78:610–614. doi: 10.1136/jnnp.2006.095869. [DOI] [PMC free article] [PubMed] [Google Scholar]
- Medina KL, McQueeny T, Nagel BJ, Hanson K, Schweinsburg L, Tapert ADSF. Prefrontal cortex volumes in adolescents with alcohol use disorders: unique gender effects. Alcohol Clin Exp Res. 2008;32:386–394. doi: 10.1111/j.1530-0277.2007.00602.x. [DOI] [PMC free article] [PubMed] [Google Scholar]
- Nagel BJ, Schweinsburg AD, Phan V, Tapert SF. Reduced hippocampal volume among adolescents with alcohol use disorders without psychiatric comorbidity. Psychiatry Res. 2005;139:181–190. doi: 10.1016/j.pscychresns.2005.05.008. [DOI] [PMC free article] [PubMed] [Google Scholar]
- Olson EA, Hooper CJ, Collins P, Luciana M. Adolescents’ performance on delay and probability discounting tasks: contributions of age, intelligence, executive functioning, and self-reported externalizing behavior. Pers Individ Dif. 2007;43:1886–1897. doi: 10.1016/j.paid.2007.06.016. [DOI] [PMC free article] [PubMed] [Google Scholar]
- Pfefferbaum A, Mathalon DH, Sullivan EV, Rawles JM, Zipursky RB, Lim KO. A quantitative magnetic resonance imaging study of changes in brain morphology from infancy to late adulthood. Arch Neurol. 1994;51:874–887. doi: 10.1001/archneur.1994.00540210046012. [DOI] [PubMed] [Google Scholar]
- Raznahan A, Shaw P, Lalonde F, Stockman M, Wallace GL, Greenstein D, Clasen L, Gogtay N, Giedd JN. How does your cortex grow? J Neurosci. 2011;31:7174–7177. doi: 10.1523/JNEUROSCI.0054-11.2011. [DOI] [PMC free article] [PubMed] [Google Scholar]
- Reuter M, Rosas HD, Fischl B. Highly accurate inverse consistent registration: a robust approach. NeuroImage. 2010;53:1181–1196. doi: 10.1016/j.neuroimage.2010.07.020. [DOI] [PMC free article] [PubMed] [Google Scholar]
- Roche KM, Ahmed S, Blum RW. Enduring consequences of parenting for risk behaviors from adolescence into early adulthood. Soc Sci Med. 2008;66:2023–2034. doi: 10.1016/j.socscimed.2008.01.009. [DOI] [PubMed] [Google Scholar]
- SAMHSA. The NSDUH Report, Office of Applied Studies. Substance Abuse and Mental Health Services Administration; Bethesda: 2005. Alcohol Use and Delinquent Behaviors among Youths. [Google Scholar]
- SAMHSA. NSDUH Series H-30, DHHS Pub No SMA 06-4194. Office of Applied Studies; Rockville, MD: 2006. Results From the 2005 National Survey on Drug Use and Health: National Findings. [Google Scholar]
- SAMHSA. NSDUH Series H-38A, HHS Publication No SMA 10-4586. I. Office of Applied Studies; Rockville, MD: 2010. Results from the 2009 National Survey on Drug Use and Health. Summary of National Findings. [Google Scholar]
- Scheres A, Dijkstra M, Ainslie E, Balkan J, Reynolds B, Sonuga-Barke E, Castellanos FX. Temporal and probabilistic discounting of rewards in children and adolescents: effects of age and ADHD symptoms. Neuropsychologia. 2006;44:2092–2103. doi: 10.1016/j.neuropsychologia.2005.10.012. [DOI] [PubMed] [Google Scholar]
- Schilling C, Kuhn S, Paus T, Romanowski A, Banaschewski T, Barbot A, Barker GJ, Bruhl R, Buchel C, Conrod PJ, Dalley JW, Flor H, Ittermann B, Ivanov N, Mann K, Martinot JL, Nees F, Rietschel M, Robbins TW, Smolka MN, Strohle A, Kathmann N, Garavan H, Heinz A, Schumann G, Gallinat J, IMAGEN Consortium. Cortical thickness of superior frontal cortex predicts impulsiveness and perceptual reasoning in adolescence. Mol Psychiatry. 2013;18:624–630. doi: 10.1038/mp.2012.56. [DOI] [PubMed] [Google Scholar]
- Segonne F, Pacheco J, Fischl B. Geometrically accurate topology-correction of cortical surfaces using nonseparating loops. IEEE Trans Med Imaging. 2007;26 (4):518–529. doi: 10.1109/TMI.2006.887364. [DOI] [PubMed] [Google Scholar]
- Ségonne F, Dale AM, Busa E, Glessner M, Salat D, Hahn HK, Fischl B. A hybrid approach to the skull stripping problem in MRI. Neuroimage. 2004;22:1060–1075. doi: 10.1016/j.neuroimage.2004.03.032. [DOI] [PubMed] [Google Scholar]
- Sled JG, Zijdenbos AP, et al. A nonparametric method for automatic correction of intensity nonuniformity in MRI data. IEEE Trans Med Imaging. 1998;17:87–97. doi: 10.1109/42.668698. [DOI] [PubMed] [Google Scholar]
- Steinberg L, Graham S, O’Brien L, Woolard J, Cauffman E, Banich M. Age differences in future orientation and delay discounting. Child Dev. 2009;80:28–44. doi: 10.1111/j.1467-8624.2008.01244.x. [DOI] [PubMed] [Google Scholar]
- Stone AL, Becker LG, Huber AM, Catalano RF. Review of risk and protective factors of substance use and problem use in emerging adulthood. Addict Behav. 2012;37:747–775. doi: 10.1016/j.addbeh.2012.02.014. [DOI] [PubMed] [Google Scholar]
- Tarter R, Vanyukov M, Giancola P, Dawes M, Blackson T, Mezzich A, Clark DB. Etiology of early age onset substance use disorder: a maturational perspective. Dev Psychopathol. 1999;11:657–683. doi: 10.1017/s0954579499002266. [DOI] [PubMed] [Google Scholar]
- Webb JA, Baer PE, Caid CD, McLaughlin RJ, McKelvey RS. Concurrent and longitudinal assessment of risk for alcohol use among seventh graders. J Early Adolesc. 1991;11:450–465. [Google Scholar]
- Welch KA, Carson A, Lawrie SM. Brain structure in adolescents and young adults with alcohol problems: systematic review of imaging studies. Alcohol Alcohol. 2013;48:433–444. doi: 10.1093/alcalc/agt037. [DOI] [PubMed] [Google Scholar]
- Zucker RA. Scaling the developmental momentum of alcoholic process via the lifetime alcohol problems score. Alcohol Alcohol Suppl. 1991;1:505–510. [PubMed] [Google Scholar]
- Zucker RA, Fitzgerald HE. Drinking and Drug History Form for Children. University of Michigan Department of Psychiatry, Addiction Research Center; Ann Arbor: 1994. [Google Scholar]
- Zucker R, Fitzgerald H, Noll R. Drinking and Drug History (Revised edition, Version 4) University of Michigan Department of Psychiatry, Addiction Research Center; Ann Arbor: 1990. [Google Scholar]
- Zucker RA, Ellis DA, Bingham CR, Fitzgerald HE, Sanford KP. Other evidence for at least two alcoholisms. II: Life course variation in antisociality and heterogeneity of alcoholic outcome. Dev Psychopathol. 1996;8:831–848. [Google Scholar]
- Zucker RA, Fitzgerald HE, Refior SK, Puttler LI, Pallas DM, Ellis DA. The clinical and social ecology of childhood for children of alcoholics: description of a study and implications for a differentiated social policy. In: Fitzgerald HE, Lester BM, Zuckerman BS, editors. Children of Addiction: Research, Health and Policy Issues. Routledge Falmer; New York: 2000. pp. 109–141. [Google Scholar]
- Zucker RA, Wong MM, Pputtler LI, Fitzgerald HE. Resilience and vulnerability among sons of alcoholics: relationship to developmental outcomes between early childhood and adolescence. In: Luthar S, editor. Resilience and Vulnerability: Adaptation in the Context of Childhood Adversities. Cambridge University Press; New York: 2003. pp. 76–103. [Google Scholar]
- Zucker RA, Donovan JE, Masten AS, Moss HB. Early developmental processes and the continuity of risk for underage drinking and problem drinking. Pediatrics. 2008;121 (Suppl 4):S252–S272. doi: 10.1542/peds.2007-2243B. [DOI] [PMC free article] [PubMed] [Google Scholar]