Abstract
As the concentrations of highly consumed nutrients, particularly glucose, are generally lower in tumours than in normal tissues1,2, cancer cells must adapt their metabolism to the tumour microenvironment. A better understanding of these adaptations might reveal cancer cell liabilities that can be exploited for therapeutic benefit. Here, we developed a continuous flow culture apparatus (Nutrostat) for maintaining proliferating cells in low nutrient media for long periods of time and used it to undertake competitive proliferation assays on a pooled collection of barcoded cancer cell lines cultured in low glucose conditions. Sensitivity to low glucose varies amongst cell lines, and an RNAi screen pinpointed mitochondrial oxidative phosphorylation (OXPHOS) as the major pathway required for optimal proliferation in low glucose. We found that cell lines most sensitive to low glucose are defective in the upregulation of OXPHOS normally caused by glucose limitation as a result of either mtDNA mutations in Complex I genes or impaired glucose utilization. These defects predict sensitivity to biguanides, anti-diabetic drugs that inhibit OXPHOS3,4, when cancer cells are grown in low glucose or as tumour xenografts. Remarkably, the biguanide sensitivity of cancer cells with mtDNA mutations was reversed by ectopic expression of yeast NDI1, a ubiquinone oxidoreductase that allows bypass of Complex I function5. Thus, we conclude that mtDNA mutations and impaired glucose utilization are potential biomarkers for identifying tumours with increased sensitivity to OXPHOS inhibitors.
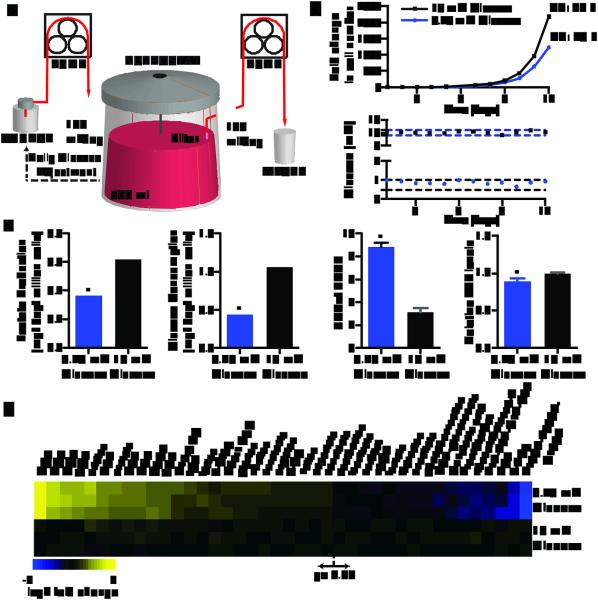
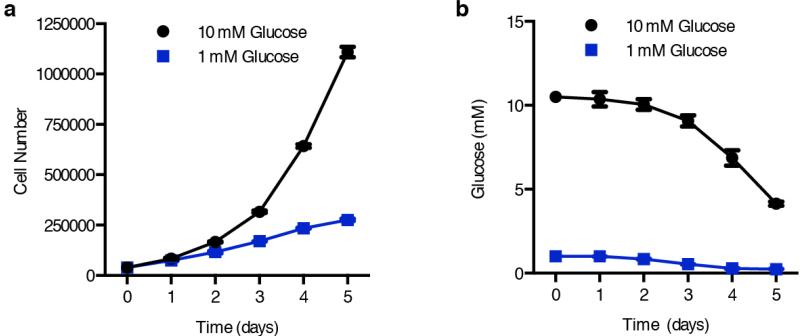
As nutrient concentrations in tumours are different than in normal tissues, cancer cells in vivo may have metabolic dependencies that are not shared by normal cells6. In particular, tumour glucose concentrations are frequently 3-10 fold lower than in non-transformed tissues1,7, likely as a result of the high rate of glucose consumption by cancer cells and the poor tumour vasculature. To study the metabolic dependencies imposed on cancer cells by a chronically low glucose environment, we developed a continuous flow culture system for maintaining proliferating cells in reduced but steady glucose concentrations for long periods of time. In this system, which we call a Nutrostat, media of a defined glucose concentration is fed into a suspension culture while spent media is removed at the same rate (Fig. 1a). By measuring cell proliferation and glucose concentrations, glucose consumption can be predicted and glucose levels in the intake media adjusted so that culture glucose concentrations remain within a 0.5 mM window (Fig. 1b). Jurkat leukemia cells seeded into 1 mM glucose media in a traditional culture vessel rapidly ceased proliferating as glucose became exhausted (Extended Data Fig. 2). In contrast, in a Nutrostat maintained at ~0.75 mM glucose, Jurkat cells proliferated exponentially at a rate that was only slightly less than in ~10 mM glucose (doubling time of 26 versus 24 hours, Fig. 1b). Despite having a small effect on Jurkat cell proliferation, long term culture in low glucose caused profound metabolic changes: rates of glucose consumption, lactate production and ATP levels decreased as did levels of intermediates in the upper glycolysis and pentose-phosphate pathways (Fig. 1c, d).
Figure 1. Nutrostat design and metabolic characterization of cancer cells under chronic glucose limitation.
a, Nutrostat Schematic. b, Fold change in cell number (top) and media glucose concentration (bottom) of Jurkat cells grown in Nutrostats at 10 mM (black) or 0.75 mM (blue) glucose. DT = doubling time. c, Indicated metabolite levels in Nutrostats at 10 mM (black) or 0.75 mM (blue) glucose. d, Differential intracellular metabolite abundances (p < 0.05) from cells in Nutrostats at 10 mM (bottom three rows) or 0.75 mM (top three rows) glucose. Color bar indicates scale (Log2 transformed). Error bars where shown are SEM (n=2 (glucose and lactate), 3 (NAD(H) ratio) and 8 for ATP levels). Replicates are biological, means reported. Asterisks indicate significance p < 0.05 by two-sided student’s t-test.
Extended Data Fig. 2. Proliferation and media glucose levels in standard culture conditions.
a, Jurkat cell proliferation under 10 mM (black) versus 1 mM (blue) glucose in standard culture conditions. b, Media glucose concentrations over time from cultures in (a). Error bars are SEM, n=3. Replicates are biological, means reported. Asterisks indicate significance p < 0.05 by two-sided student’s t-test.
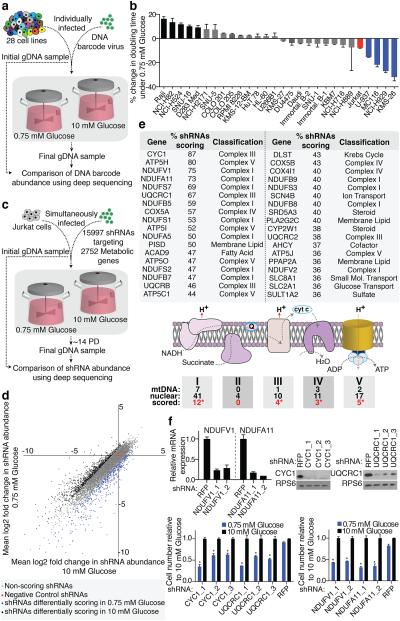
To determine if all cancer cells respond similarly to long term low glucose culture we undertook a competitive proliferation assay with a pooled collection of 28 patient-derived cancer cell lines, each marked with a lentivirally transduced DNA barcode (Fig. 2a). All cell lines were capable of proliferating in suspension and many were derived from blood cancers but also from breast, lung, stomach, and colon cancers. The relative abundance of each cell line at the initial seeding and after three weeks in culture at 0.75 or 10 mM glucose was determined by deep sequencing of the barcodes, and the change in doubling time calculated for each cell line (Fig. 2b, Supplementary Table 1). Interestingly, cancer cell lines exhibit diverse responses to glucose limitation, as the proliferation of many was unaffected, whereas that of a subset was strongly reduced and another, surprisingly, increased (Fig. 2b). The presence or absence of known oncogenic mutations did not correlate with differences in low glucose sensitivity.
Figure 2. Barcode-based cell competition assay and RNAi screen in Nutrostats.
a, Experimental design of cell competition assay. b, Percent changes in doubling times of indicated cell lines in the competition assay, benchmarked to Jurkat cells (red). Significant increase (black) or decrease (blue) in doubling time indicated (p < 0.05). c, Experimental design outline of RNAi-based screen. d, Primary screening data (mean Log2 fold change) in 10 mM (X-axis) versus 0.75 mM (Y-axis) glucose. e, Genes scoring as preferentially required in 0.75 mM glucose (top). Diagram of mitochondrial OXPHOS Complexes. Number of mitochondria- or nuclear-encoded components and number of nuclear-encoded genes that scored indicated (red text). Asterisks indicate significance of gene class: Complex I (p < 9.3 × 10−49), III (p < 6.6 × 10⁻²⁰), IV (p < 8.3 × 10⁻¹⁰) and V (p < 5.6 × 10⁻¹⁹) by chi-squared test. f, Gene suppression of cells expressing indicated shRNAs (top) and proliferation (bottom) in 0.75 mM (blue) relative to 10 mM glucose (black). Asterisks indicate significance (p < 0.05) relative to shRFP, 0.75 mM glucose. Error bars are SEM (n=3). Replicates are biological, means reported. Asterisks in f indicate significance p < 0.05 by two-sided student’s t-test.
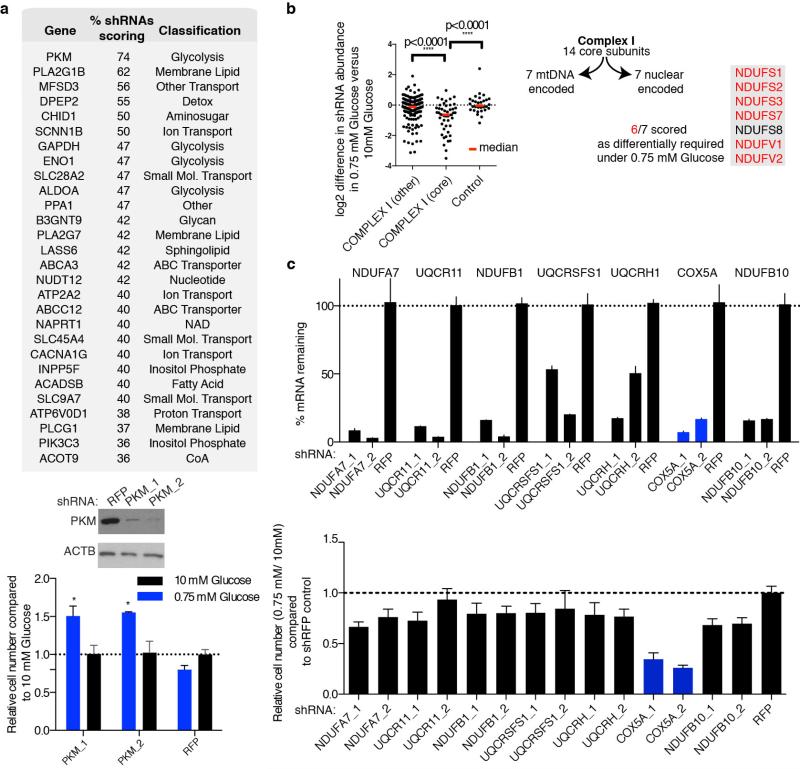
To understand the metabolic processes that mediate the response to glucose limitation, we used a cell line of modest glucose sensitivity (Jurkat) to undertake a pooled RNAi screen of 2,752 human metabolic enzymes and small molecule transporters (15,997 total shRNAs; 5-10 shRNAs per gene) in high or low glucose media in Nutrostats (Fig. 2c). For control shRNAs and the great majority of gene-targeting shRNAs, the average fold change in shRNA abundance was similar in both conditions (Fig. 2d, Supplementary Table 2). However, 10.5% of shRNAs were differentially depleted and, based on our hit criteria (see methods8), we identified 28 and 36 genes whose suppression preferentially inhibited cell proliferation in high or low glucose, respectively (Fig. 2e, Supplementary Table 3 and Extended Data Fig. 3a). Genes selectively required in 10 mM glucose fell into several pathways but were enriched for glycolytic genes (GAPDH, ALDOA, PKM, ENO1; p < 8.6 × 10⁻⁷). In striking contrast, genes selectively required under 0.75 mM glucose consisted almost exclusively of the nuclear-encoded components of mitochondrial oxidative phosphorylation (OXPHOS, Fig. 2e). Amongst the scoring genes were six of the seven nuclear-encoded core Complex I subunits conserved between mammals and bacteria9, a significant enrichment compared to non-core subunits (p < 0.0012, Extended Data Fig. 3b). Two genes required for OXPHOS function, ACAD9 and PISD9,10, also scored, as did SLC2A1, the gene encoding the GLUT1 glucose transporter. Short-term individual assays validated that efficient suppression of top scoring OXPHOS genes selectively decreased proliferation under low glucose, while hairpins targeting non-scoring OXPHOS genes did so to a significantly lesser extent (Fig. 2f and Extended Data Fig. 3c). Thus, a screen of metabolic genes pinpointed OXPHOS as the key metabolic process required for optimal proliferation of cancer cells under glucose limitation.
Extended Data Fig. 3. Additional Data supporting RNAi Screen.
a, Genes scoring as differentially required in 10 mM glucose compared to 0.75 mM glucose (top). Percent shRNAs scoring and pathway classification indicated. Immunoblots (below) depict suppression of PKM by shRNAs (PKM_1, PKM_2) compared to control (RFP). Bottom, proliferation of cells in 0.75 mM (blue) relative to 10 mM glucose (black) harboring shRNAs targeting PKM or control. Asterisks indicate probability value (p) < 0.05 relative to RFP 0.75 mM glucose. b, Nuclearly encoded core Complex I genes are written in the grey box indicating those which score (right, red text). Dot plot reports differential essentiality in 10 mM versus 0.75 mM glucose of individual shRNAs targeting non-core Complex I genes, core Complex I genes, or non-targeting controls. Red bar is the population median. c, Top, mRNA levels of the non-scoring OXPHOS genes (black) and the scoring OXPHOS gene (blue) indicated upon suppression with the shRNAs indicated as measured by qPCR, relative to a non-targeting shRNA (RFP). Bottom, cell number from seven day proliferation assay of cells in 0.75 mM glucose relative to 10 mM glucose (not shown) harboring the indicated shRNAs. shRFP control normalized to 1. Error bars are SEM, n=3. Replicates are biological, means reported. Asterisks indicate significance p < 0.05 by two-sided student’s t-test.
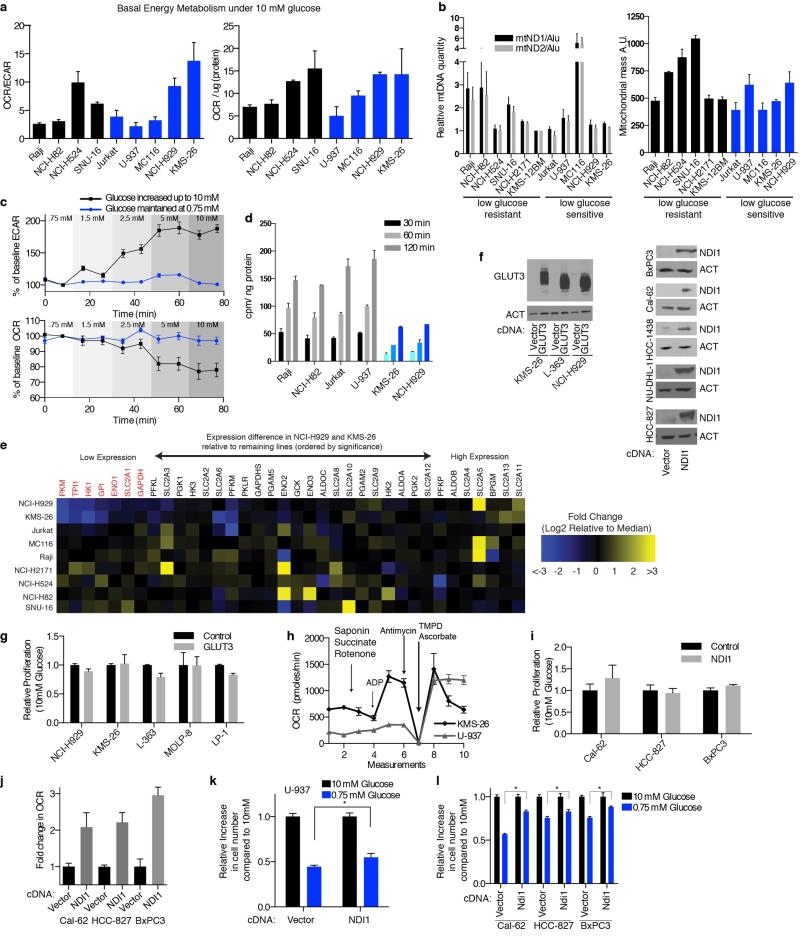
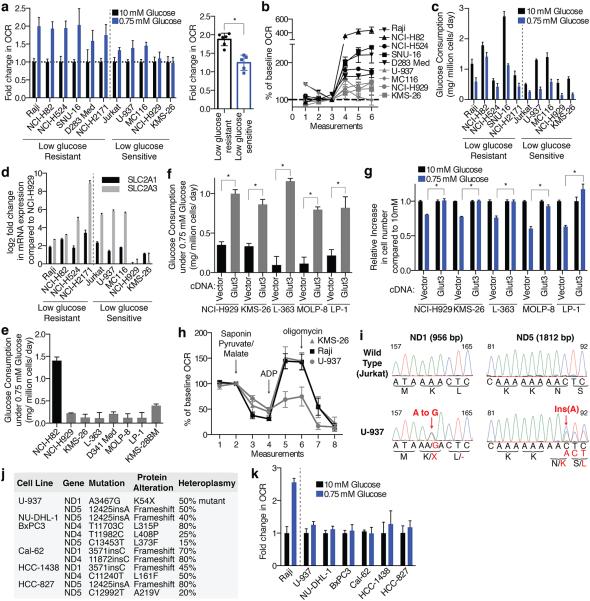
Given these very clear results it seemed likely that fundamental differences in mitochondrial function exist between cancer cell lines that are most sensitive (U-937, MC116, NCI-H929, KMS-26) and resistant (Raji, NCI-H82, NCI-H524, SNU-16, NCI-H2171) to glucose limitation. However, we did not detect any differences in mitochondrial DNA content, mitochondrial mass, and baseline oxygen consumption rate (OCR, Extended Data Fig. 4a,b). Therefore, we considered whether a key difference is in the mitochondrial response to glucose limitation, which reversibly induces oxygen consumption11 (Extended Data Fig. 4c). Indeed, when cultured in low glucose media, the low glucose sensitive cell lines upregulated OCR less than the resistant ones (Fig. 3a). Furthermore, in response to the mitochondrial uncoupling agent FCCP, low glucose sensitive cell lines induced OCR to a lesser extent than resistant lines, indicating they have reduced spare respiratory capacities (Fig. 3b).
Extended Data Fig. 4. Additional data characterizing mitochondrial dysfunction and impaired glucose utilization in cancer cell lines.
a, Oxygen consumption rate (OCR) to extracellular acidification rate (ECAR) ratio (left) or OCR normalized to protein content (right) for glucose limitation resistant (black) or sensitive (blue) cell lines. b, Left, mitochondrial DNA content for indicated cell lines by qPCR using primers targeting ND1 (black) or ND2 (grey) normalized to gDNA repetitive element (Alu) relative to KMS-12BM. Right, mitochondrial mass measured by fluorescence intensity of mitotracker green dye for indicated cell lines. c, Percent change from baseline (second measurement) of ECAR or OCR in Jurkat cells where glucose concentration was maintained at 0.75 mM (blue) or increased to indicated concentrations (black). d, Uptake of 3H-labeled 2-DG (counts per minute per ng protein) in 0.75 mM glucose at indicated timepoints in GLUT3 high (grey) or low (blue) cell lines. e, Heatmap of gene expression values for genes indicated at top and cell lines indicated at left. Genes organized by p-value with lowest expressed genes in NCI-H929 and KMS-26 at left, those significantly lower are colored red. Expression values reported are Log2 transformed fold difference from the median (scale color bar at right). f, Immunoblots for GLUT3 and NDI1 expression in indicated cell lines (beta-actin loading control). g,i, Proliferation of cell number in cells over-expressing GLUT3 or NDI1 relative to control vector (4 days). h, OCR of permeabilized cell indicated upon addition of indicated metabolic toxins and substrates. j, Fold change in OCR in indicated cells expressing NDI1 relative to control vector. k-l, Proliferation for 4 days of control (Vector) or NDI1 expressing cell lines indicated (NDI1) under 10 mM (black) and 0.75 mM glucose (blue). Error bars are SEM, n=4 for a-c, h, j; n=3 for d, g, i, k, l. Replicates are biological, means reported. Asterisks indicate significance p < 0.05 by two-sided student’s t-test.
Figure 3. Deficiencies in glucose utilization or Complex I underlie low glucose sensitivity of cancer cells.
a, Fold change in oxygen consumption rate (OCR) in 0.75 (blue) relative to 10 mM glucose (black) in indicated cell lines individually (left) or in aggregate (right). b, Percent change in OCR relative to third basal measurement and upon addition of FCCP (measurements 4-6) in low glucose resistant (black) or sensitive lines (grey). c, Glucose consumption rate in 10 mM (black) or 0.75 mM glucose (blue). d, Expression (qPCR) of SLC2A1 (black) or SLC2A3 (grey) of indicated cell lines (log2 scale relative to NCI-H929). e-f, Glucose consumption rate of indicated cell lines under 0.75 mM glucose. g, Proliferation (4 days) of control (Vector) or GLUT3 over-expressing (GLUT3) cell lines in 10 mM (black) or 0.75 mM glucose (blue). h, OCR of saponin-permeabilized lines given indicated substrates. i, Sanger sequencing of ND1 and ND5 with corresponding wild-type (black) and mutant (red) nucleotide and protein sequences. j, mtDNA mutations in Complex I genes identified in indicated cell lines. k, Fold increase in OCR of indicated cell lines in 0.75 mM (blue) relative to 10 mM glucose (black). Error bars are SEM (n=6 for a, b, h, k; n=5 for c, e, f; n=3 for d, g). Replicates are biological, means reported. Asterisks indicate significance p < 0.05 by two-sided student’s t-test.
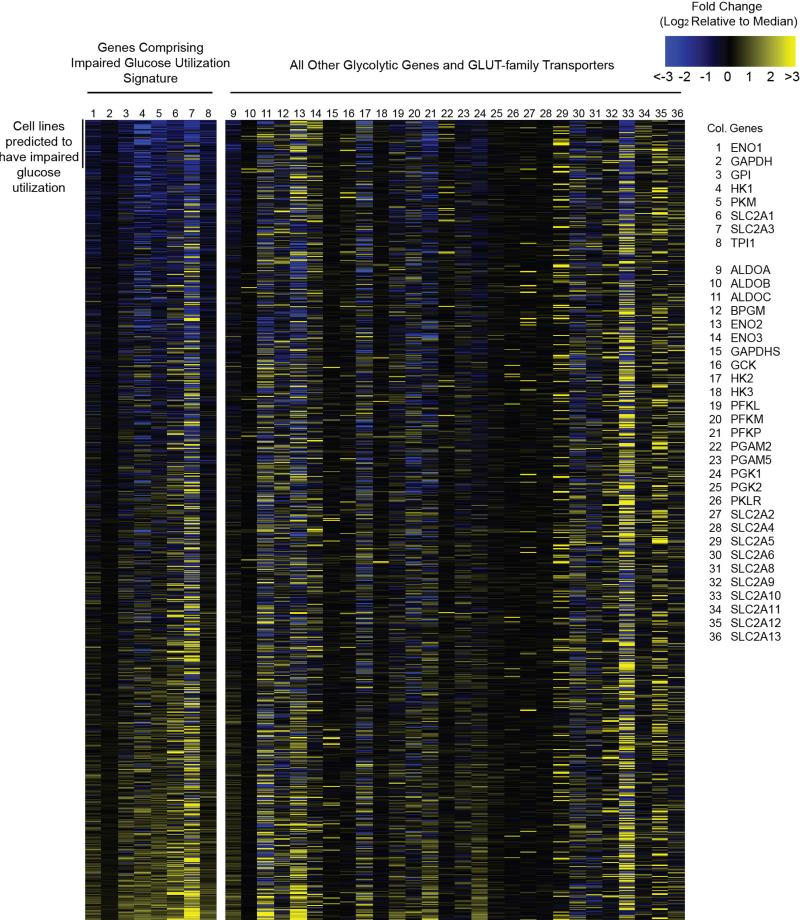
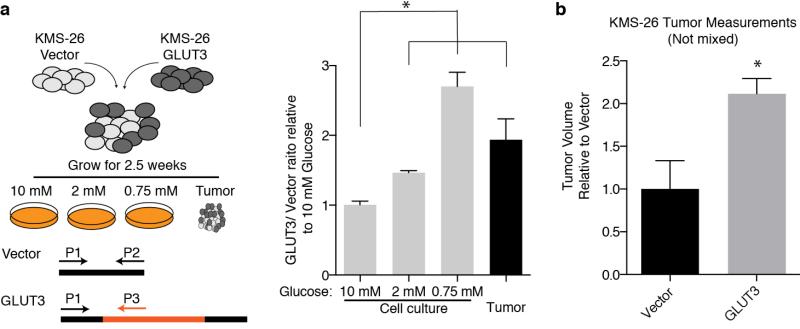
We considered two explanations for why low glucose sensitive lines do not substantially increase oxygen consumption upon glucose limitation: (1) a defect in glucose utilization that limits substrates for mitochondria, or (2) a defect in OXPHOS itself. Consistent with the first possibility, glucose consumption (Fig. 3c) and import (Extended Data Fig. 4d) under low glucose conditions were defective in two (NCI-H929 and KMS-26) of the low glucose sensitive cell lines. Analysis of publicly available gene expression data revealed that these cell lines have low expression of the GLUT3 and GLUT1 glucose transporters, which we verified by qPCR (Fig. 3d), as well as lower levels of several glycolytic enzymes (Extended Data Fig. 4e). Using gene expression data for 967 cell lines12 we identified additional lines with this expression signature and obtained five of them (Extended Data Fig. 5 and Supplementary Table 4). In low glucose media, the five lines (LP-1, L-363, MOLP-8, D341 Med, KMS-28BM) had the predicted defect in glucose consumption and proliferation, like NCI-H929 and KMS-26 cells (Fig. 3e and Extended Data Fig. 8b). In all cell lines tested (KMS-26, NCI-H929, L-363, LP-1, MOLP-8), GLUT3 over-expression was sufficient to rescue these phenotypes (Fig. 3f and 3g, Extended Data Fig. 4f), while not substantially affecting proliferation in high glucose (Extended Data Fig. 4g), arguing that a glucose utilization defect can account for why the proliferation of certain cancer cells is sensitive to low glucose. Indeed, in a competitive proliferation assay, over-expression of GLUT3 provides a growth advantage to KMS-26 cells compared to vector infected controls grown under 0.75-2.0 mM glucose in culture and in tumor xenografts (Extended Data Fig. 6).
Extended Data Fig. 5. Gene expression signature for identifying cell lines with impaired glucose utilization.
Heatmap of gene expression values for the genes indicated on the right for the cell lines in the CCLE set. Gene expression values are reported as the difference from the median across the entire sample set according to the scale color bar on the upper right. Genes 1-8 comprised the gene expression signature used to identify samples with impaired glucose utilization. Samples are sorted based upon this signature with those predicted to exhibit impaired glucose utilization at the top. The order of samples and all values are reported in Supplementary Table 4.
Extended Data Fig. 8. Additional data supporting the hypersensitivity of cell lines with the identified biomarkers to biguanides.
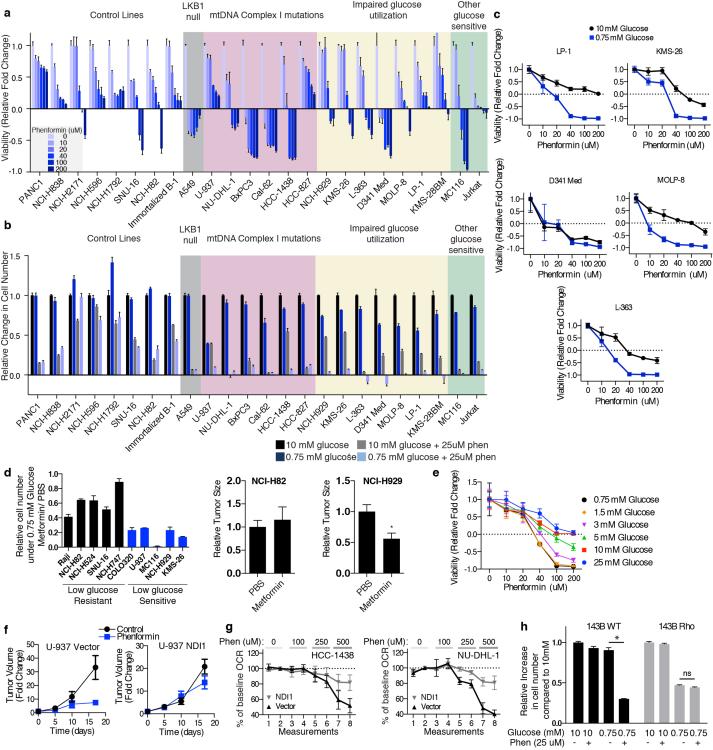
a-b, Viability (a, 10 mM glucose) or relative change in cell number (b, 4 days, glucose concentration indicated in key) of indicated cell lines at phenformin concentrations indicated. Viability measured by ATP levels on Day 3 at phenformin concentrations indicated by black-blue scale, compared to ATP levels on Day 0. Value of 1 indicates fully viable cells (untreated). Value of 0 indicates no change in ATP level compared to Day 0 (cytostatic). Negative values indicate decrease in ATP levels (-1 indicates no ATP). c, Viability as in (a) of indicated cell lines under 0.75 mM and 10 mM glucose at indicated phenformin concentrations. d, Left, relative change in cell number in 0.75 mM glucose, 2 mM metformin relative to untreated in glucose limitation resistant (black) and sensitive (blue) cell lines. Right, relative size of tumor xenografts derived from the indicated cell lines in mice injected with PBS or metformin (IP, 300 mg/kg/day). e, Viability as in (a) of NCI-H929 cells at the indicated concentrations of phenformin and glucose. f, Relative size of indicated cell line xenografts in mice treated with PBS or phenformin (1.7 mg/ml in drinking water). g, Percent change in oxygen consumption rate (OCR) of control (Vector) or NDI1-expressing lines (NDI1) relative to the second basal measurement and at indicated phenformin concentrations. h, Proliferation of 143B wild type or 143B rho (no mtDNA) cell lines under 0.75 mM or 10 mM glucose with or without phenformin treatment. Error bars are SEM (n=4 for a, c, e, g; n=3 for b, d, and h (left); n=5 for d (right) and f). Replicates are biological, means reported. Asterisks indicate significance p < 0.05 by two-sided student’s t-test.
Extended Data Fig. 6. GLUT3 over-expression increases tumor xenograft growth and cell proliferation in low glucose media.
a, KMS-26 cell lines infected with GLUT3 overexpressing vector or infected with control vector were mixed in equal proportions and cultured under different glucose concentrations. Additionally, these mixed cell lines were injected into NOD/SCID mice subcutaneously. 2.5 weeks later, genomic DNA was isolated from tumors as well as cells grown in vitro under the indicated glucose concentrations. Using qPCR, relative abundance of control vector and GLUT3 vector were determined and plotted relative to 10 mM glucose in culture (n=9). b, Average volume of unmixed tumor xenografts from KMS-26 cell lines infected with GLUT3 overexpressing vector relative to control vector (2.5 weeks) (n=6). Replicates are biological, means reported. Asterisks indicate significance p < 0.05 by two-sided student’s t-test.
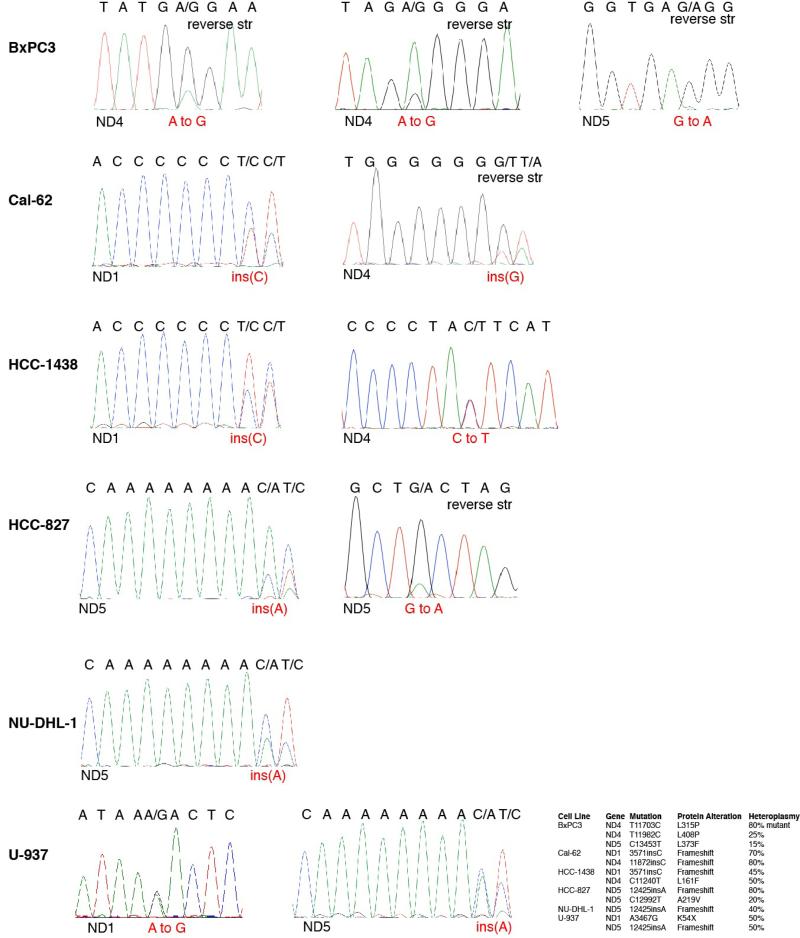
To investigate if defects in OXPHOS might be a distinct mechanism underlying low glucose sensitivity, we focused on U-937 cells as they have low basal OCR but normal glucose utilization (Fig. 3c and Extended Data Fig. 4a). Indeed, in permeabilized cell mitochondrial function assays, U-937 cells had a profound defect in utilizing substrates for Complexes I (pyruvate and malate) and II (succinate), but not Complex IV (TMPD and ascorbate) (Fig. 3h, Extended Data Fig. 4h). Sequencing of the 7 Complex I subunits encoded by the mitochondrial genome (mtDNA) revealed heteroplasmic truncating mutations in ND1 and ND5 in U-937 cells (Fig. 3i).
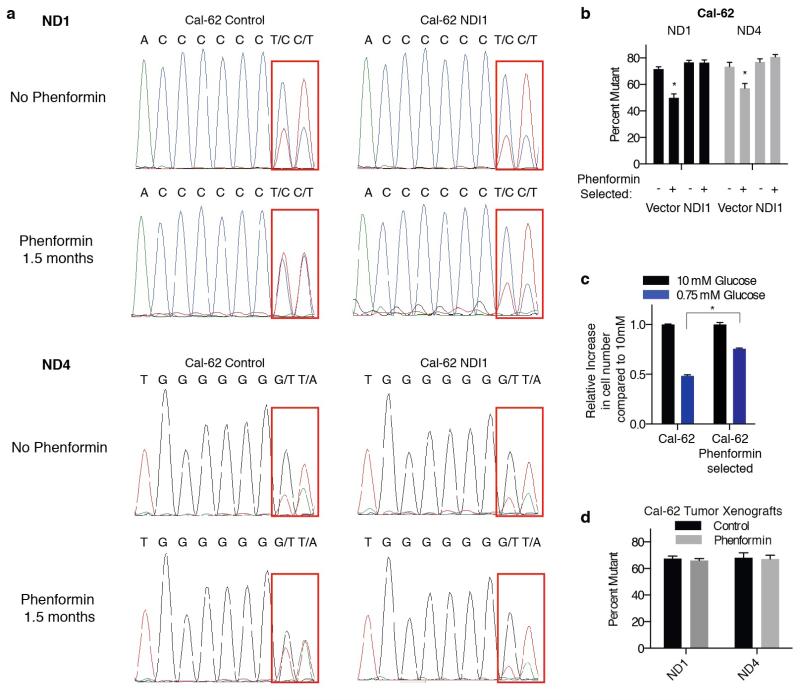
We used available cancer genome resequencing data and information from the literature12,13 to identify additional cell lines with mtDNA mutations in Complex I subunits and obtained five, including two with the same ND5 mutation as U-937 cells (Fig. 3j, Extended Data Fig. 7). Like U-937, the additional lines (BxPC3, Cal-62, HCC-1438, HCC-827, NU-DHL-1) weakly boosted OCR in low glucose media (Fig. 3k) and had a proliferation defect in this condition (Extended Data Fig. 8b). To ask if these phenotypes are caused by Complex I dysfunction, we expressed the S. cerevisiae NDI1 gene, which catalyzes electron transfer from NADH to ubiquinone without proton translocation5,14. NDI1 expression significantly increased the basal OCR of the Complex I defective cells (Cal-62, HCC-827, BxPC3, U-937) and partly rescued their proliferation defect in low glucose, while not substantially affecting proliferation in high glucose (Extended Data Fig. 4f,i-l). In an alternative approach, culture of Cal-62 cells for 1.5 months in the presence of a Complex I inhibitor (phenformin) yielded a population of cells with significantly enriched wild-type mtDNA content and a corresponding decrease in sensitivity to low glucose, changes not observed in cells expressing NDI1 (Extended Data Fig. 9). Taken together, these data identify defective glucose utilization and mitochondrial dysfunction as two distinct mechanisms for conferring sensitivity to glucose limitation on cancer cell lines.
Extended Data Fig. 7. Sanger sequencing traces validating mtDNA mutations.
The table summarizing mtDNA mutations in Complex I subunits from Fig. 3j is reproduced at the lower right. Traces for each cell line (left) are shown in the order indicated by the table. “Reverse str” indicates instances when the sequence shown is in the reverse orientation to the revised Cambridge Reference Sequence. For each trace, the gene sequenced is at the bottom left, the DNA sequence is at the top, and the nucleotide alteration is in red text.
Extended Data Fig. 9. Long term treatment of mtDNA mutant cells with phenformin.
a, Sanger-sequencing traces of mtDNA encoded ND1 and ND4 genes from Cal-62 cells expressing NDI1 or control vector cultured under 5-20 uM phenformin or no phenformin for 1.5 months. Regions containing mutant sequence indicated by red box. b, Heteroplasmy levels for mutation in ND1 or ND4 were assessed by measuring the relative areas under the curve from Sanger-sequencing and plotted. c, Cal-62 cell lines cultured with or without phenformin for 1.5 months assessed for their ability to proliferate in 0.75 mM glucose (blue) relative to 10 mM glucose (black). The proliferation assay was for 4 days in the absence of phenformin. d, Heteroplasmy levels of ND1 and ND4 as in b of Cal-62 tumor xenografts in mice treated with or without phenformin for 28 days. Error bars are SEM, n=3. Replicates are biological (c) or technical (b,d), means reported. Asterisks indicate significance p < 0.05 by two-sided student’s t-test.
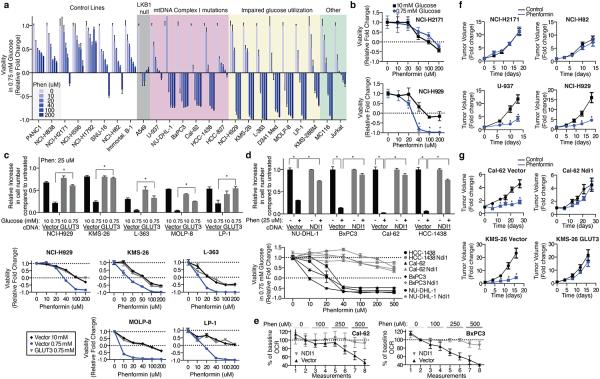
RNAi-mediated suppression of OXPHOS exacerbated the modest sensitivity of Jurkat cells to low glucose (Fig. 2). Thus, we wondered if low glucose sensitive cells lines might be, like LKB1-deficient cells15, particularly sensitive to the biguanide class of pharmacological OXPHOS inhibitors3,4 that includes metformin and the more potent biguanide phenformin3. Indeed, in low glucose media, cell lines with mtDNA-encoded Complex I mutations (U-937, BxPC3, Cal-62, HCC-1438, HCC-827, NU-DHL-1) or impaired glucose utilization (NCI-H929, KMS-26, LP-1, L-363, MOLP-8, D341 Med, KMS-28BM) were 5-20 fold more sensitive to phenformin compared to control cancer cell lines or an immortalized B cell line (Fig. 4a), and similar results were obtained with metformin or when using direct cell counting as a readout (Extended Data Fig. 8a,b,d). The low glucose sensitive cell lines, particularly those with impaired glucose utilization, tended to be more sensitive to phenformin in 0.75 than 10 mM glucose, but substantial sensitivity persisted at 1.5-3.0 mM glucose (Fig. 4b, Extended Data Fig. 8c,e). Importantly, in cells with impaired glucose utilization, GLUT3 over-expression almost completely rescued the phenformin sensitivity specific to the low glucose condition, such that GLUT3-expressing cells in 0.75 mM glucose and control cells in 10 mM glucose were similarly affected by phenformin (Fig. 4c). Likewise, in cells with mutations in Complex I, NDI1 expression almost completely rescued the effects of phenformin on proliferation (Fig. 4d) and oxygen consumption (Fig. 4e, Extended Data Fig. 8g). Phenformin sensitivity is restricted to cells with the intermediate levels of mitochondrial dysfunction typically seen in cancer cells, as cells lacking mtDNA (143B Rho) are insensitive to phenformin but sensitive to low glucose (Extended Data Fig. 8h).
Figure 4. Cancer cells with deficiencies in glucose utilization or Complex I are sensitive to phenformin.
a, Viability of indicated lines, as measured by ATP levels on Day 3 at phenformin concentrations indicated by black-blue scale, in 0.75 mM glucose, compared to ATP levels on Day 0. Value of 1 indicates fully viable cells (untreated). Value of 0 indicates no change in ATP level compared to Day 0 (cytostatic). Negative values indicate decrease in ATP levels (-1 indicates no ATP). b, Viability as in a of NCI-H2171 and NCI-H929 cell lines under 0.75 and 10 mM glucose. c, Relative increase in cell number (top) and viability as in a (bottom) of control (Vector) or GLUT3 over-expressing (GLUT3) cell lines in 10 mM or 0.75 mM glucose at indicated phenformin concentrations relative to untreated cells in 10 mM glucose. d, Relative increase in cell number (top) and viability as in a (bottom) of vector control (black) or NDI1 (grey) expressing lines in 0.75 mM glucose at indicated phenformin concentrations relative to untreated cells in 0.75 mM glucose. e, Percent change in oxygen consumption rate (OCR) of control (Vector) or NDI1-expressing lines (NDI1) relative to the second basal measurement at indicated phenformin concentrations. f, Average volume (relative to Day 0) of established xenografted tumours derived from control (NCI-H2171, NCI-H82), mtDNA Complex I mutant (U-937), or impaired glucose utilization (NCI-H929) cell lines in mice treated with vehicle (black) or phenformin (blue) in drinking water starting at Day 0. g, Average tumor volume as in f of indicated cell lines infected with control, NDI1- or GLUT3-expressing vectors. Error bars are SEM (n=5 for a, b, c (bottom), d (bottom), e and f; n=6 (control) or n=8 (GLUT3 or NDI1) for g; n=3 for c (top) and d (top)). Replicates are biological, means reported. Asterisks indicate significance p < 0.05 by two-sided student’s t-test.
Consistent with these findings and with the low glucose environment of tumors1,2,7, phenformin inhibited the growth of mouse tumour xenografts derived from cancer cells with mtDNA mutations (Cal-62, BxPC3, U-937) or poor glucose consumption (KMS-26, NCI-H929), but not from cells lacking these defects (NCI-H2171 and NCI-H82) (Fig. 4f, g). The effects of phenformin on tumour xenograft growth were rescued in mtDNA mutant cells by the introduction of NDI1, and in KMS-26 cells by the over-expression of GLUT3 (Fig. 4g, Extended Data Fig. 8f), demonstrating that the effect of phenformin on these xenografts has a cell autonomous component. Thus, the glucose utilization gene signature described earlier and mutations in mtDNA-encoded Complex I subunits may serve as biomarkers for identifying tumours that are particularly sensitive to phenformin treatment. Such tumours are likely not infrequent as the prevalence of truncating mutations in mtDNA-encoded OXPHOS components is reported to be as high as 16%16 and we detect the low glucose import gene expression signature in at least 5% of cell lines profiled (of which multiple myeloma and small cell lung cancer are significantly enriched). Interestingly, a number of retrospective studies report survival benefits for cancer patients taking metformin17,18, although it has been unclear whether these effects of metformin are cancer cell-autonomous15,19,20.
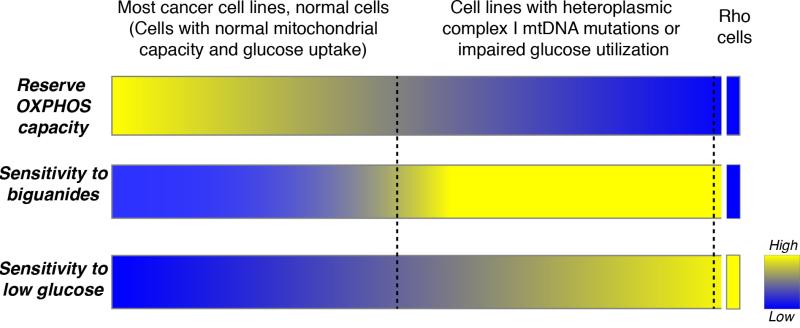
In conclusion, we find that cancer cells exhibit diverse responses to glucose limitation and identify defects in glucose utilization and mitochondrial function as major determinants of low glucose sensitivity (Extended Data Fig. 1). These biomarkers may pinpoint cancer cells likely to respond to OXPHOS inhibition alone under tumor-relevant glucose concentrations. Such a targeted strategy may be better tolerated than previously proposed approaches of combining inhibition of OXPHOS and glycolysis21-23. Moreover, our findings underscore the importance of considering glucose concentrations when evaluating the sensitivity of cancer cells to biguanides or other OXPHOS inhibitors. The methods described here should be valuable for studying the responses of cancer cells to tumour-relevant concentrations of other highly consumed nutrients, such as amino acids24, and to additional compounds that target metabolism.
Extended Data Fig. 1. Model of the metabolic determinants of sensitivity to low glucose and biguanides.
This diagram outlines the interplay between reserve oxidative phosphorylation (OXPHOS) capacity, sensitivity to biguanides, and sensitivity to culture in low glucose. Most cancer cell lines and normal cells tested exhibited an ability to respond to glucose limitation by upregulating OXPHOS, rendering them less sensitive to biguanides and low glucose conditions. In contrast, cell lines harboring mutations in mtDNA encoded Complex I subunits or exhibiting impaired glucose utilization have a limited reserve OXPHOS capacity and are therefore unable to properly respond to biguanides and low glucose, rendering them sensitive to these perturbations. At the extreme, cells artificially engineered to have no OXPHOS (Rho cells) exhibit extreme low glucose sensitivity, but resistance to further inhibition of OXPHOS. Thus, mtDNA mutant cancer cells exist at an intermediate state of OXPHOS functionality that renders them sensitive to treatment with biguanides in vitro and in vivo. Similarly, cell lines with impaired glucose utilization exhibit biguanide sensitivity specifically under the low glucose conditions seen in the tumor microenvironment.
Supplementary Methods
Abbreviations used in the manuscript not defined elsewhere:
- UMP:
Uridine Monophosphate
- CMP:
Cytidine Monophosphate
- GMP:
Guanosine Monophosphate
- AMP:
Adenosine Monophosphate
- CDP:
Cytidine Diphosphate
- UDP:
Uridine Diphosphate
- GDP:
Guanosine Diphosphate
- NAD+/NADH:
Nicotinaminde Adenine Dinucleotide (oxidized and reduced forms)
- NADP:
Nicotinaminde Adenine Dinucleotide Phosphate
- ADP:
Adenosine Diphosphate
- IMP:
Inosine Monophosphate
- 5-HIAA:
5-Hydroxyindoleacetic acid
- 2-HG:
2-hydroxyglutarate
- cAMP:
cyclic AMP
- Fruc:
Fluctose
- Glu:
Glucose
- Gal:
Galactose
- F1P:
Fructose 1-phosphate
- F6P:
Fructose 6-phosphate
- G1P:
Glucose 1-phosphate
- G6P:
Glucose 6-phosphate
- PEP:
Phosphoenolpyruvate
- 3-PGA:
3-phosphoglycerate
- F16DP:
Fructose 1,6-diphosphate
- F26DP:
Fructose 2,6-diphosphate
- G16DP:
Glucose 1,6-diphosphate
- Py:
Pyruvate
- Mal:
Malate
- FCCP:
Carbonyl cyanide 4-(trifluoromethoxy)phenylhydrazone
- TMPD:
N,N,N’,N’-Tetramethyl-p-Phenylenediamine
- CE:
ceramide
- DAG:
Diacylglycerol.
Fatty acids additionally have annotations indicating the number of carbons and number of unsaturated linkages separated by a colon (e.g. 18:2).
Cell Lines and reagents
Cell lines were obtained from the Broad Institute Cancer Cell Line Encyclopedia with the exceptions of HL-60, Daudi, HuT 78, MC116, Raji, and U-937, which were kindly provided by Robert Weinberg (Whitehead Institute, Cambridge, MA, USA), KMS-26 and KMS-27 which were purchased from the JCRB Cell Bank, Immortalized B lines 1 and 2 which were provided by Dr. Christoph Klein (Carl Hannover Medical School, Germany), and Cal-62 which was provided by James A. Fagin (Memorial Sloan-Kettering Cancer Center, New York, NY, USA). To normalize for media specific effects on cell metabolism, all cell lines were grown in RPMI base medium containing 10% heat inactivated fetal bovine serum, 2 mM glutamine, penicillin, and streptomycin. The NDI1 antibody is a kind gift of Takao Yagi (The Scripps Research Institute, La Jolla, California, USA). Additional antibodies used are: Actin (I-19, Santa Cruz), Glut3 (ab15311, Abcam), RPS6 (Cell Signaling), CYC1 (Sigma) and UQCRC1 (H00007384-B01P, Novus).
Cell lines are from the following cancer origins. PANC1 (Pancreas), NCI-H838 (Lung), NCI-H596 (Lung), NCI-H1792 (Lung), A549 (Lung), NU-DHL-1 (Lymphoma), BxPC3 (Pancreas), Cal-62 (Thyroid), HCC-1438 (Lung), HCC-827 (Lung), L-363 (Plasma Cell Leukemia), MOLP-8 (Multiple Myeloma), LP-1 (Multiple Myeloma). Additional cell lines and their tissue origins are listed in Supplementary Table 1. One cell line (SNU-1) was randomly selected for authentication by STR profiling, and cell lines were authenticated by mtDNA sequencing (NCI-H82, Jurkat, NU-DHL-1, U-937, BxPC3, Cal-62, HCC-1438, HCC-827, Raji, MC116, KMS-26, NCI-H929, NCI-H2171).
Lentiviral shRNAs were obtained from the The RNAi Consortium (TRC) collection of the Broad Institute. The TRC#s for the shRNAs used are below. For each gene, the order of the TRC numbers matches the order of the shRNAs as numbered in the manuscript. The TRC website is: http://www.broadinstitute.org/rnai/trc/lib
| CYC1 | (TRCN0000064606, TRCN0000064603, TRCN0000064605), |
| UQCRC1 | (TRCN0000233157, TRCN0000046484, TRCN0000046487) |
| NDUFA7 | (TRCN0000026423, TRCN0000026454) |
| NDUFB1 | (TRCN0000027148, TRCN0000027173) |
| COX5A | (TRCN0000045961, TRCN0000045960) |
| UQCRH | (TRCN0000046528, TRCN0000046530) |
| UQCRFS1 | (TRCN0000046522, TRCN0000046519) |
| NDUFB10 | (TRCN0000026589, TRCN0000026579) |
| UQCR11 | (TRCN0000046465, TRCN0000046467) |
| NDUFA11 | (TRCN0000221374, TRCN0000221376) |
| NDUFV1 | (TRCN0000221380, TRCN0000221378) |
| PKM | (TRCN0000037612, TRCN0000195405) |
| RFP | (TRCN0000072203) |
The retroviral SLC2A3 vector was generated by cloning into the BamHI and EcoRI sites of the pMXS-ires-blast vector a cDNA insert generated by PCR from a cDNA from Open Biosystems (cat # MHS1010-7429646) using the primers below, followed by standard cloning techniques.
| SLC2A3 BamHI F: | GCA TGG ATC CAC CAT GGG CAC ACA GAA GGT CAC |
| SLC2A3 MfeI R: | GCA TCA ATT GTT AGA CAT TGG TGG TGG TCT CC |
The retroviral NDI1 vector was generated by cloning into the EcoRI and XhoI sites of the pMXS-ires-blast vector a cDNA insert generated by PCR from a yeast genomic library using the primers below, followed by standard cloning techniques.
| Ndi1 EcoRI F: | ATGAATTCCATCACATCATCGAATTAC |
| Ndi1 XhoI R: | ATCTCGAGAAAAGGGCATGTTAATTTCATCTATAAT |
Nutrostat Design
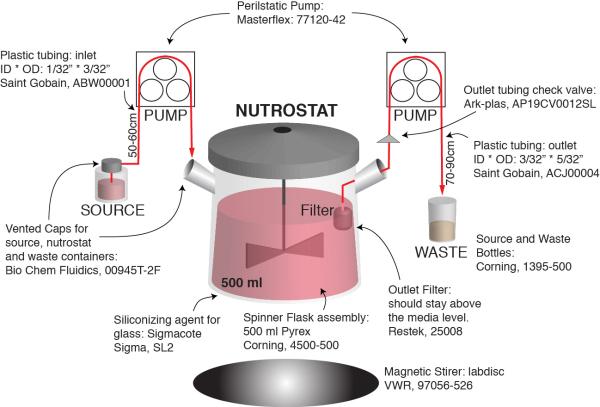
Equipment used in constructing the Nutrostat (Figure 1, see also Extended Data Fig. 10 for schematic): peristaltic pumps with accompanying tubing (Masterflex, manufacturer number 77120-42), 500 mL spinner flasks (Corning, product # 4500-500), 9 position stirplate (Bellco Glass, manufacturer number 7785-D9005) or Lab Disk magnetic stirrer (VWR #97056-526), Tygon tubing (Saint Gobain Performance Plastics, manufacturer number ACJ00004 (outlet, 3/32” × 5/32”) and ABW00001 (inlet, 1/32” × 3/32”), Outlet filter (Restek, catalog number 25008), vented caps for source and waste containers (Bio Chem Fluidics, catalog number 00945T-2F), and outlet tubing check valve (Ark-plas, catalog number AP19CV0012SL) to prevent backflow. Spinner flasks were siliconized before each use using Sigmacote (Sigma #SL2) according to the manufacturer’s method, and autoclaved. Outlet filter was cleaned prior to use by passing phosphate buffered saline and then 70% ethanol through the filter in both the forward and reverse directions. Plastic tubing was replaced prior to each experiment and was cut to 50-60cm pieces and threaded through the caps for the source or waste vessel, over the peristaltic pump, and through the caps on the spinner flask. The outlet tubing was cut ~5 cm from the spinner flask to allow for the introduction of the check valve and prevent back-flow of media. Tubing was adjusted to the following heights: source vessel, bottom; spinner flask inlet, 3 cm from cap (above media level); spinner flask outlet + filter, empirically adjusted so that the volume of media in the vessel is maintained at 500mL; waste vessel, 2 cm from the cap. The entire assembled setup was autoclaved prior to use. Flow rate of the inlet peristaltic pump was adjusted empirically to 100 mL per day using phosphate buffered saline before the introduction of culture media, and the flow rate of the waste pump was set to safely exceed 100mL per day to prevent media accumulation in the vessel. Some escape of cells from the vessel and accumulation in the waste vessel was normal. Media was sampled directly from the vessel by pipette. The mass of glucose consumed by the Nutrostat over time was modeled by the following equation:
Where N0 is the starting cell number, Qglucose is the consumption rate of glucose (g/cell/day), a is the doubling time of the cell line (days), and t is time (days). The values for N0, Qglucose and a were empirically determined before the start of the experiment. The Nutrostat glucose consumption was calculated in hourly increments and balanced by the amount of glucose leaving or entering the chamber such that Gnutrostat over the one hour time interval = ([Gluc]source * Vin) - ([Gluc]nutrostat * Vout) where [Gluc]nutrostat is the Nutrostat glucose concentration, [Gluc]source is the source media glucose concentration, Vout is the volume of media leaving the chamber, and Vin is the volume of media entering the chamber (Vout = Vin = 0.1 L/day). The [Gluc]source was adjusted daily so that the [Gluc]nutrostat predicted by the model remained between the desired glucose concentration boundaries, and adherence of the actual glucose concentration in the Nutrostat to the model was periodically evaluated by measuring the glucose concentration of media samples using a glucose oxidase assay (Fisher Scientific, catalog number TR-15221).
Extended Data Fig. 10. Schematic of Nutrostat setup.
Part numbers, sizes, and dimensions for the Nutrostat assembly are indicated. See methods for additional details.
Pooled shRNA screening
The 2,752 transporters and metabolic enzymes targeted in this study were identified as described25 and are listed in Supplementary Table 2. Lentiviral plasmids encoding ~15,000 shRNAs targeting these genes (median of 5 shRNAs per gene) as well as 30 non-targeting control shRNAs were obtained and combined to generate a single plasmid pool, the composition of which is described in Supplementary Table 2. Plasmid pools were used to generate lentivirus-containing supernatants and target cell lines were infected in 2ug/mL polybrene as described25. Specifically, the titer of lentiviral supernatants was determined by infecting targets cells at several concentrations, counting the number of drug resistant infected cells after 3 days of selection. 30 million target cells were infected at an MOI of ~0.5 to ensure that most cells contained only a single viral integrant and ensure proper library complexity. Infected cells were selected with 0.5 ug/mL puromycin for 3 days. Cells containing shRNA pools were used to inoculate Nutrostats at ~15M cells per 500mL culture. Glucose concentrations were measured daily and adjusted as described above. Cultures were split back once to maintain a cell density of less than 500K cells/mL. Cultures were harvested for genomic DNA extraction after ~15 population doublings, and samples were processed as described25 except that two rounds of PCR were used and the primers used to amplify shRNA inserts and perform deep sequencing (Illumina) are as provided below. shRNAs present at fewer than 100 reads in the initial post-infection sample were eliminated from further analysis. Because the lentiviral pool contained shRNA expression vectors pLKO.1 and pLKO.005, to eliminate any backbone-specific amplification bias, the abundance measurements of shRNAs in the pLKO.005 vector were normalized such that the distribution of shRNA abundances in the pLKO.005 vector matched the distribution of shRNA abundances in the pLKO.1 vector in each sample. Individual shRNAs were identified as differentially scoring in high glucose versus low glucose using a Log2 fold change cutoff of −0.75 (high glucose versus low glucose). For each comparison, genes were considered hits if >33% of the shRNAs targeting that gene scored when averaging across all replicates (“% shRNAs scoring” reported in Fig. 2e). Pathways scoring as preferentially required in low glucose are Complex I (p < 9.3 × 10−49), III (p < 6.6 × 10⁻²⁰), IV (p < 8.3 × 10⁻¹⁰) and V (p < 5.6 × 10⁻¹⁹). The top 1-2 genes scoring by “% shRNAs scoring” from Complex I, III and IV were chosen for validation and are reported in Fig. 2f (Complex I genes NDUFV1 and NDUFA11, and Complex III genes CYC1 and UQCRC1) and Extended Data Fig. 3 (Complex IV gene COX5A). Complex I was followed up going forward in Fig. 3i-k and Fig. 4 using a specific inhibitor (phenformin) since this was the most significantly scoring pathway and because mutations were identified in mitochondrially encoded Complex I subunits in several cell lines, and a high prevalence of somatic mutations in mtDNA encoded Complex I genes have been reported previously in human tumors. Alternative methods for identifying hits from RNAi based screens were employed using the GENE-E program8 (Broad Institute) and the results are reported in Supplementary Table 3. These alternative methods all identify highly significant numbers of Complex I, III, IV and V genes as being differentially essential in 0.75 mM glucose.
Primers for amplifying shRNAs encoded in genomic DNA:
First Round of PCR (15 cycles):
5′ primer: AATGGACTATCATATGCTTACCGTAACTTGAAAGTATTTCG
3′ primer: CTTTAGTTTGTATGTCTGTTGCTATTATGTCTACTATTCTTTCCC
Second Round of PCR:
Barcoded Forward Primer (‘N’s indicate location of sample-specific barcode sequence):
AATGATACGGCGACCACCGAGAAAGTATTTCGATTTCTTGGCTTTATATATCTTGTGGA NNNN ACGA
Common Reverse Primer:
CAAGCAGAAGACGGCATACGAGCTCTTCCGATCTTGTGGATGAATACTGCCATTTGTCTCG AGGTC
Illumina Sequencing Primer: GAGAAAGTATTTCGATTTCTTGGCTTTATATATCTTGTGGA
Cell Barcoding
To mark individual cell lines with DNA barcodes, a unique seven base pair sequence was transduced into cells using lentiviruses produced from a pLKO.1P vector into which the following sequence was cloned utilizing the following primers, which had been annealed and ligated to an AgeI and EcoRI restriction enzyme cut vector:
Sequence inserted (‘N’s indicate location of cell-specific barcode sequence):
| TTTTAGCACTGCCNNNNNNNCTCGCGGGCCGCAGGTCCAT | |
| Primers: | |
| TOP: | CCGGTTTTTAGCATCGCCNNNNNNNCTCGCGGCCGCAGGTCCATG |
| BOTTOM: | AATTCATGGACCTGCGGCCGCGAGNNNNNNNGGCGATGCTAAAAA |
The sequence of individual lentiviral vectors was determined by Sanger sequencing and vectors containing unique sequences were chosen for transduction into cell lines. Each cell line was infected with three barcodes in separate infections so that the proliferation of each cell line could be measured three times independently in a single experiment. Proliferation assays of the individually barcoded cell lines verified that the barcodes did not affect cell proliferation in short term assays. To perform the cell competition assays, all of the barcoded cell lines were mixed in equal proportion with bias for slower proliferating cell lines being over-represented in the initial population. The Nutrostats were inoculated with 5M pooled cells at 10 mM or 0.75 mM glucose concentrations and the proliferation and glucose consumption of the culture carefully monitored to adjust for any time dependent changes in the per cell glucose consumption rate. After 15 population doublings, cells were harvested for genomic DNA isolation and processed for deep sequencing as described above. Barcode abundance was determined in the starting population or after 15 population doublings, and the fold change in barcode abundance relative to the abundance of Jurkat cell line barcodes was calculated. Based on the number of population doublings of the entire culture and the known doubling time of the Jurkat cell line, the doubling time (hours) of each cell line in the mixture was calculated according to the following formula:
Where 293 hours is the duration of the experiment, Log2 FCcell line is the Log2 Fold change in abundance of barcode for the given cell line in the final sample compared to the initial, Log2 FCJurkat is the Log2 fold change for the Jurkat cell line, and PDJurkat is the empirically determined number of population doublings that the Jurkat cell line underwent during 293 hours (i.e. 12.2 doublings in 10 mM glucose and 11.3 doublings in 0.75 mM glucose conditions). These calculated doubling times are reported for each barcode replicate in Supplementary Table 1.
Glucose Consumption and Uptake
Cells were plated in 10 mM or 0.75 mM glucose media at 5-20K cells per mL in 24 well plates in 1 mL media in replicates of four. Media was harvested after four days of culture and the number of cells counted. Harvested media was assayed by a glucose oxidase assay and the absorbance at 500 nm determined of assay buffer plus spent media, media from control wells containing no cells, or media containing no glucose, allowing the concentration of glucose in the spent media to be calculated according to Beer’s Law. The mass of glucose consumed was normalized to the average number of cells present in the well, which was calculated by integrating the number of cells present during the course of the experiment over four days assuming simple exponential growth of the cells during the course of the experiment from the measured starting to final number of cells. For glucose import, cells were incubated in 0.75 mM glucose media overnight. The following day, Tritium-labeled 2-DG (5 μCi/mL, Moravek) in RPMI was added to 300,000 cells in fresh 0.75 mM glucose media. The import was stopped after 30, 60 and 120 min by the addition of cold HBSS containing the Glucose transporter inhibitor Cytochalasin B. The cells were next washed once with ice-cold HBSS and lysed in 400 μl RIPA buffer with 1% SDS. Radioactive counts were determined by a scintillation counter and scintillation reads were normalized to the total protein concentration of each sample.
Metabolite Profiling
For metabolite concentration measurements, 10 million Jurkat cells were cultured in Nutrostats for 2 weeks before metabolite extraction. Cells were rapidly washed three times with cold PBS, and metabolites were extracted by the addition of 80% ice-cold methanol. Endogenous metabolite profiles were obtained using LC-MS as described 26. Metabolite levels (n = 3 biological replicates) were normalized to cell number.
Lactate and NAD(H) measurements
Lactate was measured as previously described25 using the same medium that was used for glucose consumption measurements (above). NAD(H) was measured using the Fluoro NAD kit (Cell Technology FLNADH 100-2) according to the manufacturer’s protocol.
Bioinformatic identification of cell lines with impaired glucose utilization
Gene expression data for all glycolytic genes and glucose transporters was compared between glucose utilization deficient cell lines (KMS-26 and NCI-H929) and all of the other cell lines, and those genes whose expression was significantly lower in the glucose utilization deficient lines were selected (SLC2A1, HK1, GAPDH, ENO1, GPI, TPI1, and PKM). SLC2A3 was also included as its expression was found to be significantly altered using qPCR (Figure 3d). Log2 transformed expression data for these eight genes was extracted for all 967 cell lines from the Cancer Cell Line Encyclopedia. For each cell line, we computed the difference between the expression level of each gene and the median expression level in all cell lines. These values were summed across all eight genes, and the cell lines were ranked in order of gene expression from lowest to highest (Supplementary Table 4). Those cell lines included KMS-26 and NCI-H929, and from the other thirty cell lines with the lowest expression level of these genes, readily available lines were chosen.
Identification of cell lines with mutations in mtDNA encoded Complex I subunits
Hybrid capture genome resequencing data of 912 cell lines from the Broad Institute Cancer Cell Line Encyclopedia (data kindly provided by Dr. Levi Garraway (DFCI/Broad)) were mined for spurious mtDNA reads, which were aligned to the Revised Cambridge Reference Sequence. Sufficient data were obtained to reach an average of 5x coverage in 504 cell lines. Cell lines with frameshifting insertions or deletions in Complex I subunits were identified from the data, and the presence of the predicted mutations confirmed by Sanger sequencing using the primers listed below in PCR followed by sequencing reactions. The degree of heteroplasmy was estimated based upon the ratio of the area under the curves of the wild type allele to the mutant allele from Sanger sequence traces. Common variants were identified and filtered out by comparison to a database of such variants (MITOMAP: www.mitomap.org) and by the presence of these variants in >1% of the other cell lines in the CCLE set.
Primers for sequencing of mtDNA encoded Complex I genes:
| ND1: | MT-ND1 F | GGT TTG TTA AGA TGG CAG AGC CC |
| MT-ND1 R | GAT GGG TTC GAT TCT CAT AGT CCT AG | |
| ND2: | MT-ND2 F | TAA GGT CAG CTA AAT AAG CTA TCG GGC |
| MT-ND2 R | CTT AGC TGT TAC AGA AAT TAA GTA TTG CAA C | |
| ND3, ND4L and 5′ end of ND4: | MT-ND3/4 F | TTG ATG AGG GTC TTA CTC TTT TAG TAT AAA T |
| MT-ND3/4 R | GAT AAG TGG CGT TGG CTT GCC AT | |
| 3′ end of ND4: | MT-ND4 F | CCT TTT CCT CCG ACC CCC TAA CA |
| MT-ND4 R | TAG CAG TTC TTG TGA GCT TTC TCG GT | |
| 5′ end of ND5: | MT-ND5 F | AAC ATG GCT TTC TCA ACT TTT AAA GGA TAA C |
| MT-ND5 R | CGT TTG TGT ATG ATA TGT TTG CGG TTT C | |
| ND6 and 3′ end of ND5: | MT-ND 5/6 F | ACT TCA ACC TCC CTC ACC ATT GG |
| MT-ND 5/6 R | TCA TTG GTG TTC TTG TAG TTG AAA TAC AAC |
Cell Proliferation Assays—Cell Counting
Cells were plated in triplicate in 24 well plates at 5-20 thousand cells per well in 2 mL RPMI base media under the conditions described in each experiment (i.e. varying glucose concentration or phenformin treatment). After four days, the entire contents of the well was resuspended and counted (suspension cells) or trypsinized, resuspended and counted (adherent cells) using a Beckman Z2 Coulter Counter with a size selection setting of 8-30 um. The increase in cell number compared to the initially plated sample was calculated and all values were normalized to their control in 10mM glucose unless otherwise indicated.
Cell Proliferation Assays—ATP-Based Measurements
Cells were plated in replicates of five in 96 well plates at 0.5-1 thousand cells per well in 200 uL RPMI base media under the conditions described in each experiment, and a separate group of 5 wells was also plated for each cell line with no treatment for an initial time point. After 5 hours (untreated cells for initial time point) or after 3 days (with varying treatment conditions), 40 uL of Cell Titer Glo reagent (Promega) was added to each well, mixed briefly, and the luminescence read on a Luminometer (Molecular Devices). For wells with treatments causing an increase in luminescence, the fold change in luminescence relative to the initial luminescence was computed and this fold change for each condition was normalized to untreated wells (no effect = 1). For wells with treatments causing a decrease in luminescence, the fold decrease in luminescence relative to the initial luminescence was computed (no viable cells present = -1).
Real Time qPCR
RNA was isolated using the RNeasy Kit (Qiagen) according to the manufacturer’s protocol. RNA was spectrophotometrically quantified and equal amounts were used for cDNA synthesis with the Superscript II RT Kit (Invitrogen). To isolate genomic and mitochondrial DNA we used the Blood and Tissue Kit (Qiagen). qRT-PCR or qPCR analysis of gene expression or copy number was performed on a ABI Real Time PCR System (Applied Biosystems) with the SYBR green Mastermix (Applied Biosystems).
All primers were designed using the Primer3 software and aligned to the human reference genomes using blast to verify their specificity. The primers used for GLUT3 and GLUT1 are as follows GLUT1_F/R: tcgtcggcatcctcatcgcc/ccggttctcctcgttgcggt; GLUT3_F/R: ttgctcttcccctccgctgc/accgtgtgcctgcccttcaa. Results were normalized to RPL0 levels.
Oxygen Consumption
Oxygen consumption of intact or permeabilized cells was measured using an XF24 Extracellular Flux Analyzer (Seahorse Bioscience). For suspension cells, seahorse plates were coated with Cell TAK (BD, 0.02 mg/ml in 0.1 μM NaHO3) for 20 minutes to increase adherence of suspension cells. 250,000 cells then were attached to the plate by centrifugation at 2200 rpm without brakes for 5 min. For adherent cells, 40,000 to 80,000 cells were plated the night before the experiments. RPMI 8226 (US biological #9011) was used as the assay media for all experiments with the indicated glucose concentrations in the presence of 2 mM Glutamine without serum. For spare respiratory capacity measurements, increasing FCCP concentrations (0.1, 0.5 and 2 uM) were used in order to assess maximum OCR of each cell line. For basal oxygen consumption measurements, cell number or protein concentration was used for normalization.
Permeabilized cell measurements were performed as described previously27. Briefly, cells were re-suspended and plated cells (300,000 cells in 500 μl per well) in MAS-1 buffer (70 mM Sucrose, 220 mM Mannitol, 10 mM KH2PO4, 5 mM MgCl2, 2 mM HEPES, 1 mM EGTA, 0.2% FA free BSA, pH 7.2). Saponin (50 μg/ml), methyl pyruvate/malate (10 mM/5 mM) for functional assessment of complex I, Succinate (5mM) /Rotenone (0.5uM) and Antimycin (1uM) for functional assessment of complex II and III, TMPD/Ascorbate (10mM/50mM) for functional assessment of complex IV, and 4 mM ADP was added to permeabilized cells to activate respiration in the mitochondria. We used the complex V inhibitor oligomycin (0.5 μM) to measure oxygen consumption in the absence of oxidative phosphorylation. All compounds were diluted in the assay buffer and injected into the wells sequentially as indicated for each experiment.
Mouse Xenografts
Xenografts were initiated with 2-5 million cells per injection site implanted subcutaneously into the right and left flanks of 5-8 week old male NOD.CB17 Scid/J mice (Jackson Labs). Once tumours were palpable in all animals (>50 mm3 volume by caliper measurements), mice were assigned randomly into biguanide treated or untreated groups and caliper measurements were taken every 3-4 days until tumour burden approached the limits set by institutional guidelines. Tumour volume was assessed according to the formula ½*W*W*L or 4/3*3.14*W/2*L/2*D/2 for large tumors. Phenformin was delivered in drinking water as described previously15 at 1.7 mg/ml concentration with 5 mg/ml sucralose (Splenda), and metformin was delivered by daily IP injection (300 mg/kg). All experiments involving mice were carried out with approval from the Committee for Animal Care at MIT and under supervision of the Department of Comparative Medicine at MIT.
Mitochondrial DNA copy number and mass
For relative mitochondrial mass measurements, 2×10⁵ cells were incubated directly with 50 nM Mitotracker Green FM (Invitrogen M7514) in RPMI for 40 minutes at 37°C. Cells were then centrifuged at 4,000 rpm for 5 minutes at 4°C and the overlying media removed. Cells were kept on ice, washed once with ice-cold PBS, and resuspended in ice-cold PBS with 7-AAD (Invitrogen A1310) for FACS analysis of live cells. The mean Mitotracker Green fluorescence intensity was used as a measure of relative mitochondrial mass.
For copy number, total DNA was isolated using the QIAamp DNA Minikit and real-time PCR was used to estimate relative differences in mtDNA copy number between different cell lines. Alu repeat elements were used as controls. Primers used are:
| ND1_F/R: | CCCTAAAACCCGCCACATCT/ GAGCGATGGTGAGAGCTAAGGT |
| ND2_F/R: | TGTTGGTTATACCCTTCCCGTACTA/ CCTGCAAAGATGGTAGAGTAGATGA |
| Alu_F/R: | CTTGCAGTGAGCCGAGATT/ GAGACGGAGTCTCGCTCTGTC |
Selection of cells in Phenformin
Cal-62 cells were selected at a concentration of phenformin that permitted half-maximal growth compared to the unselected line (approximately 5uM for 2 weeks, 10uM for 1.5 weeks, 15uM for 1.5 weeks, and 20uM for 1 week). Cells were split 1:10 when nearing confluence. After selection, cells were removed from phenformin for at least 3 days before starting proliferation assays. The ratio of wild type to mutant mtDNA was calculated by summing the 11 Sanger Sequencing peak height measurements per nucleotide position for the wild type and mutant allele allowing for the percent mutant calculated. These values were averaged over three nucleotide positions for which the base in the wild type and mutant sequence differs.
Cell competition assay for KMS-26 cells with control and GLUT3 vector
KMS-26 cells with vector control and GLUT3 overexpression were mixed in equal amounts and an initial mixed sample was collected. Mixed cells were then cultured in different glucose concentrations in vitro and additionally injected subcutaneously to NOD-SCID mice. After 2.5 weeks, genomic DNA was isolated from initial sample, cells cultured in different glucose concentrations in vitro, and tumors grown in mice. Using a 5′ common primer targeting the vector (AGTAGACGGCATCGCAGCTTGGATA) and 3′ primers targeting the vector (GGCGGAATTTACGTAGCGGCC) or GLUT3 (GAGCCGATTGTAGCAACTGTGATGG), the abundance of the integrated viruses were determined and the relative abundance of KMS-26 Vector and KMS-26 GLUT3 cells inferred.
Statistics and Animal Model Statements
All experiments reported in Figures 1-4 were repeated at least three times in the laboratory, except Figure 4f and 4g, which were performed once. T-tests were heteroscedastic to allow for unequal variance and distributions assumed to follow a Student’s t distribution, and these assumptions are not contradicted by the data. No samples or animals were excluded from analysis, and sample size estimates were not used. Animals were randomly assigned into a treatment group with the constraint that the starting tumor burden in the treatment and control groups were similar. Studies were not conducted blind.
Supplementary Material
Acknowledgements
We thank Gregory Stephanopoulos for assistance with Nutrostat design, Mitchell Holland for mtDNA sequencing consultation, Levi Garraway for assistance identifying mtDNA mutant cell lines, Takao Yagi for the NDI1 antibody, Tom DiCesare for diagrams, and members of the Sabatini Lab for assistance particularly Anthony Saucedo, Catherine Koch, Omer Yilmaz, Yetis Gultekin and Amanda Hutchins for technical assistance and Dudley Lamming and William Comb for critical reading of the manuscript. This research is supported by fellowships from The Leukemia and Lymphoma Society and The Jane Coffin Childs Fund to K.B., Council of Higher Education Turkey and Karadeniz T. University Scholarships to B.Y. and grants from the David H. Koch Institute for Integrative Cancer Research at MIT, The Alexander and Margaret Stewart Trust Fund, and NIH (K99 CA168940 to R.P. and CA103866, CA129105, and AI07389 to D.M.S.). D.M.S. is an investigator of the Howard Hughes Medical Institute.
Footnotes
Supplementary Information is linked to the online version of the paper at www.nature.com/nature.
Author Contributions K.B., R.P. and D.M.S. conceived the project and designed the experiments. K.B. and R.P. designed and engineered the Nutrostat and performed the screening, knockdown, cell proliferation, extracellular flux, glucose consumption, and tumour formation experiments and processed and analyzed sequencing and expression data. F.L., E.C.B., B.Y., and W.W.C. assisted with experiments. C.B.C. performed the metabolite profiling experiments. T.W. provided bioinformatic support for shRNA abundance deconvolution, P.T assisted in identifying mtDNA mutations. K.B., R.L.P and D.M.S. wrote and all authors edited the manuscript.
Author Information Reprints and permissions information is available at www.nature.com/reprints. The authors declare competing financial interests: details accompany the full-text HTML version of the paper at www.nature.com/nature. Correspondence and requests for materials should be addressed to D.M.S. (sabatini@wi.mit.edu).
References
- 1.Hirayama A, et al. Quantitative metabolome profiling of colon and stomach cancer microenvironment by capillary electrophoresis time-of-flight mass spectrometry. Cancer Res. 2009;69:4918–4925. doi: 10.1158/0008-5472.CAN-08-4806. [DOI] [PubMed] [Google Scholar]
- 2.Gullino PM, Grantham FH, Courtney AH. Glucose consumption by transplanted tumors in vivo. Cancer Res. 1967;27:1031–1040. [PubMed] [Google Scholar]
- 3.Owen MR, Doran E, Halestrap AP. Evidence that metformin exerts its anti-diabetic effects through inhibition of complex 1 of the mitochondrial respiratory chain. Biochem J. 2000;348(Pt 3):607–614. [PMC free article] [PubMed] [Google Scholar]
- 4.El-Mir MY, et al. Dimethylbiguanide inhibits cell respiration via an indirect effect targeted on the respiratory chain complex I. J Biol Chem. 2000;275:223–228. doi: 10.1074/jbc.275.1.223. [DOI] [PubMed] [Google Scholar]
- 5.Seo BB, Matsuno-Yagi A, Yagi T. Modulation of oxidative phosphorylation of human kidney 293 cells by transfection with the internal rotenone-insensitive NADH-quinone oxidoreductase (NDI1) gene of Saccharomyces cerevisiae. Biochim Biophys Acta. 1999;1412:56–65. doi: 10.1016/s0005-2728(99)00051-1. [DOI] [PubMed] [Google Scholar]
- 6.Cairns RA, Harris IS, Mak TW. Regulation of cancer cell metabolism. Nat Rev Cancer. 2011;11:85–95. doi: 10.1038/nrc2981. [DOI] [PubMed] [Google Scholar]
- 7.Urasaki Y, Heath L, Xu CW. Coupling of glucose deprivation with impaired histone H2B monoubiquitination in tumors. PLoS One. 2012;7:e36775. doi: 10.1371/journal.pone.0036775. [DOI] [PMC free article] [PubMed] [Google Scholar]
- 8.Luo B, et al. Highly parallel identification of essential genes in cancer cells. Proc Natl Acad Sci U S A. 2008;105:20380–20385. doi: 10.1073/pnas.0810485105. [DOI] [PMC free article] [PubMed] [Google Scholar]
- 9.Tasseva G, et al. Phosphatidylethanolamine deficiency in Mammalian mitochondria impairs oxidative phosphorylation and alters mitochondrial morphology. J Biol Chem. 2013;288:4158–4173. doi: 10.1074/jbc.M112.434183. [DOI] [PMC free article] [PubMed] [Google Scholar]
- 10.Haack TB, et al. Exome sequencing identifies ACAD9 mutations as a cause of complex I deficiency. Nat Genet. 2010;42:1131–1134. doi: 10.1038/ng.706. [DOI] [PubMed] [Google Scholar]
- 11.Crabtree HG. Observations on the carbohydrate metabolism of tumours. Biochem J. 1929;23:536–545. doi: 10.1042/bj0230536. [DOI] [PMC free article] [PubMed] [Google Scholar]
- 12.Barretina J, et al. The Cancer Cell Line Encyclopedia enables predictive modelling of anticancer drug sensitivity. Nature. 2012;483:603–607. doi: 10.1038/nature11003. [DOI] [PMC free article] [PubMed] [Google Scholar]
- 13.Jones JB, et al. Detection of mitochondrial DNA mutations in pancreatic cancer offers a “mass”-ive advantage over detection of nuclear DNA mutations. Cancer Res. 2001;61:1299–1304. [PubMed] [Google Scholar]
- 14.Santidrian AF, et al. Mitochondrial complex I activity and NAD+/NADH balance regulate breast cancer progression. J Clin Invest. 2013;123:1068–1081. doi: 10.1172/JCI64264. [DOI] [PMC free article] [PubMed] [Google Scholar]
- 15.Shackelford DB, et al. LKB1 inactivation dictates therapeutic response of non-small cell lung cancer to the metabolism drug phenformin. Cancer Cell. 2013;23:143–158. doi: 10.1016/j.ccr.2012.12.008. [DOI] [PMC free article] [PubMed] [Google Scholar]
- 16.Larman TC, et al. Spectrum of somatic mitochondrial mutations in five cancers. Proc Natl Acad Sci U S A. 2012;109:14087–14091. doi: 10.1073/pnas.1211502109. [DOI] [PMC free article] [PubMed] [Google Scholar]
- 17.Evans JM, Donnelly LA, Emslie-Smith AM, Alessi DR, Morris AD. Metformin and reduced risk of cancer in diabetic patients. BMJ. 2005;330:1304–1305. doi: 10.1136/bmj.38415.708634.F7. [DOI] [PMC free article] [PubMed] [Google Scholar]
- 18.Decensi A, et al. Metformin and cancer risk in diabetic patients: a systematic review and meta-analysis. Cancer Prev Res (Phila) 2010;3:1451–1461. doi: 10.1158/1940-6207.CAPR-10-0157. [DOI] [PubMed] [Google Scholar]
- 19.Birsoy K, Sabatini DM, Possemato R. Untuning the tumor metabolic machine: Targeting cancer metabolism: a bedside lesson. Nat Med. 2012;18:1022–1023. doi: 10.1038/nm.2870. [DOI] [PubMed] [Google Scholar]
- 20.Pollak M. Metformin and pancreatic cancer: a clue requiring investigation. Clin Cancer Res. 2012;18:2723–2725. doi: 10.1158/1078-0432.CCR-12-0694. [DOI] [PubMed] [Google Scholar]
- 21.Hall A, et al. Dysfunctional oxidative phosphorylation makes malignant melanoma cells addicted to glycolysis driven by the (V600E)BRAF oncogene. Oncotarget. 2013;4:584–599. doi: 10.18632/oncotarget.965. [DOI] [PMC free article] [PubMed] [Google Scholar]
- 22.Ben Sahra I, Tanti JF, Bost F. The combination of metformin and 2 deoxyglucose inhibits autophagy and induces AMPK-dependent apoptosis in prostate cancer cells. Autophagy. 2010;6 doi: 10.4161/auto.6.5.12434. [DOI] [PubMed] [Google Scholar]
- 23.Javeshghani S, et al. Carbon source and myc expression influence the antiproliferative actions of metformin. Cancer Res. 2012;72:6257–6267. doi: 10.1158/0008-5472.CAN-12-2907. [DOI] [PubMed] [Google Scholar]
- 24.Jain M, et al. Metabolite profiling identifies a key role for glycine in rapid cancer cell proliferation. Science. 2012;336:1040–1044. doi: 10.1126/science.1218595. [DOI] [PMC free article] [PubMed] [Google Scholar]
- 25.Possemato R, et al. Functional genomics reveal that the serine synthesis pathway is essential in breast cancer. Nature. 2011;476:346–350. doi: 10.1038/nature10350. [DOI] [PMC free article] [PubMed] [Google Scholar]
- 26.Birsoy K, et al. MCT1-mediated transport of a toxic molecule is an effective strategy for targeting glycolytic tumors. Nat Genet. 2013;45:104–108. doi: 10.1038/ng.2471. [DOI] [PMC free article] [PubMed] [Google Scholar]
- 27.Clerc P, Polster BM. Investigation of mitochondrial dysfunction by sequential microplate-based respiration measurements from intact and permeabilized neurons. PLoS One. 2012;7:e34465. doi: 10.1371/journal.pone.0034465. [DOI] [PMC free article] [PubMed] [Google Scholar]
Associated Data
This section collects any data citations, data availability statements, or supplementary materials included in this article.


