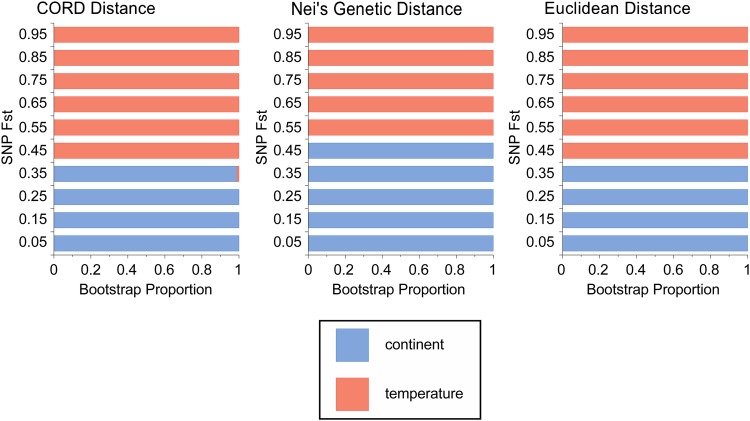
Figure 4.
Results for cluster analysis of SNP frequencies. Shown are the proportions of bootstrap replicates that cluster our four sampled populations by either continent (blue) or temperature (red) broken down by the level (percentile) of F st in the Australian cline. These results support convergent evolution of allele frequencies such that more highly differentiated sites cluster populations together on the basis of the environment in which they live rather than geography.

