

Abstract
Three-dimensional (3D) culture of hepatocytes leads to improved and prolonged synthetic and metabolic functions, but the underlying molecular mechanisms are unknown. In order to investigate the role of 3D cell-cell interactions in maintaining hepatocyte differentiated functions ex vivo, primary mouse hepatocytes were cultured either as monolayers on tissue culture dishes (TCD) or as 3D aggregates in rotating wall vessel (RWV) bioreactors. Global gene expression analyses revealed that genes upregulated in 3D culture were distinct from those upregulated during liver development and liver regeneration. Instead, they represented a diverse array of hepatocyte-specific functional genes with significant over-representation of hepatocyte nuclear factor 4α (Hnf4a) binding sites in their promoters. Expression of Hnf4a and many of its downstream target genes were significantly increased in RWV cultures as compared to TCD. Conversely, there was concomitant suppression of mesenchymal and cytoskeletal genes in RWV cultures that were induced in TCDs. These findings illustrate the importance of 3D cell-cell interactions in maintaining fundamental molecular pathways of hepatocyte function and serve as a basis for rational design of biomaterials that aim to optimize hepatocyte functions ex vivo for biomedical applications.
Keywords: three-dimensional cell culture, bioreactor, hepatocyte, microarray, gene expression, spheroid
1. Introduction
Three-dimensional (3D) cell culture is critical for understanding the function of cells in a physiologically relevant context and for tissue engineering complex solid organs like the liver [1]. 3D culture of hepatocytes has been shown to maintain the differentiated functions of hepatic cell lines [2] and primary cells [3, 4] as well as promote differentiation of stem cells toward the hepatic lineage [5–8]. Sustained differentiated functions of hepatocytes in 3D culture could be harnessed for drug toxicity screening [9, 10] or to improve the efficacy of extracorporeal liver-assist devices [11]. In addition, 3D aggregation may facilitate transplantation of hepatocytes kept in culture, which would be particularly useful for hepatocytes derived from pluripotent stem cells [12, 13].
While differentiated functions are improved in hepatocytes cultured either on 3D scaffolds [14–17] or as self-aggregated 3D spheroids [2–4], little is known about the underlying molecular mechanisms that lead to those improved functions in 3D culture. Using the rotating wall vessel (RWV) system, we previously showed that one important factor for sustaining differentiated functions of a human hepatocellular carcinoma cell line is sustained 3D cell-cell interactions [2]. RWVs are rotational bioreactors with a gas permeable membrane that, when in operation, are completely filled with culture media so that it functionally rotates as a solid-body around a horizontal axis. This creates a suspension culture environment with minimal fluid shear stress and turbulence, allowing cells to co-localize and self-aggregate with 3D spatial freedom [18]. Studies have shown that hepatocyte spheroids cultured under these conditions could develop into larger sizes with less hypoxic limitations to the inner core compared to stationary culture [19]. Human hepatocytes and non-parenchymal cells co-cultured within RWVs demonstrated formation of complex 3D micro-architectures, including microvilli, bile canaliculi, and sinusoidal fenestrations [20, 21].
Importantly, as tissue engineering strategies advance and the definitions of biomaterials evolve, self-aggregated hepatocyte spheroids developed within bioreactors may be considered biomaterials in their own right [22]. Self-aggregated cellular spheroids are the building blocks for organ printing, a bottom up synthesis approach to tissue engineering [23]. Therefore, understanding the molecular mechanisms that regulate hepatocyte functions within 3D spheroids is critical for the optimization of organ function within a printed liver. Moreover, hepatocyte spheroids generated within RWVs allow investigation of the biological effects of 3D cell-cell interactions without the influence of contacting scaffolds, surfaces, or carriers. In this study, we performed global gene expression and promoter region analyses on primary mouse hepatocytes cultured on collagen-coated tissue culture dishes (TCDs) or RWVs to determine the underlying molecular mechanisms important for maintaining hepatocyte-specific functions in 3D culture.
2. Material and Methods
2.1. Mice
Primary hepatocytes were isolated from male C57BL/6 mice (Jackson Laboratory, Bar Harbor, ME). All mice were handled in accordance with the “Guide for the Care and Use of Laboratory Animals” and approved by the Institutional Animal Care and Use Committee.
2.2. Hepatocyte Isolation and Culture
Mouse primary hepatocytes were isolated by the two-step perfusion technique using Liver Perfusion and Liver Digest Media (Life Technologies, Pleasanton, CA), followed by separation using a 50% Percoll (GE Healthcare Life Sciences, Pittsburgh, PA) density gradient. Purity of live hepatocytes was routinely ≥90%. Hepatocytes were cultured in 5% fetal calf serum (Hyclone, Logan, UT) in DMEM supplemented with L-glutamine, antibiotics, insulin-transferrin-selenium, and HEPES (Mediatech, Manassas, VA) and placed either in 6cm collagen-coated TCDs (BD Biosciences, San Jose, CA) or 10ml RWVs that were high-aspect-ratio-vessels (HARVs) with a diameter of 6cm (Synthecon, Houston, TX). RWV cultures were rotated at 16 rpm to maintain aggregates in suspension. Cells were cultured in 10mls of media at a cell density of 1×10⁵ cells/ml for both TCDs and RWVs.
2.3. Light Microscopy
Phase contrast photos were taken with a Rebel T3i (Canon, San Jose, CA) adapted to the photoport of the Eclipse TS100 Inverted Microscope (Nikon, Melville, NY). Cell sizes were measured with a stage micrometer.
2.4. Albumin ELISA Assay
Cell culture supernatants were collected and albumin concentration was determined by a mouse albumin ELISA kit per the manufacturer’s instructions (Bethyl, Montgomery, TX).
2.5. Assay for Cytochrome P450 1a1 Activity
EROD (7-ethoxyresorufin-o-dealkylase) assays were performed as previously described [24]. 8μM of 7-ethoxyresorufin (Life Technologies) and 10μM of dicumarol (Sigma) were added to TCD or RWV cultures and incubated for 1 hour in the dark. Culture supernatants were then reacted with 15 Fishman units of β-gluconidase and 120 Roy units of arylsulfatase (Roche, Indianapolis, IN) at 37°C for 2 hours. Conversion of 7-ethoxyresorfin to resorufin was used to quantify CYP1A1 activity by determining the fluorescence optical density at 544nm/590nm (absorption/emission) measured against a standard curve of known amounts of resorufin (Life Technologies).
2.6. Cyquant Assay
Cells from TCD and RWV cultures were harvested, frozen, and lysed. DNA content was quantified using the Cyquant Assay following the manufacturer’s instructions (Life Technologies). Cell numbers were determined by using a standard curve generated by known numbers of isolated primary mouse hepatocytes.
2.7. Microarray Sample Preparation and Analysis
RNA was isolated using RNeasy Mini kit (QIAGEN, Valencia, CA) according to the manufacturer’s protocol. Initial RNA integrity was verified by the Agilent 2100 Bioanalyzer (Santa Clara, CA). For microarray hybridization, RNA was amplified and biotinylated using the MessageAmp II-Biotin Enhanced Kit per the manufacturer’s instructions (Ambion, Austin, TX). 10μg of biotinylated amplified RNA was hybridized on to the Mouse Genome 430 2.0 Array (Affymetrix, Santa Clara, CA) through the UCSF Gladstone Institute Genomics Core (San Francisco, CA). Global gene expression analysis was carried out with GeneSpring GX v. 12.0 software (Agilent) using the GC-RMA summarization algorithm. The expression threshold for analysis was set to raw data greater than the 20th percentile in at least 2 of the 15 samples. Genes with significant differential expression between any 2 of the 5 conditions were identified by one-way analysis of variance (ANOVA) with Benjamini-Hochberg false discovery rate multiple testing correction (p-value <0.01) post-hoc Tukey analysis. Complete MIAME (Minimum Information About a Microarray Experiment) –compliant microarray data will be submitted to the Gene Expression Omnibus.
2.8. Promoter Region Analysis
The oPOSSOM Web-based program (http://www.cisreg.ca) was used to identify over-representation of transcription factor binding sites (TFBSs) in genes upregulated in RWV culture. oPOSSOM is a validated algorithm that identifies statistically over-represented TFBSs, as defined by the JASPAR database, within a set of co-regulated genes that are compared with a database of background genes that have conserved non-coding regions derived from phylogenetic footprinting and enriched for functional TFBSs. The search for TFBS was limited to within 5000 nucleotides upstream or downstream of the transcription start site. The TFBS rate was calculated as the number of times the TFBS was predicted, multiplied by the width of the TFBS profile, and divided by the total number of nucleotides in the conserved non-coding regions of the gene set. The two calculated statistical scores when used in combination (Z-score >10 and Fisher score <0.01) correctly identified the regulating transcription factor in reference gene sets and resulted in a false-positive rate of 15% in random gene sets [25].
2.9. Quantitative Real-time Reverse Transcription Polymerase Chain Reaction (qRT-PCR)
Reverse transcription was carried out with 300ng of RNA using the High-Capacity cDNA Reverse Transciption Kit (Applied Biosystems, Foster City, CA) per the manufacturer’s instructions. One μl of the resulting cDNA was added to a final 20μl mixture containing 10μl of 2x SYBR Green PCR Master Mix (Applied Biosystems) and 12 pmol oligonucleotide primers. PCRs were carried out in a 7300 Real-Time PCR System (Applied Biosystems). The thermal profile was 50°C for 2min, 95°C for 10min, followed by 40 amplification cycles consisting of 95°C for 15s, 63°C for 30s, and 72°C for 30s. Samples were normalized to rRNA 18S internal standard. Relative quantification of gene expression was calculated by using the 2ΔΔCt equation.
2.10. Primers
Sequences for primers used in qRT-PCR are listed below (Table 1). For primer sequences obtained from the Harvard Primer Bank (http://pga.mgh.harvard.edu/primerbank/citation.html), the PrimerBank IDs are also provided [26].
Table 1.
Primers used in qRT-PCR.
| Gene Name | Direction | Sequence 5′->3′ | Harvard PrimerBank ID |
|---|---|---|---|
| Baat | Forward | GTCCTCCCTTGGATAGCCTGA | 211904119b2 |
| Reverse | CCGGATGCGGCTTTCCTTTA | ||
| Akr1c19 | Forward | TTGGATCTCAACGACCTAAGCG | 282398140b1 |
| Reverse | GAAGGGCAATCTGAGCTGGA | ||
| Gys2 | Forward | CGCTCCTTGTCGGTGACATC | 188035874b1 |
| Reverse | CATCGGCTGTCGTTTTGGC | ||
| F7 | Forward | AGACTTTGAGGGTCGGAACTG | 225543549b3 |
| Reverse | TTGGTCCCTACATGGTCCCTG | ||
| Hfe2 | Forward | ATGGGCCAGTCCCCTAGTC | 166295197b1 |
| Reverse | CAGCGGAGGATCTTGCACT | ||
| Lepr | Forward | GTCTTCGGGGTTGTGAATGTC | 8567370a1 |
| Reverse | ACCTAAGGGTGGATCGGGTTT | ||
| Hnf4a | Forward | GGTTTAGCCGACAATGTGTGG | 46575915b3 |
| Reverse | TCCCGCTCATTTTGGACAGC | ||
| Foxa2 | Forward | TCCGACTGGAGCAGCTACTAC | 153945803b1 |
| Reverse | GCGCCCACATAGGATGACA | ||
| Cebpa | Forward | GCGTCCCAAACAGGTGACA | 20988828a2 |
| Reverse | GCCAGCATAAGGTAATCTTGCTT | ||
| Snai1 | Forward | CACACGCTGCCTTGTGTCT | 53250a1 |
| Reverse | GGTCAGCAAAAGCACGGTT | ||
| Vim | Forward | GCTGCGAGAGAAATTGCAGGA | 227430362c3 |
| Reverse | CCACTTTCCGTTCAAGGTCAAG | ||
| Loxl2 | Forward | CAGAGAAGACCTACAACCCCA | 225579027b3 |
| Reverse | TCCGCGAGGCAAAGGTTTT | ||
| Flna | Forward | GTGGACAATGCTGATGGTACTC | 2852331a1 |
| Reverse | CTGGCCTTCACCTTACTGGC | ||
| Acta1 | Forward | TACCACCGGCATCGTGTTG | 133893192b2 |
| Reverse | GCGCACAATCTCACGTTCAG | ||
| Tpm2 | Forward | GAGAGTAAATGTGGGGACCTAGA | 133892876b3 |
| Reverse | TTGGTGGAATACTTGTCCGCT | ||
| 18S | Forward | GTGGAGCGATTTGTCTGGTT | |
| Reverse | CGCTGAGCCAGTCAGTGTAG |
2.11. Statistical Analysis
Two-tailed t-tests were carried out using InStat 3.0 software. Significance was considered when p ≤ 0.05. Data are shown as mean ± standard error (SE) unless otherwise indicated. Statistical analyses for microarray data, including one-way ANOVA, principal components analysis, and hierarchical clustering analysis, were carried out using GeneSpring GX v. 12.0 software.
3. Results
3.1. Morphology and function of primary mouse hepatocytes cultured within RWVs and on TCDs
Primary mouse hepatocytes cultured within RWVs self-organized into 3D aggregates that were 100–200 μm in their longest cross-sectional length by 24 hours of culture (Figure 1A). After 3 days in RWVs, hepatocyte cell shape remained round in densely-packed aggregates ranging from 200–300 μm in size. In contrast, hepatocytes on TCDs formed a monolayer of characteristic bi-nucleated cells within 24 hours of culture (Figure 1A). After 3 days in TCDs, cultured cells acquired irregular and pleomorphic shapes with elongated spindle-like projections.
Figure 1.

Hepatocyte 3D aggregates generated in rotating wall vessels (RWVs) demonstrated improved hepatocyte-specific functions compared to monolayers in tissue culture dishes (TCDs). (A) Primary mouse hepatocytes were cultured in either TCDs or RWVs and phase-contrast photomicrographs were taken at 24h and day 3 of culture. Scale bar = 100μm. Total magnification 40x. (B) Albumin production was significantly increased in RWVs at 36h and day 3 of culture compared to TCDs. (C) Likewise, cytochrome P450 1a1 activity was significantly increased in RWVs at 4h, 24h, and day 3 of culture compared to TCDs. Data are representative of 3 independent experiments. *p<0.001. Error bars indicate standard deviation.
Along with these morphological differences, hepatocytes cultured as 3D aggregates demonstrated significantly improved synthetic and metabolic functions as compared to hepatocytes in monolayers, at both early and late time-points. Albumin secretion was 2.5-fold more per cell at 36 hours and 3.5-fold more per cell at day 3 in RWV cultures compared to TCDs (Figure 1B). Cytochrome P450 1a1 (CYP1A1) activity was 3-fold higher per cell in RWVs as compared to TCDs in as early as 4 hours of culture, and improved function was maintained at 24 hours (3-fold) and day 3 (2.2-fold) (Figure 1C). These findings indicate that primary hepatocytes cultured in RWVs self-aggregated to form 3D spheroids with enhanced synthetic and metabolic functions compared hepatocytes cultured as monolayers.
Improved hepatocyte-specific functions in RWV culture were not associated with increased proliferation of these cells. After 3 days, cell numbers were slightly increased in TCDs compared to RWVs, but not to a statistically significant extent (Figure 2A). Moreover, expression of proliferating cell nuclear antigen (Pcna) was higher in TCDs than in RWVs at 36 hours of culture (Figure 2B), suggesting that proliferative capacity of cultured primary hepatocytes may be higher in TCDs.
Figure 2.
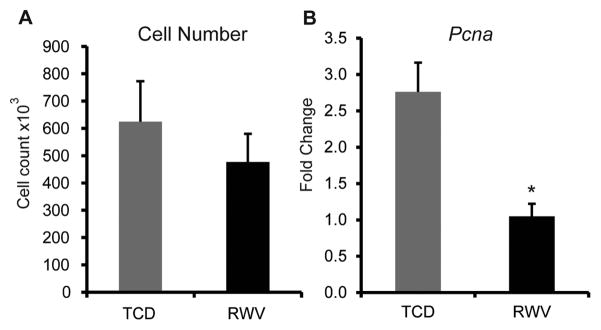
Primary hepatocytes cultured on TCDs have a slight growth advantage compared to those cultured in RWVs. (A) Cell numbers were enumerated by the Cyquant assay on day 3 of culture. The slight increases in cell numbers in TCD cultures compared to RWV were not statistically significant. Data are representative of 3 independent experiments. Error bars indicate standard deviation. (B) Expression of Pcna (proliferating cell nuclear antigen) in hepatocytes cultured on TCDs was significantly higher than in those cultured in RWV. Data are the average of 5 independent experiments. *p<0.005. Error bars represent standard error.
3.2. Global gene expression profiles of hepatocytes cultured as 3D aggregates or as monolayers
To investigate the molecular mechanisms underlying improved hepatocyte functions in 3D aggregates, we analyzed the global gene expression of hepatocytes cultured as monolayers on TCDs and 3D aggregates in RWVs at 4 hours and 24 hours using microarrays. These early time-points were chosen to determine the initial gene expression profile of hepatocytes in TCD and RWV cultures. For each of the 5 conditions (freshly isolated hepatocytes, 4h TCD, 4h RWV, 24h TCD, and 24h RWV) we analyzed 3 independent biological samples from separate experiments to ensure experimental reproducibility and increase confidence in the microarray analysis.
One-way ANOVA (with p < 0.01) generated a list of 16,893 genes that were significantly differentially expressed among the 5 experimental conditions. Principal component analysis demonstrated that experimental triplicates clustered together within each condition and separately from the other groups, indicating good reproducibility of the global gene expression patterns within each condition (Figure 3A). The 4h TCD samples clustered separately from the 4h RWV samples, showing that these culture conditions led to differential gene expression in as early as 4h of culture. The variance between TCD and RWV samples increased at 24h reflecting increased differences in gene expression.
Figure 3.

Microarray analysis of global gene expression in hepatocytes cultured in monolayers compared to 3D aggregates. (A) Principal component analysis of significant differentially expressed genes in freshly isolated hepatocytes (grey diamonds) and hepatocyte culture for 4h (squares) or 24h (circles) in TCD (red) and RWV (blue). Each symbol represents an independent sample from 3 independent experiments. (B) Hierarchical clustering of genes with 2-fold or greater expression difference between TCD and RWV culture conditions at either 4h or 24h. Each column represents the average expression values of 3 independent experiments. (C) Venn diagram that compares genes significantly upregulated by 2-fold or more in hepatocyte 3D aggregates compared to monolayers with genes significantly upregulated during liver development and liver regeneration. Numbers represent the number of genes either distinct in or shared by the 3 processes.
Analysis was then focused on genes with significant differential expression between TCD and RWV by at least 2-fold at either time-point. The complete lists of genes upregulated in RWV or TCD cultures at 4 or 24 hours are detailed in Supplemental Tables 1–4. The resulting combined list of 822 differentially expressed genes was analyzed by hierarchical clustering on both gene expression and experimental condition (Figure 3B). Each condition was compared to freshly isolated hepatocytes as the baseline. Hierarchical clustering on experimental conditions revealed that hepatocytes cultured in RWVs for 24 hours still had a gene expression profile similar enough to freshly isolated hepatocytes to be linked under one main branch of the hierarchical dendrogram. In contrast, the gene expression profile of hepatocytes cultured for 24h in TCDs was significantly different from freshly isolated and 24h RWV hepatocytes that it grouped separately under its own branch of the hierarchical dendrogram. This analysis suggests that RWV culture preserved molecular features in hepatocytes that more closely resembled freshly isolated hepatocytes, whereas TCD culture induced molecular programs that drove hepatocytes further from their initial phenotype.
3.3. Gene expression profile of 3D aggregate cultures compared to liver development and liver regeneration
One hypothesis for the improved functional capacity of hepatocytes cultured in RWVs as compared to TCDs is that formation of 3D cellular interactions recapitulated in vivo-like molecular pathways. To test this hypothesis, we compared the genes significantly upregulated in RWV with genes differentially regulated during liver development and liver regeneration. Raw microarray datasets (accession number: GSE6998) of the developing mouse liver and the regenerating mouse liver after two-thirds hepatectomy were downloaded from the Gene Expression Omnibus (GEO) and re-analyzed using the GC-RMA summarization algorithm [27]. Because the same microarray platform was used to generate the curated datasets, re-analyzed data could be directly compared to the microarray data generated in this study.
Genes significantly upregulated at any time-point during liver development were identified by one-way ANOVA (p < 0.01) and filtered for genes expressed 2-fold or higher compared to unmanipulated adult mouse liver. Similarly, significantly upregulated genes in liver regeneration at any time-point after hepatectomy were identified using the same criteria. Finally, genes significantly upregulated by 2-fold or more in RWV as compared to TCD at either 4 or 24 hours of culture were identified. Differentially upregulated genes from these 3 processes were compared to determine whether they shared significant numbers of genes (Figure 3C). Most of the upregulated genes in these biological processes were uniquely upregulated in each process: 93% (4460 genes) of the upregulated genes in liver development, 73% (353 genes) in 3D aggregate/monolayer culture, and 52% (300 genes) in regeneration. Only 5 genes were shared by all 3 processes. These analyses reveal that 3D aggregate culture triggers different molecular pathways from liver development or regeneration to maintain hepatocyte-specific functions.
3.4. Characterization of differential gene expression between 3D aggregate and monolayer cultures
Gene Ontogeny (GO) analysis was performed to classify the 293 genes significantly upregulated by ≥2-fold in hepatocytes cultured in RWV compared to TCD at 24 hours. The most significant GO Biological Process terms encompassed characteristic hepatocyte functions such as lipid metabolism, amino acid metabolism, amino acid biosynthesis, oxidation-reduction, response to glucose stimulus, and response to xenobiotic stimulus (Table 2).
Table 2.
Gene ontology analysis of significantly upregulated biological process terms in 3D aggregates as compared to monolayers at 24h of culture.
| GO Term | Number of Genes | P-value |
|---|---|---|
| Lipid metabolic process | 44 | < 0.0001 |
| Organic acid metabolic process | 41 | < 0.0001 |
| Amino acid metabolic process | 19 | <0.01 |
| Organic acid biosynthetic process | 23 | < 0.0001 |
| Amino acid biosynthetic process | 12 | < 0.001 |
| Oxidation-reduction process | 35 | < 0.05 |
| Response to glucose stimulus | 9 | < 0.05 |
| Response to xenobiotic stimulus | 6 | < 0.05 |
For some genes whose expression is correlated with mature hepatocyte function, microarray results were validated by qRT-PCR (Figure 4). Bile acid co-enzyme A (Baat), which catalyzes the conjugation of bile acids to amino acids before excretion into bile canaliculi [28], was upregulated 23.3±2.5 fold in 3D aggregates compared to monolayers. Akr1c19, a member of the aldo-keto reductase superfamily, which catalyzes conversion of aldehydes and ketones to their corresponding alcohols [29], was upregulated 9.4±1.3 fold. The liver-specific isoform of glycogen synthase (Gys2), which catalyzes the rate-limiting step of glycogen synthesis [30], was upregulated by 6.6±1.1 fold. Expression of factor VII (F7), a coagulation factor in the extrinsic pathway and important indicator of liver synthetic function [31], was 2.9±0.6 fold higher in RWV-cultured hepatocytes than in TCDs. Expression of Hfe2, which encodes the protein hemojuvelin involved in iron metabolism, was increased 11.4±1.7 fold in RWV compared to TCD cultures. Lastly, leptin receptor (Lepr), important in the regulation of lipid metabolism, was expressed 19.8±5.9 fold higher in RWV-cultured hepatocytes. Together, these data indicate that the most significant difference between TCD- and RWV-cultured hepatocytes is that diverse metabolic functions characteristic of hepatocytes were maintained at higher levels in 3D aggregates than in monolayers.
Figure 4.

Metabolic and synthetic genes were upregulated in hepatocytes cultured as 3D aggregates in RWVs compared to monolayers in TCDs. Quantitative reverse transcription polymerase chain reactions (qRT-PCR) demonstrated that expression levels of bile acid co-enzyme A (Baat), aldo-ketoreductase 1c19 (Akr1c19), glycogen synthase 2 (Gys2), factor VII (F7), hemochromatosis type 2 (Hfe2), and leptin receptor (Lepr) were significantly upregulated in RWV compared to TCD. Data are the average of 6 independent experiments. *p<0.005, **p<0.0001. Error bars indicate standard error.
3.5. Promoter region analysis of genes upregulated in RWVs compared to TCDs
To identify a unifying mechanism that may explain the improved expression of a diverse array of hepatocyte-specific genes in 3D aggregate culture, promoter region analysis was performed on the 293 genes upregulated in RWV at 24 hours to find over-represented transcription factor binding sites (TFBSs). Of the 293 genes, 261 were in the oPOSSUM database (http://www.cisreg.ca) and included in the analysis. Table 3 lists the top 10 over-represented TFBSs in genes significantly upregulated in RWV-cultured hepatocytes compared with a background gene set. TFBSs with a Z-score > 10 and Fisher score < 0.01 were empirically validated to identify functionally relevant transcription factors within a set of co-expressed genes [25]. Using these criteria, only the top 2 transcription factors, HNF4α (Hnf4a) and chicken ovalbumin upstream promoter transcription factor 1 (TFCOUP1), were identified as functionally important regulators of the genes upregulated in RWV-cultured hepatocytes. Remarkably, 52% of the analyzed genes (138 genes) contained Hnf4a TFBSs in their promoter regions. Hnf4a is known as a master regulator of hepatocyte-specific functions [32]. Interestingly, TFCOUP1 and Hnf4a binding motifs are highly related and TFCOUP1 has been shown to act as a negative regulator of Hnf4a transactivation [33]. These analyses suggest that Hnf4a is particularly important for maintaining hepatocyte-specific functions in RWV-cultured hepatocytes.
Table 3.
Over-represented transcription factor binding sites (TFBSs) in the promoter regions of genes upregulated in RWV culture.
| Transcription Factor | Transcription Factor Class | # of Positive Genes in RWV Set | % of Positive Genes in RWV Set | TFBS Rate in Background Set (%) | TFBS Rate in RWV Set (%) | Z-score | Fisher score |
|---|---|---|---|---|---|---|---|
| HNF4α | Nuclear Receptor | 138 | 52.9 | 0.54 | 0.76 | 21.9 | 7.76×10⁻⁸ |
| COUPTF1 | Nuclear Receptor | 88 | 33.7 | 0.28 | 0.38 | 13.7 | 2.00×10⁻⁵ |
| HNF1α | Homeobox | 67 | 25.7 | 0.22 | 0.29 | 9.9 | 2.32×10⁻⁴ |
| NKX2-5 | Homeobox | 222 | 85.1 | 3.70 | 3.92 | 8.5 | 0.057 |
| C/EBPα | bZIP | 162 | 62.1 | 1.24 | 1.36 | 7.9 | 0.012 |
| PBX1 | Homeobox | 60 | 23.0 | 0.19 | 0.23 | 7.8 | 0.007 |
| PAX4 | Paired-homeobox | 6 | 2.3 | 0.02 | 0.04 | 7.6 | 0.097 |
| PRRX2 | Homeobox | 225 | 86.2 | 2.29 | 2.43 | 6.8 | 1.29×10⁻⁴ |
| FOXQ1 | Forkhead | 117 | 44.8 | 0.60 | 0.68 | 6.8 | 0.009 |
| TLX1-NFIC | Homeobox/CAAT | 22 | 8.4 | 0.05 | 0.07 | 6.1 | 0.026 |
To further clarify the role of Hnf4a in 3D hepatocyte culture, expression of Hnf4a and other liver-enriched transcription factors was determined at 24h of culture. Expression of Hnf4a was significantly increased by 3.4±0.5 fold in RWV-cultured hepatocytes compared to TCD (Figure 5), whereas expression of Cebpa and Foxa2 did not differ significantly between culture types. CCAAT/enchancer-binding protein α (Cebpa) is a liver-enriched transcription factor known to regulate expression of numerous genes that support liver-specific functions [34]. Forkhead box A2 (Foxa2) is a transcription factor critical for liver development [35], but dispensable for maintenance of mature hepatocyte functions [36]. Our findings suggest that Hnf4a is the principle promoter of hepatocyte-specific functions in 3D culture.
Figure 5.
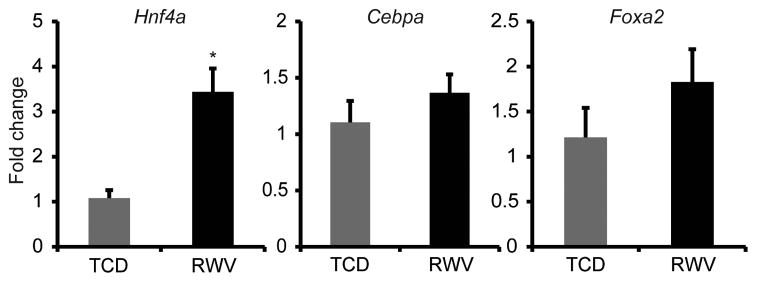
Expression of Hnf4a was significantly increased in 3D aggregates in RWVs compared to monolayers in TCDs, as determined by qRT-PCR. Expression levels of Cebpa and Foxa2, two other liver-enriched transcription factors, were not significantly different between the two culture conditions. Data are the average of 6 independent experiments. *p<0.001. Error bars indicate standard error.
3.6. Characterization of mesenchymal and cytoskeletal gene expression in monolayer cultures compared to 3D aggregate cultures
In addition to being a direct transcriptional activator of many hepatocyte-specific functional genes, Hnf4a has also been shown to maintain hepatocyte differentiation by repressing expression of mesenchymal genes, including Snail (Snai1), a key inducer of epithelial-mesenchymal transition (EMT) [37]. In order to determine whether mesenchymal molecular pathways may be concomitantly suppressed in hepatocyte 3D aggregates, we measured expression of several important markers of EMT at 24h of culture in TCDs and RWVs, before potential overgrowth of contaminating non-parenchymal cells (<10% of the purified hepatocyte population, data not shown) may confound the results. Notably, Snail expression was significantly higher in TCD cultures by 2.7±0.6 fold at 24h as compared to RWV cultures. Vimentin (Vim), a cytoskeletal intermediate filament widely used as a marker of EMT [38], was expressed 6.6±1.3 fold higher in monolayer cultures compared to 3D aggregate cultures. Furthermore, expression of lysyl oxidase-like 2 (Loxl2), another inducer of EMT [39], was also significantly upregulated by 33.3±6.5 fold in TCDs compared to RWVs (Figure 6). Expression of E-cadherin (Cdh1) and N-cadherin (Cdh2), adhesion molecules characteristic of epithelial and mesenchymal cells, respectively, were not significantly different between TCD and RWV cultures (data not shown). Instead, several cytoskeletal genes not previously described in hepatocyte monolayer cultures were significantly upregulated in TCDs compared to RWVs. These included filamin A (Flna), an actin-binding protein that interacted with vimentin to regulate cell adhesion and spreading [40], whose expression was increased 3.7±0.4 fold in TCDs compared to RWVs. Expression of α1-actin (Acta1), an actin isoform expressed primarily in skeletal muscle [41], was greatly increased by 25.9±4.2 fold in monolayer cultures as compared to 3D aggregates. Finally, expression of β-tropomyosin (Tpm2), an isoform primarily expressed in skeletal muscle and fibroblasts [42], was also significantly increased by 6.9±1.5 fold in TCD-cultured hepatocytes (Figure 6). The significantly higher expression of mesenchymal and cytoskeletal genes in TCD as compared to RWV cultures at 24h suggests that these molecular pathways are induced in hepatocyte monolayers and suppressed in 3D aggregates.
Figure 6.

Mesenchymal and cytoskeletal genes were upregulated in hepatocytes cultured as monolayers in TCDs compared to 3D aggregates in RWVs. qRT-PCR demonstrated that expression levels of Snail (Snai1), vimentin (Vim), lysyl oxidase-like 2 (Loxl2), filamin A (Flna), α1 actin (Acta1), and β-tropomyosin (Tpm2) were significantly upregulated in TCD compared to RWV at 24h of culture. Data are the average of 6 independent experiments. *p<0.05, **p<0.005, ***p<0.001. Error bars indicate standard error.
4. Discussion
In this study, we used global gene expression profiling and promoter region analyses to identify molecular differences between primary mouse hepatocytes cultured as monolayers on TCDs and as 3D aggregates generated in RWVs. Our results indicated that improved synthetic and metabolic functions in hepatocyte 3D aggregates reflected the upregulated expression of a diverse array of hepatocyte-specific functional genes compared to monolayer cultures. The pattern of differential gene expression was distinct from molecular pathways induced during hepatocyte differentiation in organogenesis or hepatocyte proliferation after two-thirds hepatectomy. Remarkably, TFBS analysis revealed that more than 50% of the genes upregulated in RWV cultures had Hnf4a binding sites in their promoter regions. Hnf4a binding sites were the most significantly over-represented TFBS in genes differentially upregulated in RWV cultures and expression of Hnf4a itself was significantly upregulated in 3D aggregates compared to monolayers. While cell-matrix interactions dominate in hepatocyte monolayers cultured on collagen-coated TCDs, 3D cell-cell interactions dominate within self-aggregated spheroids generated in RWVs. These findings suggest that 3D cell-cell interactions are important for sustained expression of Hnf4a, which in turn plays a key role in maintaining differentiated hepatocyte functions in 3D aggregates.
Hnf4a (also known as Nr2a1) is a liver-enriched transcription factor and a member of the nuclear receptor superfamily. It can activate gene transcription in the absence of exogenous ligand [43], though it has a hydrophobic binding pocket and linoleic acid may be a potential endogenous ligand [44]. Hnf4a is known to have essential roles in normal liver development, maintaining mature liver functions, and in inducing hepatic differentiation in stem cells and fibroblasts. Targeted disruption of Hnf4a in mice led to embryonic lethality due to failure to complete gastrulation [45]. Tetraploid complementation of Hnf4a−/− embryos demonstrated that Hnf4a was essential for hepatocyte differentiation during liver development [46]. Conditional knock-out of Hnf4a in fetal hepatocytes showed that Hnf4a was required for normal morphological and functional differentiation of hepatocytes and development of hepatic epithelium [47]. In addition to its critical role during liver development, Hnf4a is also required to maintain normal metabolic functions of mature hepatocytes. Conditional knock-out of Hnf4a in mature hepatocytes, generated by mating Hnf4aloxp/loxp mice with mice expressing Cre under the albumin promoter, showed that Hnf4a was an essential regulator of lipid homeostasis [48], bile acid metabolism [49], glucose metabolism [50], and xenobiotic metabolism [51]. Moreover, ectopic expression of Hnf4a is required for conversion of fibroblasts to hepatocyte-like cells that have mature hepatocyte functions, including the ability to reconstitute liver tissue after transplantation [52]. Over-expression of Hnf4a in human embryonic stem cell and induced pluripotent stem cell derived hepatoblasts was able to significantly improve the mature hepatocyte functions of differentiated cells [53]. Finally, genome-wide studies demonstrated that Hnf4a bound the promoters of liver-specific genes significantly more often than other liver-enriched transcription factors [54, 55], indicating that Hnf4a was one of the most important transcriptional master regulators of hepatocyte function.
Our global gene expression and promoter region analyses indicate that Hnf4a also plays a central role in maintaining hepatocyte-specific functions in 3D culture. Three-dimensional culture has been shown to improve hepatocyte differentiated functions but the underlying mechanisms of how 3D culture induced these effects were previously unknown. Our data suggest that 3D cell-cell interactions are important for maintaining expression of the master regulator Hnf4a at a higher level compared to monolayer culture. Increased expression of Hnf4a in 3D culture in turn leads to sustained expression of a wide range of downstream hepatocyte-specific functional genes as well as improved overall metabolic function of the hepatocyte. Several gene targets correlating with mature hepatocyte functions significantly upregulated in RWVs are known direct targets of Hnf4a (e.g. Baat, F7, and Gys2) [47, 49, 56] or have Hnf4a binding sites within their promoter regions (e.g. Akr1c19) [57]. There are also functional genes highly upregulated in RWVs that do not possess Hnf4a TFBS (e.g. Hfe2 and Lepr) [57], suggesting that Hnf4a may have an indirect role in controlling expression of these genes or that other transcriptional networks may be involved. Nevertheless, our analyses reveal that Hnf4a is likely the major transcriptional effector for maintaining differentiated functions of hepatocytes in 3D culture.
Conversely, one can consider the signals induced in monolayer cultures that may be repressed in 3D aggregates. Monolayer culture on TCD is a highly artificial environment in which cell-matrix interactions dominate and cells are spread against a stiff two-dimensional (2D) surface. Under these conditions, we found that hepatocytes significantly increased expression of mesenchymal and cytoskeletal genes compared to 3D aggregate culture. Hepatocytes cultured on collagen-coated TCDs have been shown to undergo fibroblastoid dedifferentiation [58, 59] and express mesenchymal cell characteristics [60–62]. Our results suggest that this transition towards a mesenchymal phenotype may be inhibited in hepatocytes cultured in 3D. We showed that while hepatocytes acquired spindle-like projections after several days of culture on TCDs, they maintained a round shape in 3D aggregates. Several EMT inducers and mesenchymal cell markers (Snail, Vim, and Loxl2) were highly upregulated in TCDs as compared RWVs. In addition, expression levels of several cytoskeletal genes not previously described in monolayer culture (Acta1, Tpm2, and Flna) were also significantly increased in TCDs compared to RWVs. There is evidence that Hnf4a actively represses the mesenchymal program in hepatocytes in conjunction with maintaining hepatocyte-specific differentiated functions. Hnf4a was shown to bind to the Vim and Snail promoters in hepatocytes and to directly repress transcription of Snail. Silencing of Hnf4a was sufficient to upregulate expression of both Vim and Snail [37]. Furthermore, ectopic expression of Hnf4a induced the reverse mesenchymal-to-epithelial transition (MET) process in fibroblasts [47]. Therefore, one interpretation of our data is that stiff 2D matrix interactions in monolayer culture inhibited expression of Hnf4a that in turn led to decreased expression of hepatocyte functional genes as well as upregulation of EMT inducers that promoted mesenchymal transition. Mechanotransduction, in which cells biochemically integrate mechanical matrix and substrate cues of the micro-environment, is an important determinant of cell function and behavior [63]. Future investigation in our lab will further characterize the differential molecular signals in monolayer versus 3D aggregate culture that lead to inhibited or maintained expression of Hnf4a in hepatocytes.
Our results demonstrating that 3D cell-cell interactions maintained expression of Hnf4a as a master regulator of hepatocyte functions and phenotype provide a foundation for rational design of biomaterials that aim to optimize hepatocyte function for in vitro and in vivo applications. Our findings suggest that biomaterials aimed to augment hepatocyte differentiated functions should maximize 3D cell-cell interactions and minimize stiff 2D substrate contacts. As self-aggregated hepatocyte spheroids may be considered biomaterials in their own right [22] and used in applications such as organ printing [23], our data inform how tissue engineering strategies utilizing hepatocyte spheroids may be optimized. Moreover, we show that 3D hepatocyte cultures would be advantageous for in vitro applications in which the differentiated state of hepatocytes is critical, such as drug toxicity studies. Along these lines, 3D aggregate cultures may also be effective in improving differentiation of hepatocyte-like cells derived from induced pluripotent stem cells, which would be beneficial for efforts aimed at liver disease modeling in vitro.
5. Conclusions
Using global gene expression and promoter region analyses, we demonstrated that the master transcriptional regulator Hnf4a has a major role in maintaining differentiated hepatocyte functions in 3D culture. Concomitantly, expression of mesenchymal and cytoskeletal genes induced in monolayer cultures were suppressed in 3D aggregates. These findings provide a basis for rational design of biomaterials that aim to optimize hepatocyte-specific functions for in vitro and in vivo applications.
Supplementary Material
Acknowledgments
This work was supported by the American College of Surgeons Resident Research Scholarship, the UCSF Liver Center Pilot/Feasibility Grant P30-DK026743, National Institutes of Health grant K08-DK093708 (to TTC), and in part by 5UH3-AG037628 (to MHF). The authors thank Drs. Hobart W. Harris and Holger Willenbring for critical review of the manuscript and Ms. Pamela Derish for manuscript editing.
Footnotes
Publisher's Disclaimer: This is a PDF file of an unedited manuscript that has been accepted for publication. As a service to our customers we are providing this early version of the manuscript. The manuscript will undergo copyediting, typesetting, and review of the resulting proof before it is published in its final citable form. Please note that during the production process errors may be discovered which could affect the content, and all legal disclaimers that apply to the journal pertain.
References
- 1.Pampaloni F, Reynaud EG, Stelzer EH. The third dimension bridges the gap between cell culture and live tissue. Nat Rev Mol Cell Biol. 2007;8:839–45. doi: 10.1038/nrm2236. [DOI] [PubMed] [Google Scholar]
- 2.Chang TT, Hughes-Fulford M. Monolayer and spheroid culture of human liver hepatocellular carcinoma cell line cells demonstrate distinct global gene expression patterns and functional phenotypes. Tissue Eng Part A. 2009;15:559–67. doi: 10.1089/ten.tea.2007.0434. [DOI] [PMC free article] [PubMed] [Google Scholar]
- 3.Brophy CM, Luebke-Wheeler JL, Amiot BP, Khan H, Remmel RP, Rinaldo P, et al. Rat hepatocyte spheroids formed by rocked technique maintain differentiated hepatocyte gene expression and function. Hepatology. 2009;49:578–86. doi: 10.1002/hep.22674. [DOI] [PMC free article] [PubMed] [Google Scholar]
- 4.Brown LA, Arterburn LM, Miller AP, Cowger NL, Hartley SM, Andrews A, et al. Maintenance of liver functions in rat hepatocytes cultured as spheroids in a rotating wall vessel. In Vitro Cell Dev Biol Anim. 2003;39:13–20. doi: 10.1290/1543-706X(2003)039<0013:MOLFIR>2.0.CO;2. [DOI] [PubMed] [Google Scholar]
- 5.Ji R, Zhang N, You N, Li Q, Liu W, Jiang N, et al. The differentiation of MSCs into functional hepatocyte-like cells in a liver biomatrix scaffold and their transplantation into liver-fibrotic mice. Biomaterials. 2012;33:8995–9008. doi: 10.1016/j.biomaterials.2012.08.058. [DOI] [PubMed] [Google Scholar]
- 6.Nagamoto Y, Tashiro K, Takayama K, Ohashi K, Kawabata K, Sakurai F, et al. The promotion of hepatic maturation of human pluripotent stem cells in 3D co-culture using type I collagen and Swiss 3T3 cell sheets. Biomaterials. 2012;33:4526–34. doi: 10.1016/j.biomaterials.2012.03.011. [DOI] [PubMed] [Google Scholar]
- 7.Wang Y, Zhang Y, Zhang S, Peng G, Liu T, Li Y, et al. Rotating microgravity-bioreactor cultivation enhances the hepatic differentiation of mouse embryonic stem cells on biodegradable polymer scaffolds. Tissue Eng Part A. 2012;18:2376–85. doi: 10.1089/ten.TEA.2012.0097. [DOI] [PubMed] [Google Scholar]
- 8.Yap KK, Dingle AM, Palmer JA, Dhillon RS, Lokmic Z, Penington AJ, et al. Enhanced liver progenitor cell survival and differentiation in vivo by spheroid implantation in a vascularized tissue engineering chamber. Biomaterials. 2013;34:3992–4001. doi: 10.1016/j.biomaterials.2013.02.011. [DOI] [PubMed] [Google Scholar]
- 9.Meli L, Jordan ET, Clark DS, Linhardt RJ, Dordick JS. Influence of a three-dimensional, microarray environment on human cell culture in drug screening systems. Biomaterials. 2012;33:9087–96. doi: 10.1016/j.biomaterials.2012.08.065. [DOI] [PMC free article] [PubMed] [Google Scholar]
- 10.Takayama K, Kawabata K, Nagamoto Y, Kishimoto K, Tashiro K, Sakurai F, et al. 3D spheroid culture of hESC/hiPSC-derived hepatocyte-like cells for drug toxicity testing. Biomaterials. 2013;34:1781–9. doi: 10.1016/j.biomaterials.2012.11.029. [DOI] [PubMed] [Google Scholar]
- 11.Hochleitner B, Hengster P, Bucher H, Ladurner R, Schneeberger S, Krismer A, et al. Significant survival prolongation in pigs with fulminant hepatic failure treated with a novel microgravity-based bioartificial liver. Artif Organs. 2006;30:906–14. doi: 10.1111/j.1525-1594.2006.00323.x. [DOI] [PubMed] [Google Scholar]
- 12.Gabriel E, Schievenbusch S, Kolossov E, Hengstler JG, Rotshteyn T, Bohlen H, et al. Differentiation and selection of hepatocyte precursors in suspension spheroid culture of transgenic murine embryonic stem cells. PLoS One. 2012;7:e44912. doi: 10.1371/journal.pone.0044912. [DOI] [PMC free article] [PubMed] [Google Scholar]
- 13.Kim SE, An SY, Woo DH, Han J, Kim JH, Jang YJ, et al. Engraftment potential of spheroid-forming hepatic endoderm derived from human embryonic stem cells. Stem Cells Dev. 2013;22:1818–29. doi: 10.1089/scd.2012.0401. [DOI] [PMC free article] [PubMed] [Google Scholar]
- 14.Feng ZQ, Chu XH, Huang NP, Leach MK, Wang G, Wang YC, et al. Rat hepatocyte aggregate formation on discrete aligned nanofibers of type-I collagen-coated poly(L-lactic acid) Biomaterials. 2010;31:3604–12. doi: 10.1016/j.biomaterials.2010.01.080. [DOI] [PubMed] [Google Scholar]
- 15.Hsieh TM, Ng CW, Narayanan K, Wan AC, Ying JY. Three-dimensional microstructured tissue scaffolds fabricated by two-photon laser scanning photolithography. Biomaterials. 2010;31:7648–52. doi: 10.1016/j.biomaterials.2010.06.029. [DOI] [PubMed] [Google Scholar]
- 16.Kasuya J, Sudo R, Tamogami R, Masuda G, Mitaka T, Ikeda M, et al. Reconstruction of 3D stacked hepatocyte tissues using degradable, microporous poly(d,l-lactide-co-glycolide) membranes. Biomaterials. 2012;33:2693–700. doi: 10.1016/j.biomaterials.2011.12.039. [DOI] [PubMed] [Google Scholar]
- 17.Lang R, Stern MM, Smith L, Liu Y, Bharadwaj S, Liu G, et al. Three-dimensional culture of hepatocytes on porcine liver tissue-derived extracellular matrix. Biomaterials. 2011;32:7042–52. doi: 10.1016/j.biomaterials.2011.06.005. [DOI] [PubMed] [Google Scholar]
- 18.Hammond TG, Hammond JM. Optimized suspension culture: the rotating-wall vessel. Am J Physiol Renal Physiol. 2001;281:F12–25. doi: 10.1152/ajprenal.2001.281.1.F12. [DOI] [PubMed] [Google Scholar]
- 19.Curcio E, Salerno S, Barbieri G, De Bartolo L, Drioli E, Bader A. Mass transfer and metabolic reactions in hepatocyte spheroids cultured in rotating wall gas-permeable membrane system. Biomaterials. 2007;28:5487–97. doi: 10.1016/j.biomaterials.2007.08.033. [DOI] [PubMed] [Google Scholar]
- 20.Khaoustov VI, Darlington GJ, Soriano HE, Krishnan B, Risin D, Pellis NR, et al. Induction of three-dimensional assembly of human liver cells by simulated microgravity. In Vitro Cell Dev Biol Anim. 1999;35:501–9. doi: 10.1007/s11626-999-0060-2. [DOI] [PubMed] [Google Scholar]
- 21.Yoffe B, Darlington GJ, Soriano HE, Krishnan B, Risin D, Pellis NR, et al. Cultures of human liver cells in simulated microgravity environment. Adv Space Res. 1999;24:829–36. doi: 10.1016/s0273-1177(99)00079-4. [DOI] [PubMed] [Google Scholar]
- 22.Williams DF. On the nature of biomaterials. Biomaterials. 2009;30:5897–909. doi: 10.1016/j.biomaterials.2009.07.027. [DOI] [PubMed] [Google Scholar]
- 23.Mironov V, Visconti RP, Kasyanov V, Forgacs G, Drake CJ, Markwald RR. Organ printing: tissue spheroids as building blocks. Biomaterials. 2009;30:2164–74. doi: 10.1016/j.biomaterials.2008.12.084. [DOI] [PMC free article] [PubMed] [Google Scholar]
- 24.Donato MT, Gomez-Lechon MJ, Castell JV. A microassay for measuring cytochrome P450IA1 and P450IIB1 activities in intact human and rat hepatocytes cultured on 96-well plates. Anal Biochem. 1993;213:29–33. doi: 10.1006/abio.1993.1381. [DOI] [PubMed] [Google Scholar]
- 25.Ho Sui SJ, Fulton DL, Arenillas DJ, Kwon AT, Wasserman WW. oPOSSUM: integrated tools for analysis of regulatory motif over-representation. Nucleic Acids Res. 2007;35:W245–52. doi: 10.1093/nar/gkm427. [DOI] [PMC free article] [PubMed] [Google Scholar]
- 26.Spandidos A, Wang X, Wang H, Seed B. PrimerBank: a resource of human and mouse PCR primer pairs for gene expression detection and quantification. Nucleic Acids Res. 2010;38:D792–9. doi: 10.1093/nar/gkp1005. [DOI] [PMC free article] [PubMed] [Google Scholar]
- 27.Otu HH, Naxerova K, Ho K, Can H, Nesbitt N, Libermann TA, et al. Restoration of liver mass after injury requires proliferative and not embryonic transcriptional patterns. J Biol Chem. 2007;282:11197–204. doi: 10.1074/jbc.M608441200. [DOI] [PubMed] [Google Scholar]
- 28.Pellicoro A, van den Heuvel FA, Geuken M, Moshage H, Jansen PL, Faber KN. Human and rat bile acid-CoA:amino acid N-acyltransferase are liver-specific peroxisomal enzymes: implications for intracellular bile salt transport. Hepatology. 2007;45:340–8. doi: 10.1002/hep.21528. [DOI] [PubMed] [Google Scholar]
- 29.Ishikura S, Horie K, Sanai M, Matsumoto K, Hara A. Enzymatic properties of a member (AKR1C19) of the aldo-keto reductase family. Biol Pharm Bull. 2005;28:1075–8. doi: 10.1248/bpb.28.1075. [DOI] [PubMed] [Google Scholar]
- 30.Soggia AP, Correa-Giannella ML, Fortes MA, Luna AM, Pereira MA. A novel mutation in the glycogen synthase 2 gene in a child with glycogen storage disease type 0. BMC Med Genet. 2010;11:3. doi: 10.1186/1471-2350-11-3. [DOI] [PMC free article] [PubMed] [Google Scholar]
- 31.Green G, Poller L, Thomson JM, Dymock IW. Factor VII as a marker of hepatocellular synthetic function in liver disease. J Clin Pathol. 1976;29:971–5. doi: 10.1136/jcp.29.11.971. [DOI] [PMC free article] [PubMed] [Google Scholar]
- 32.Hwang-Verslues WW, Sladek FM. HNF4alpha--role in drug metabolism and potential drug target? Curr Opin Pharmacol. 2010;10:698–705. doi: 10.1016/j.coph.2010.08.010. [DOI] [PMC free article] [PubMed] [Google Scholar]
- 33.Cereghini S. Liver-enriched transcription factors and hepatocyte differentiation. FASEB J. 1996;10:267–82. [PubMed] [Google Scholar]
- 34.Lee YH, Sauer B, Johnson PF, Gonzalez FJ. Disruption of the c/ebp alpha gene in adult mouse liver. Mol Cell Biol. 1997;17:6014–22. doi: 10.1128/mcb.17.10.6014. [DOI] [PMC free article] [PubMed] [Google Scholar]
- 35.Lee CS, Friedman JR, Fulmer JT, Kaestner KH. The initiation of liver development is dependent on Foxa transcription factors. Nature. 2005;435:944–7. doi: 10.1038/nature03649. [DOI] [PubMed] [Google Scholar]
- 36.Sund NJ, Ang SL, Sackett SD, Shen W, Daigle N, Magnuson MA, et al. Hepatocyte nuclear factor 3beta (Foxa2) is dispensable for maintaining the differentiated state of the adult hepatocyte. Mol Cell Biol. 2000;20:5175–83. doi: 10.1128/mcb.20.14.5175-5183.2000. [DOI] [PMC free article] [PubMed] [Google Scholar]
- 37.Santangelo L, Marchetti A, Cicchini C, Conigliaro A, Conti B, Mancone C, et al. The stable repression of mesenchymal program is required for hepatocyte identity: a novel role for hepatocyte nuclear factor 4alpha. Hepatology. 2011;53:2063–74. doi: 10.1002/hep.24280. [DOI] [PMC free article] [PubMed] [Google Scholar]
- 38.Mendez MG, Kojima S, Goldman RD. Vimentin induces changes in cell shape, motility, and adhesion during the epithelial to mesenchymal transition. FASEB J. 2010;24:1838–51. doi: 10.1096/fj.09-151639. [DOI] [PMC free article] [PubMed] [Google Scholar]
- 39.Cano A, Santamaria PG, Moreno-Bueno G. LOXL2 in epithelial cell plasticity and tumor progression. Future Oncol. 2012;8:1095–108. doi: 10.2217/fon.12.105. [DOI] [PubMed] [Google Scholar]
- 40.Kim H, McCulloch CA. Filamin A mediates interactions between cytoskeletal proteins that control cell adhesion. FEBS Lett. 2011;585:18–22. doi: 10.1016/j.febslet.2010.11.033. [DOI] [PubMed] [Google Scholar]
- 41.Perrin BJ, Ervasti JM. The actin gene family: function follows isoform. Cytoskeleton (Hoboken) 2010;67:630–4. doi: 10.1002/cm.20475. [DOI] [PMC free article] [PubMed] [Google Scholar]
- 42.Perry SV. Vertebrate tropomyosin: distribution, properties and function. J Muscle Res Cell Motil. 2001;22:5–49. doi: 10.1023/a:1010303732441. [DOI] [PubMed] [Google Scholar]
- 43.Sladek FM, Zhong WM, Lai E, Darnell JE., Jr Liver-enriched transcription factor HNF-4 is a novel member of the steroid hormone receptor superfamily. Genes Dev. 1990;4:2353–65. doi: 10.1101/gad.4.12b.2353. [DOI] [PubMed] [Google Scholar]
- 44.Yuan X, Ta TC, Lin M, Evans JR, Dong Y, Bolotin E, et al. Identification of an endogenous ligand bound to a native orphan nuclear receptor. PLoS One. 2009;4:e5609. doi: 10.1371/journal.pone.0005609. [DOI] [PMC free article] [PubMed] [Google Scholar]
- 45.Chen WS, Manova K, Weinstein DC, Duncan SA, Plump AS, Prezioso VR, et al. Disruption of the HNF-4 gene, expressed in visceral endoderm, leads to cell death in embryonic ectoderm and impaired gastrulation of mouse embryos. Genes Dev. 1994;8:2466–77. doi: 10.1101/gad.8.20.2466. [DOI] [PubMed] [Google Scholar]
- 46.Li J, Ning G, Duncan SA. Mammalian hepatocyte differentiation requires the transcription factor HNF-4alpha. Genes Dev. 2000;14:464–74. [PMC free article] [PubMed] [Google Scholar]
- 47.Parviz F, Matullo C, Garrison WD, Savatski L, Adamson JW, Ning G, et al. Hepatocyte nuclear factor 4alpha controls the development of a hepatic epithelium and liver morphogenesis. Nat Genet. 2003;34:292–6. doi: 10.1038/ng1175. [DOI] [PubMed] [Google Scholar]
- 48.Hayhurst GP, Lee YH, Lambert G, Ward JM, Gonzalez FJ. Hepatocyte nuclear factor 4alpha (nuclear receptor 2A1) is essential for maintenance of hepatic gene expression and lipid homeostasis. Mol Cell Biol. 2001;21:1393–403. doi: 10.1128/MCB.21.4.1393-1403.2001. [DOI] [PMC free article] [PubMed] [Google Scholar]
- 49.Inoue Y, Yu AM, Inoue J, Gonzalez FJ. Hepatocyte nuclear factor 4alpha is a central regulator of bile acid conjugation. J Biol Chem. 2004;279:2480–9. doi: 10.1074/jbc.M311015200. [DOI] [PubMed] [Google Scholar]
- 50.Stoffel M, Duncan SA. The maturity-onset diabetes of the young (MODY1) transcription factor HNF4alpha regulates expression of genes required for glucose transport and metabolism. Proc Natl Acad Sci U S A. 1997;94:13209–14. doi: 10.1073/pnas.94.24.13209. [DOI] [PMC free article] [PubMed] [Google Scholar]
- 51.Lu H, Gonzalez FJ, Klaassen C. Alterations in hepatic mRNA expression of phase II enzymes and xenobiotic transporters after targeted disruption of hepatocyte nuclear factor 4 alpha. Toxicol Sci. 2010;118:380–90. doi: 10.1093/toxsci/kfq280. [DOI] [PMC free article] [PubMed] [Google Scholar]
- 52.Sekiya S, Suzuki A. Direct conversion of mouse fibroblasts to hepatocyte-like cells by defined factors. Nature. 2011;475:390–3. doi: 10.1038/nature10263. [DOI] [PubMed] [Google Scholar]
- 53.Takayama K, Inamura M, Kawabata K, Katayama K, Higuchi M, Tashiro K, et al. Efficient generation of functional hepatocytes from human embryonic stem cells and induced pluripotent stem cells by HNF4alpha transduction. Mol Ther. 2012;20:127–37. doi: 10.1038/mt.2011.234. [DOI] [PMC free article] [PubMed] [Google Scholar]
- 54.Odom DT, Zizlsperger N, Gordon DB, Bell GW, Rinaldi NJ, Murray HL, et al. Control of pancreas and liver gene expression by HNF transcription factors. Science. 2004;303:1378–81. doi: 10.1126/science.1089769. [DOI] [PMC free article] [PubMed] [Google Scholar]
- 55.Schmidt D, Wilson MD, Ballester B, Schwalie PC, Brown GD, Marshall A, et al. Five-vertebrate ChIP-seq reveals the evolutionary dynamics of transcription factor binding. Science. 2010;328:1036–40. doi: 10.1126/science.1186176. [DOI] [PMC free article] [PubMed] [Google Scholar]
- 56.Stauffer DR, Chukwumezie BN, Wilberding JA, Rosen ED, Castellino FJ. Characterization of transcriptional regulatory elements in the promoter region of the murine blood coagulation factor VII gene. J Biol Chem. 1998;273:2277–87. doi: 10.1074/jbc.273.4.2277. [DOI] [PubMed] [Google Scholar]
- 57.Bolotin E, Liao H, Ta TC, Yang C, Hwang-Verslues W, Evans JR, et al. Integrated approach for the identification of human hepatocyte nuclear factor 4alpha target genes using protein binding microarrays. Hepatology. 2010;51:642–53. doi: 10.1002/hep.23357. [DOI] [PMC free article] [PubMed] [Google Scholar]
- 58.Godoy P, Hengstler JG, Ilkavets I, Meyer C, Bachmann A, Muller A, et al. Extracellular matrix modulates sensitivity of hepatocytes to fibroblastoid dedifferentiation and transforming growth factor beta-induced apoptosis. Hepatology. 2009;49:2031–43. doi: 10.1002/hep.22880. [DOI] [PubMed] [Google Scholar]
- 59.Tuschl G, Mueller SO. Effects of cell culture conditions on primary rat hepatocytes-cell morphology and differential gene expression. Toxicology. 2006;218:205–15. doi: 10.1016/j.tox.2005.10.017. [DOI] [PubMed] [Google Scholar]
- 60.Kaimori A, Potter J, Kaimori JY, Wang C, Mezey E, Koteish A. Transforming growth factor-beta1 induces an epithelial-to-mesenchymal transition state in mouse hepatocytes in vitro. J Biol Chem. 2007;282:22089–101. doi: 10.1074/jbc.M700998200. [DOI] [PubMed] [Google Scholar]
- 61.Taura K, Miura K, Iwaisako K, Osterreicher CH, Kodama Y, Penz-Osterreicher M, et al. Hepatocytes do not undergo epithelial-mesenchymal transition in liver fibrosis in mice. Hepatology. 2010;51:1027–36. doi: 10.1002/hep.23368. [DOI] [PMC free article] [PubMed] [Google Scholar]
- 62.Zeisberg M, Yang C, Martino M, Duncan MB, Rieder F, Tanjore H, et al. Fibroblasts derive from hepatocytes in liver fibrosis via epithelial to mesenchymal transition. J Biol Chem. 2007;282:23337–47. doi: 10.1074/jbc.M700194200. [DOI] [PubMed] [Google Scholar]
- 63.DuFort CC, Paszek MJ, Weaver VM. Balancing forces: architectural control of mechanotransduction. Nat Rev Mol Cell Biol. 2011;12:308–19. doi: 10.1038/nrm3112. [DOI] [PMC free article] [PubMed] [Google Scholar]
Associated Data
This section collects any data citations, data availability statements, or supplementary materials included in this article.