Abstract
The present studies were designed to compare and contrast the abilities of TRAIL (death receptor agonist) and obatoclax (BCL-2 family inhibitor) to enhance [sorafenib + HDAC inhibitor] toxicity in GI tumor cells. Sorafenib and HDAC inhibitor treatment required expression of CD95 to kill GI tumor cells in vitro and in vivo. In cells lacking CD95 expression, TRAIL treatment, and to a lesser extent obatoclax, enhanced the lethal effects of [sorafenib + HDAC inhibitor] exposure. In hepatoma cells expressing CD95 a similar data pattern emerged with respect to the actions of TRAIL. Downstream of the death receptor the ability of TRAIL to enhance cell killing correlated with reduced AKT, ERK1/2, p70 S6K and mTOR activity and enhanced cleavage of pro-caspase 3 and reduced expression of MCL-1 and BCL-XL. Over-expression of BCL-XL or MCL-1 or expression of dominant negative pro-caspase 9 protected cells from drug toxicity. Expression of activated AKT, p70 S6K, mTORand to a lesser extent MEK1EE also protected cells that correlated with maintained c-FLIP-s expression, reduced BIM expression and increased BAD phosphorylation. In vivo [sorafenib + HDAC inhibitor] toxicity against tumors was increased in a greater than additive fashion by TRAIL.Collectively, our data argue that TRAIL, rather than obatoclax, is the most efficacious agent at promoting [sorafenib + HDAC inhibitor] lethality.
Keywords: sorafenib, histone deacetylase inhibitor, kinase, apoptosis, CD95, TRAIL, MCL-1
Introduction
Sorafenib was developed to inhibit RAF-1 and that wassubsequently shown to inhibit class III receptor tyrosine kinases (e.g. Porta et al, 2009; Bareford et al, 2011; Park et al, 2010a; Wilhelm et al, 2008). Recent studies have argued that low concentrations of sorafenib can stimulate the activation of the CD95 death receptor, resulting in tumor cell death (Park et al, 2010a; Park et al, 2010b). Others have also shown SRC family tyrosine kinases can activate CD95, and sorafenib can activate CD95 through this mechanism (e.g. Reinehr et al, 2005; Eberle et al, 2007; Reinehr et al, 2004).
Histone deacetylase inhibitors (HDACIs) inhibit enzymes that de-acetylate histones (Venugopal and Evans, 2011). Many other proteins are also acetylated and it is probable that the actions of HDACIs involve both the regulation of gene expression as well as regulating acetylation of other cytosolic proteins (Reikvam et al, 2009). In our prior studies in GI tumor cells HDAC inhibitors were shown to increase the levels of FAS-ligand as well as its receptor CD95, both of which played a role in HDAC inhibitor toxicity (Zhang et al, 2008). Sorafenib and HDAC inhibitors have been shown by our group and others to interact in a greater than additive fashion to kill tumor cells (Kim et al, 2012; Lachenmayer et al, 2012). The expression of CD95 was required for this combination to kill GI and GU tumor cell types. As yet, a rational approach to developing a three agent combination with [sorafenib + HDAC inhibitor] has not been fully explored.
TNF-related apoptosis-inducing ligand (TRAIL), like FAS-L, activates death receptors (DR4, DR5 in the case of TRAIL) on the surface of cells, leading to activation of the extrinsic apoptosis pathway(Abdulghani and El-Deiry, 2010; Dimberg et al, 2012; Hellwig and Rehm, 2012). TRAIL has been shown to interact with higher concentrations of sorafenib to enhance tumor cell killing (Ricci et al, 2007; Llobet et al, 2010; Meng et al, 2007). Obatoclax is an inhibitor of protective BCL-2 family proteins (BCL-2; BCL-XL; MCL-1)and has undergone Phase II evaluation (Chonghaile and Letai, 2008). Obatoclax promotes the release of toxic BH3 domain proteins e.g. BAX and BAK, from protective BCL-2 proteins thus facilitating / predisposing pore formation in the outer mitochondrial membrane and activation of the intrinsic apoptosis pathway (Fulda et al, 2010; Crawford et al, 2011; Mitchell et al, 2010; Smoot et al, 2010). We have previously shown that obatoclax can promote the lethality of [sorafenib + HDAC inhibitor] treatment in the absence of CD95 however no studies were performed side-by-side to compare the potentiating effects of obatoclax and of TRAIL in this system (Martin et al, 2009; Walker et al, 2009). Knowledge of these interactions i.e. the most efficacious approach, would permit a refinement of any future translated therapy.
The present studies were designed to determine the molecular mechanisms by which TRAIL and obatoclax enhance the lethality of [sorafenib + HDAC inhibitors].Our data show that in GI cell lines TRAIL enhances [sorafenib + HDAC inhibitor] lethality to a significantly greater extent than obatoclax. As [sorafenib + HDAC inhibitor] therapy is already in the clinic, our findings argue that further enhancement of the extrinsic pathway plays a greater role over further activation of the intrinsic pathway in enhancing tumor cell killing.
Materials and Methods
Materials
Phospho-/total- antibodies, were purchased from Cell Signaling Technologies (Worcester, MA). All the secondary antibodies were purchased from Santa Cruz Biotechnology (Santa Cruz, CA). Commercially available validated short hairpin RNA molecules to knock down RNA / protein levels were from Qiagen (Valencia, CA). CD95 plasmids were a kind gift from Dr. R. Reinehr (University of Dusseldorf, Germany) (Reinehr et al, 2005). HEPG2 and HEP3B cells were obtained from the ATCC. Other reagents and techniques were as described in (Park et al, 2010a; Park et al, 2010b; Martin et al, 2009; Mitchell et al, 2010).
Methods
Culture and in vitro exposure of cells to drugs
All established cell lines were cultured at 37 °C (5% (v/v CO2) in vitro using RPMI supplemented with 5% (v/v) fetal calf serum and 10% (v/v) Non-essential amino acids. For short term cell killing assays and immunoblotting studies, cells were plated at a density of 3 × 10³ per cm2 (~2 × 10⁵ cells per well of a 12 well plate) and 48h after plating treated with various drugs, as indicated. In vitro treatments were from a 100 mM stock solution of each drug and the maximal concentration of Vehicle (DMSO) in media was 0.02% (v/v). Cells were not cultured in reduced serum media during any study in this manuscript.
In vitro cell treatments, microscopy, SDS-PAGE and Western blot analysis
For in vitro analyses of short-term cell death effects, cells were treated with Vehicle / sorafenib / Na Valproate / vorinostat / TRAIL / Obatoclax for the indicated times in the Figure legends. For apoptosis assays where indicated, cells were treated with agents; cells were isolated at the indicated times, and subjected to trypan blue cell viability assay by counting in a light microscope.
For SDS PAGE and immunoblotting, cells were plated and treated with drugs at the indicated concentrations and after the indicated time of treatment, lysed in whole-cell lysis buffer (0.5 M Tris-HCl, pH 6.8, 2%SDS, 10% glycerol, 1% β-mercaptoethanol, 0.02% bromophenol blue), and the samples were boiled for 30 min. The boiled samples were loaded onto 10–14% SDS-PAGE and electrophoresis was run overnight. Proteins were electrophoretically transferred onto 0.22 µm nitrocellulose, and immunoblotted with various primary antibodies against different proteins. All immunoblots were visualized using fluorescent secondary antibodies and a LiCor Odyssey Infra-red imaging machine.
Infection of cells with recombinant adenoviruses
Cells were plated at 3×10³ per cm2 in each well of a 12 well, 6 well or 60 mm plate. After plating (24h), cells were infected (at a multiplicity of infection of 50) with a control empty vector virus (CMV) or the recombinant adenoviruses as indicated (Vector Biolabs, Philadelphia, PA). Twenty four hours after infection cells were treated with the indicated concentrations of vehicle and/or drugs, and cell survival or changes in expression / protein phosphorylation determined 0–48h after drug treatment by trypan blue assay and immunoblotting, respectively.
Transfection with siRNA
Cells were plated in 60 mm dishes from a fresh culture growing in log phase as described above, and 24h after plating transfected. Prior to transfection, the medium was aspirated and 1 ml serum-free medium was added to each plate. For transfection, 10 nM of the annealed siRNA, the positive sense control doubled stranded siRNA targeting GAPDH or the negative control (a “scrambled” sequence with no significant homology to any known gene sequences from mouse, rat or human cell lines) were used (predominantly Qiagen, Valencia, CA; occasional alternate siRNA molecules were purchased from Ambion, Inc., Austin, Texas). Ten nM siRNA (scrambled or experimental) was diluted in serum-free media. Four µl Hiperfect (Qiagen) was added to this mixture and the solution was mixed by pipetting up and down several times. This solution was incubated at room temp for 10 min, then added drop-wise to each dish. The medium in each dish was swirled gently to mix, then incubated at 37 °C for 2h. One ml of 10% (v/v) serum-containing medium was added to each plate, and cells were incubated at 37 °C for 24–48h before re-plating (50×103 cells each) onto 12-well plates. Cells were allowed to attach overnight, then treated with drugs (0–48h). Trypan blue exclusion assays and SDS PAGE / immunoblotting analyses were then performed at the indicated time points.
Inoculation of HuH7 cells
Athymic female NCr-nu/nu mice (NCI-Fredrick) weighing ~20g, were used for this study. Mice were maintained under pathogen-free conditions in facilities approved by the American Association for Accreditation of Laboratory Animal Care and in accordance with current regulations and standards of the U.S. Department of Agriculture, Washington, DC, the U.S. Department of Health and Human Services, Washington, DC, and the National Institutes of Health, Bethesda, MD. HuH7 cells (1×10⁶) were injected into the right rear flank of mice. For animal administration, Sorafenib and Vorinostat were first dissolved in DMSO and an equal volume of 50:50 Cremophor/Ethanol (Sigma) was added. After mixing, a 1:10 dilution was made with sterile PBS. Animals were treated with vehicle (PBS/Cremophor/Ethanol/DMSO), Sorafenib, Vorinostat or the drug combination were administered using oral gavage to a final concentration of 25 mg/kg body mass QD for sorafenib and 25 mg/kg QD for vorinostat for 5 days. TRAIL (1 mg/kg) was administered IV one day after the initiation of drug exposure for 5 days.
Immunohistochemistry and Staining of Fixed Tumor Sections
Tumors were removed using small scissors, forceps, and a disposable scalpel. The collected tumor was placed in 5 ml of Streck tissue fixative (Thermo Fisher Scientific, Waltham, MA) in a 50 ml conical tube for fixation. Fixed tumors were embedded in paraffin wax, and 10 µm slices were obtained using a microtome. Tumor sections were deparaffinized and rehydrated, and antigen retrieval was performed in a 10 mM (w/v) sodium citrate-citric acid buffer, pH 6.7. Prepared sections were then blocked and subjected to immunohistochemical analysis as per the instructions of the manufacturer for each primary antibody (Ki67 and cleaved caspase-3). The tissue sections were dehydrated, cleared, and mounted with cover slips using Permount.
Data analysis
Comparison of the effects of various treatments was performed following ANOVA using the Student’s t test. Differences with a p-value of < 0.05 were considered statistically significant. Experiments shown are the means of multiple individualpoints (± SEM). The fold-change in tumor mass was analyzed using repeated measures factorial analysis of variance. An AR(1) structure for the covariance accounts for the serial correlations over time.
Results
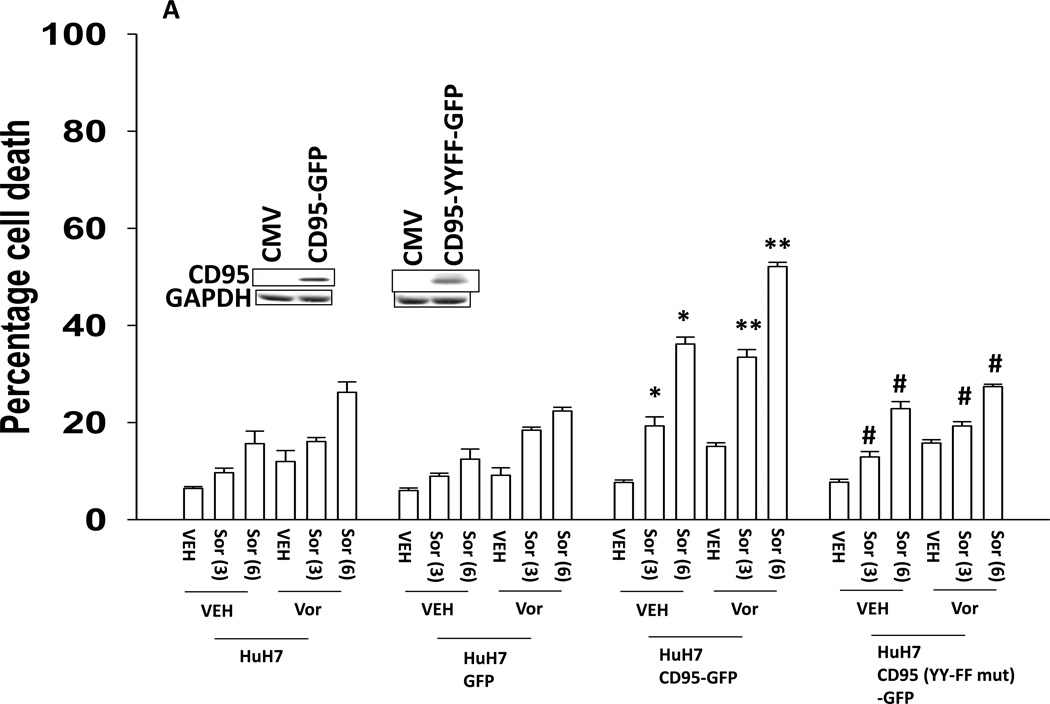
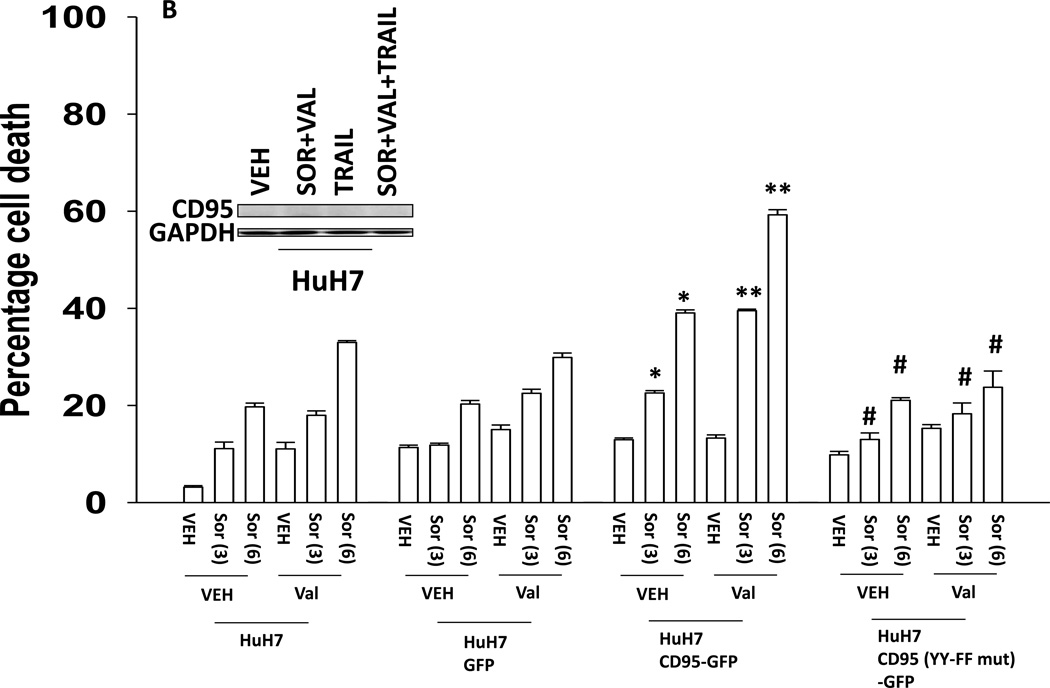
The present studies were performed to assess whether the lethality of [sorafenib and HDAC inhibitors] was enhanced by either further activation of the intrinsic pathway or further activation of the extrinsic pathway. Initial studies defined the role of CD95, and CD95 tyrosine phosphorylation, in the response of hepatoma cells to sorafenib and HDAC inhibitor treatment. Transfection of HuH7 cells, which lack endogenous CD95 expression, with a plasmid to express CD95 resulted in greater levels of killing following sorafenib and HDAC inhibitor treatment using either vorinostat or sodium valproate as the HDAC inhibitor (Figures 1A and 1B). No enhancement in cell killing occurred in cells transfected to express a mutant CD95 protein lacking the two sites of tyrosine phosphorylation required for receptor activation (Reinehr et al, 2005). CD95-dependent killing of cells has also been shown when cells are simultaneously treated with a MEK1/2 inhibitor and an HSP90 inhibitor. Similar data CD95-dependent cell killing effects were obtained in cells treated with the MEK1/2 inhibitor AZD6244 and the HSP90 inhibitor 17DMAG (Supplemental Figure 1).
Figure 1. Tyrosine phosphorylation of CD95 is essential for increased cell killing.
(A) HuH7 cells were transfected with plasmids to express GFP, GFP-CD95 or GFP-CD95 YY-FF. Twenty four h after transfection cells were treated with vehicle (DMSO) or the indicated concentrations of sorafenib (Sor, µM) and/or vorinostat (Vor, 500 nM). Cells were isolated 24h after drug exposure and cell viability determined by trypan blue exclusion (n = 3 +/− SEM). *p < 0.05 greater than vehicle control; **p < 0.05 greater than corresponding value in vehicle control treated cells; #p < 0.05 less than corresponding values in CD95-GFP expressing cells.(B) HuH7 cells were transfected with plasmids to express GFP, GFP-CD95 or GFP-CD95 YY-FF. Twenty four h after transfection cells were treated with vehicle (DMSO) or the indicated concentrations of sorafenib (Sor, µM) and/or Na valproate (Val, 1 mM). Cells were isolated 24h after drug exposure and cell viability determined by trypan blue exclusion (n = 3 +/− SEM). *p < 0.05 greater than vehicle control; **p < 0.05 greater than corresponding value in vehicle control treated cells; #p < 0.05 less than corresponding values in CD95-GFP expressing cells.
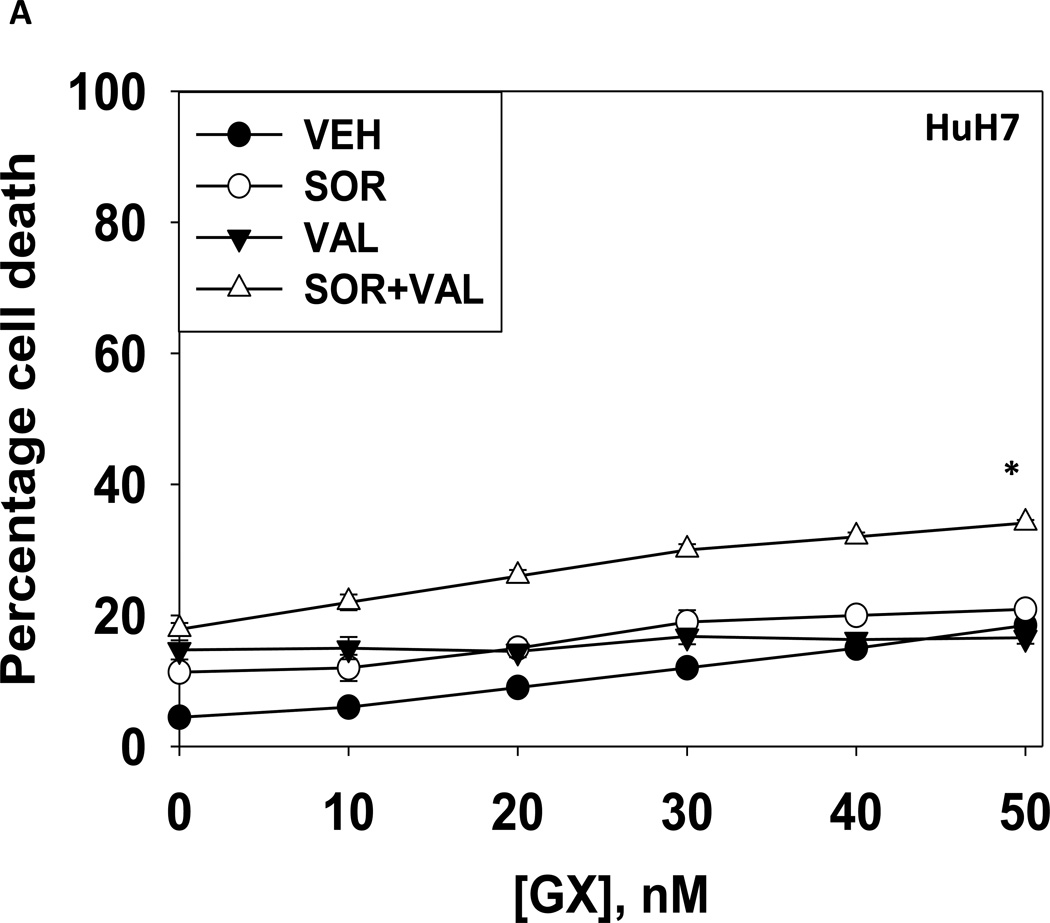
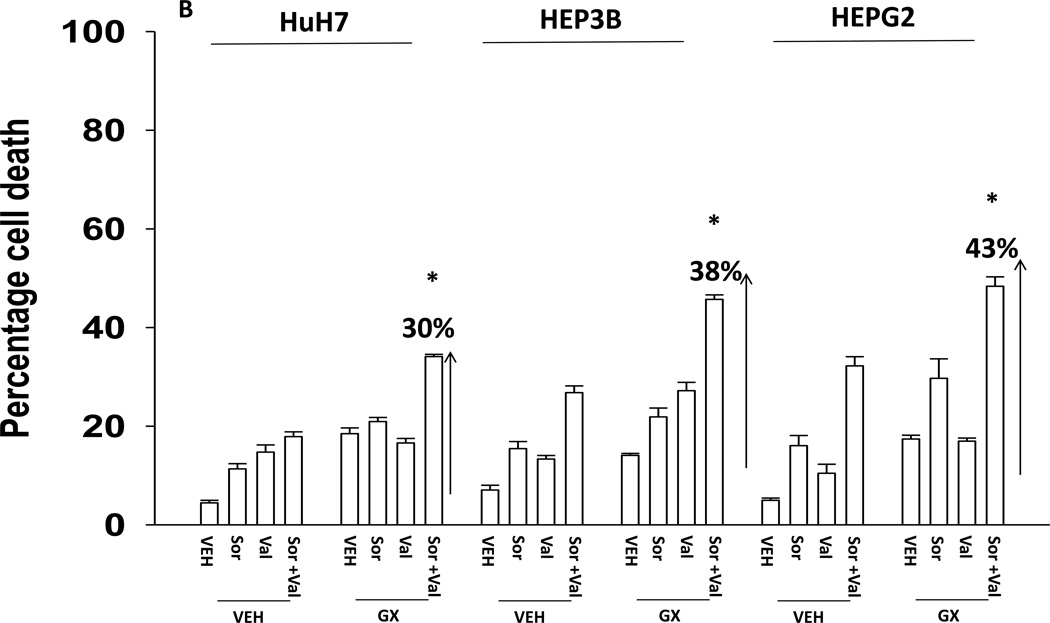
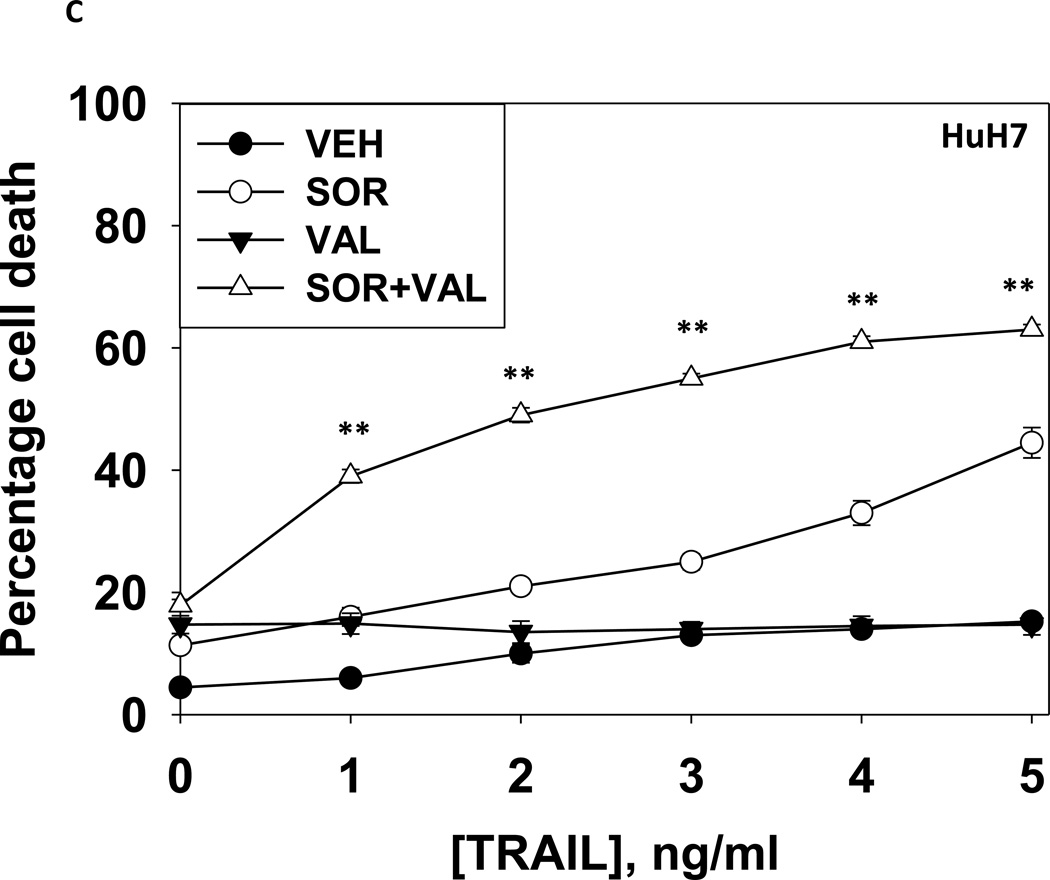
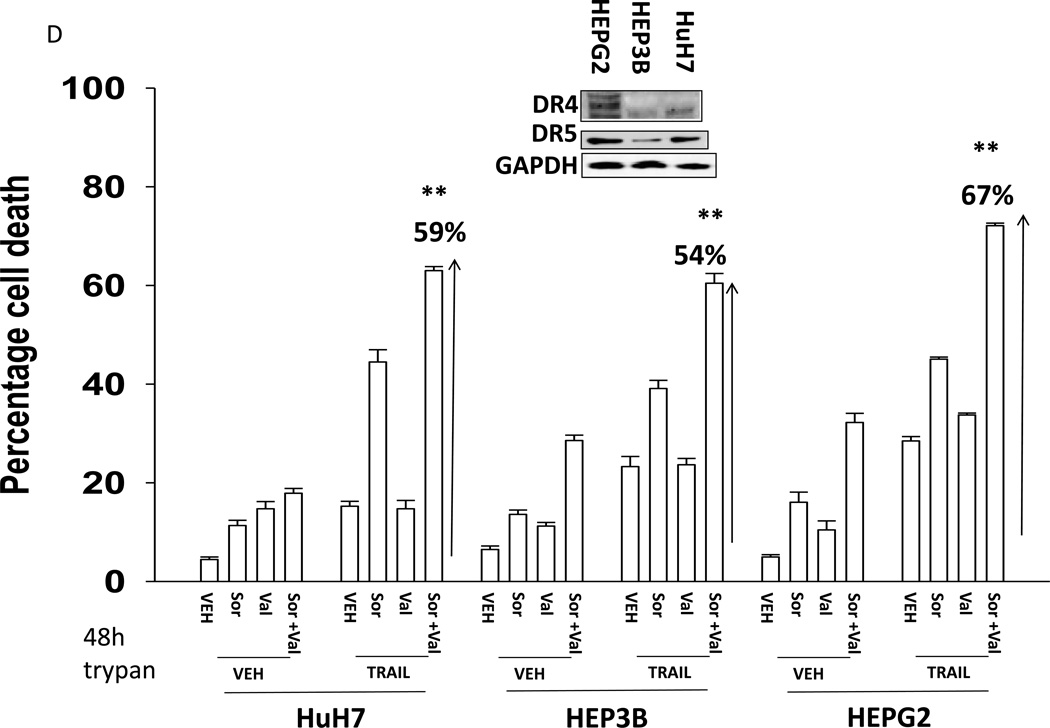
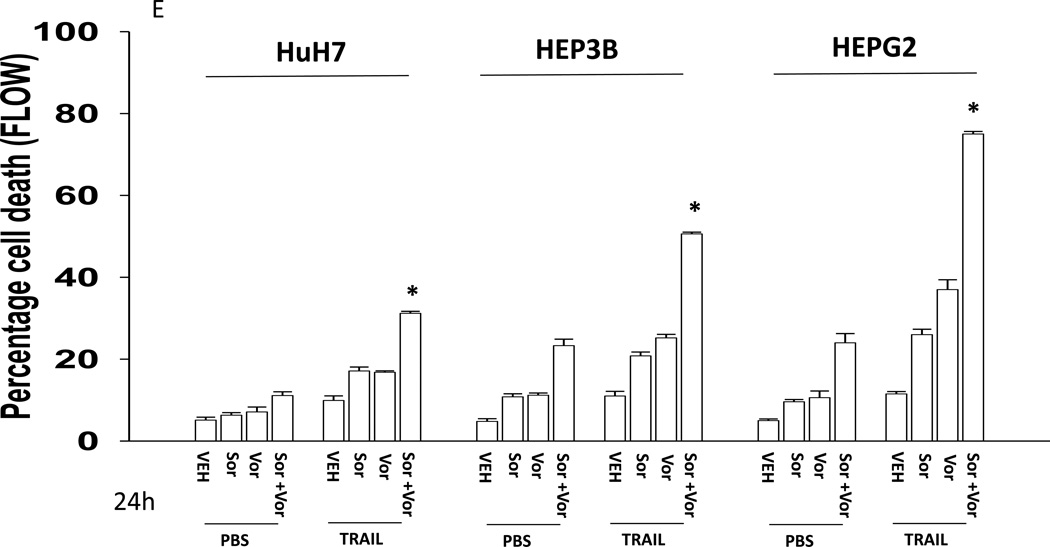
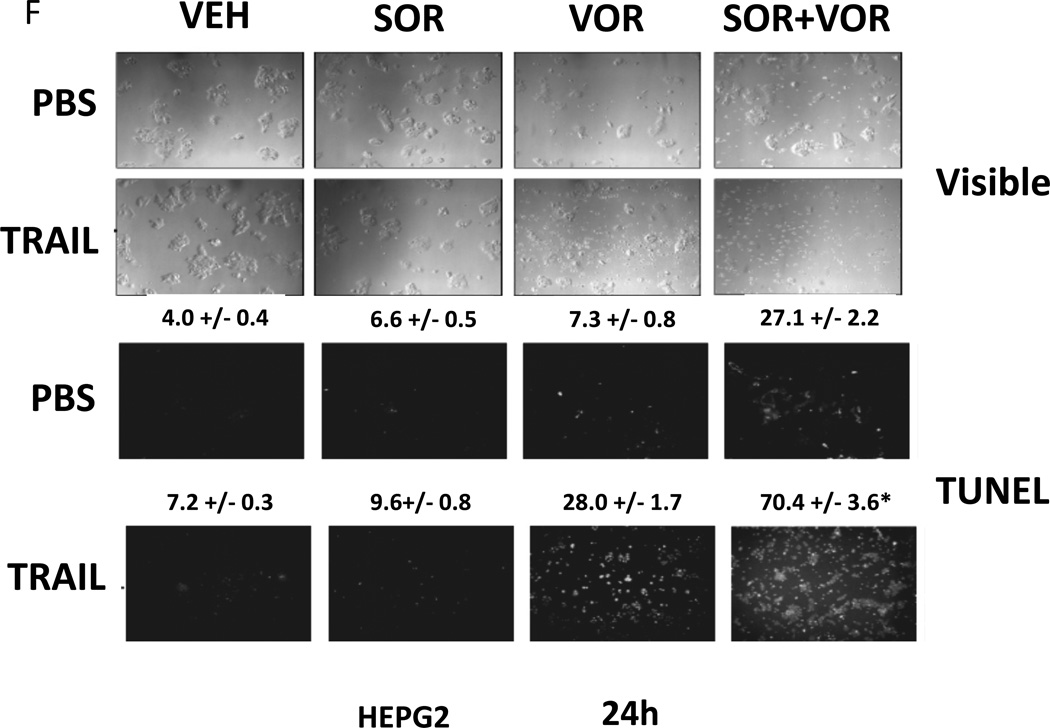
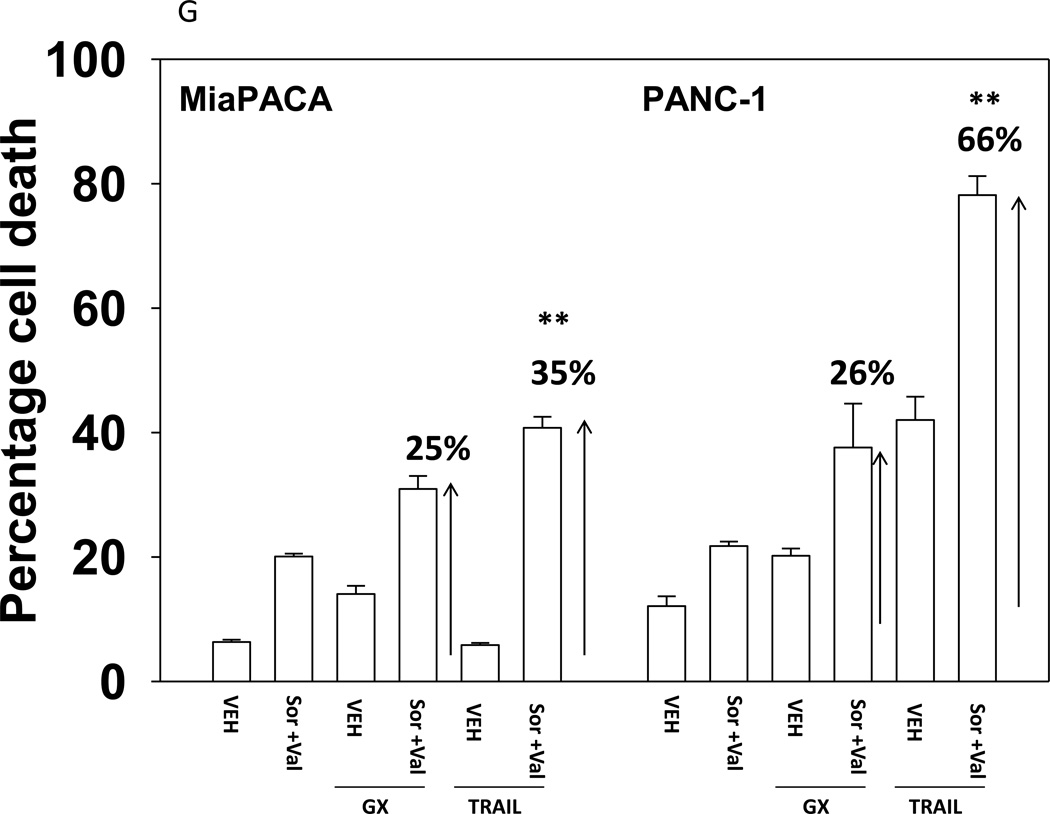
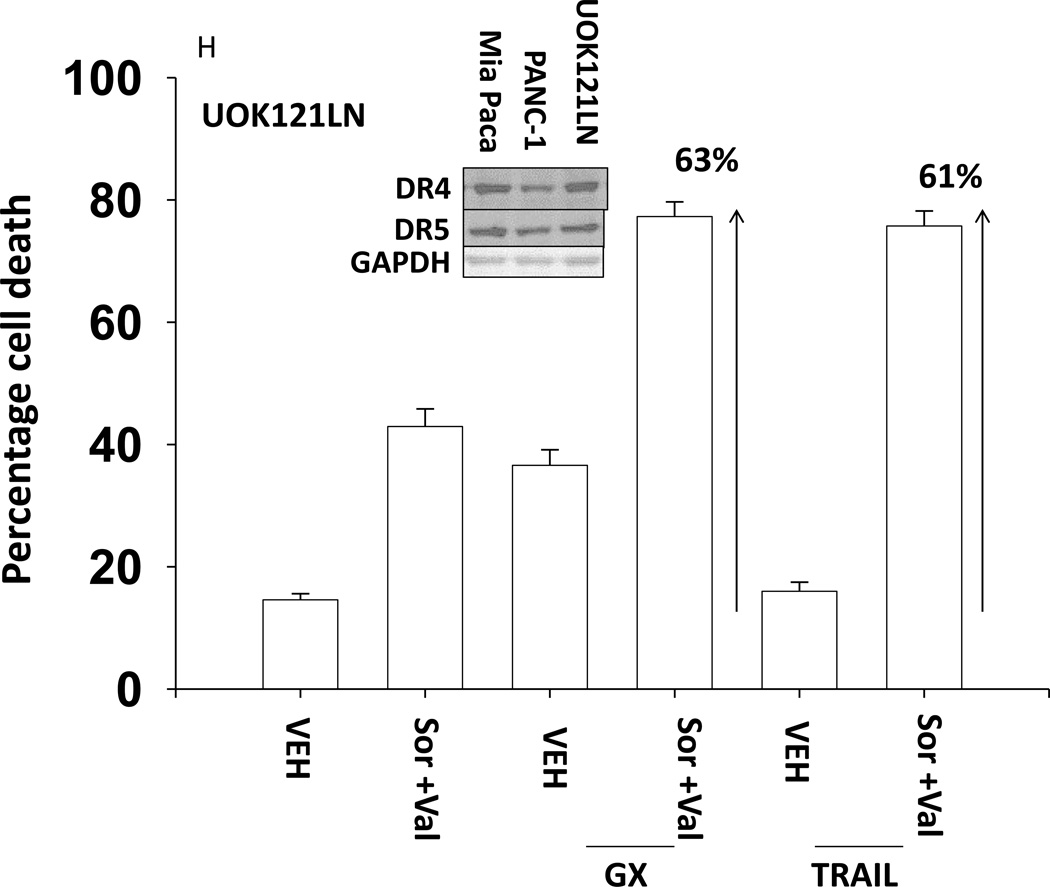
We next explored whetherfurther activation of the intrinsic pathway or activation of the extrinsic pathway enhanced sorafenib and HDAC inhibitor lethality. Treatment of hepatoma cells with [sorafenib + HDAC inhibitor] together with increasing doses of an inhibitor of protective BCL-2 family proteins, obatoclax (GX), enhanced overall cell killing by ~30–40% above basal levels (Figures 2A and 2B). Treatment of hepatoma cells with [sorafenib + HDAC inhibitor] together with increasing doses of an activator of the death receptors DR4/DR5, TRAIL, enhanced overall cell killing by ~55–65% above basal levels (Figures 2C and 2D). Similar data were obtained following TRAIL co-treatment when cell killing was measured by flow cytometery or by TUNEL staining (Figures 2E and 2F). In a similar manner to liver cancer cells treatment of pancreatic tumor cells with TRAIL enhanced [sorafenib + HDAC inhibitor] lethality to a greater extent than treatment with obatoclax (Figure 2G). In renal carcinoma cells, however, little difference between the potentiating effect of TRAIL and obatoclax was observed, suggesting a preference for TRAIL over obatoclax in promoting cell killing is not a universal finding (Figure 2H). Similar levels of DR4 and DR5 were expressed in both pancreatic and renal tumor cells. In transfected hepatoma cells treated with the AZD6244 and 17DMAG we observed similar findings to those with sorafenib with respect to the effect of TRAIL (Supplemental Figure 2).
Figure 2. TRAIL enhances [sorafenib + HDACI] toxicity to a greater extent than obatoclax.
(A) HuH7 cells were treated with vehicle (DMSO) or the indicated concentrations of sorafenib (Sor, 3 µM) and/or Na valproate (Val, 1 mM). Cells were treated with increasing concentrations of obatoclax (0–50 nM). Cells were isolated 24h after drug exposure and cell viability determined by trypan blue exclusion (n = 3 +/− SEM).*p < 0.05 greater than vehicle control. (B) HuH7, HEPG2 and HEP3B cellswere treated with vehicle (DMSO) or the indicated concentrations of sorafenib (Sor, 3 µM) and/or Na valproate (Val, 1 mM) and/or obatoclax (GX, 50 nM). Cells were isolated 24h after drug exposure and cell viability determined by trypan blue exclusion (n = 3 +/− SEM). *p < 0.05 greater than corresponding value in vehicle control treated cells. (C) HuH7 cells were treated with vehicle (DMSO) or the indicated concentrations of sorafenib (Sor, 3 µM) and/or Na valproate (Val, 1 mM). Cells were treated with increasing concentrations of TRAIL (0–5 ng/ml). Cells were isolated 24h after drug exposure and cell viability determined by trypan blue exclusion (n = 3 +/− SEM).**p < 0.05 greater than corresponding value in GX treated cells (panel A). (D) HuH7, HEPG2 and HEP3B cellswere treated with vehicle (DMSO) or the indicated concentrations of sorafenib (Sor, 3 µM) and/or Na valproate (Val, 1 mM) and/or TRAIL (5 ng/ml). Cells were isolated 24h after drug exposure and cell viability determined by trypan blue exclusion (n = 3 +/− SEM).**p < 0.05 greater than corresponding value in GX treated cells (panel B). (E) HuH7, HEPG2 and HEP3B cellswere treated with vehicle (DMSO) or the indicated concentrations of sorafenib (Sor, 3 µM) and/or Na valproate (Val, 1 mM) and/or TRAIL (5 ng/ml). Cells were isolated 24h after drug exposure and cell viability determined by flow cytometery (n = 3 +/− SEM).*p < 0.05 greater than corresponding value in vehicle control treated cells.(F) HuH7, HEPG2 and HEP3B cellswere treated with vehicle (DMSO) or the indicated concentrations of sorafenib (Sor, 3 µM) and/or Na valproate (Val, 1 mM) and/or TRAIL (5 ng/ml). Cells were isolated 24h after drug exposure and cell viability determined by TUNEL assay (n = 3 +/− SEM).*p < 0.05 greater than corresponding value in vehicle control treated cells.(G) Mia Paca and PANC-1 cells and (H) UOK121LN cells were treated with vehicle (DMSO) or the indicated concentrations of sorafenib (Sor, 3 µM) and/or Na valproate (Val, 1 mM) and/or TRAIL (5 ng/ml) and/or obatoclax (GX, 50 nM). Cells were isolated 24h after drug exposure and cell viability determined by trypan blue exclusion (n = 3 +/− SEM). **p < 0.05 greater than corresponding value in GX treated cells.
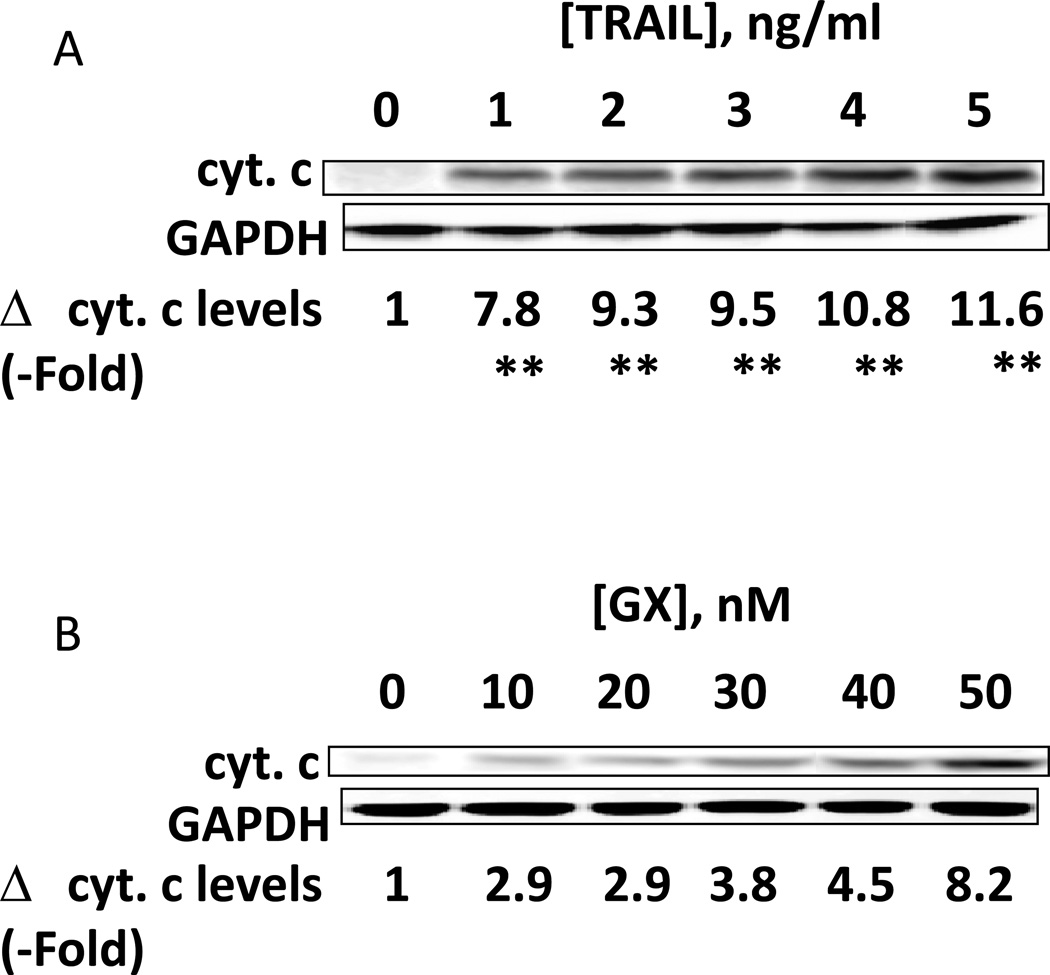
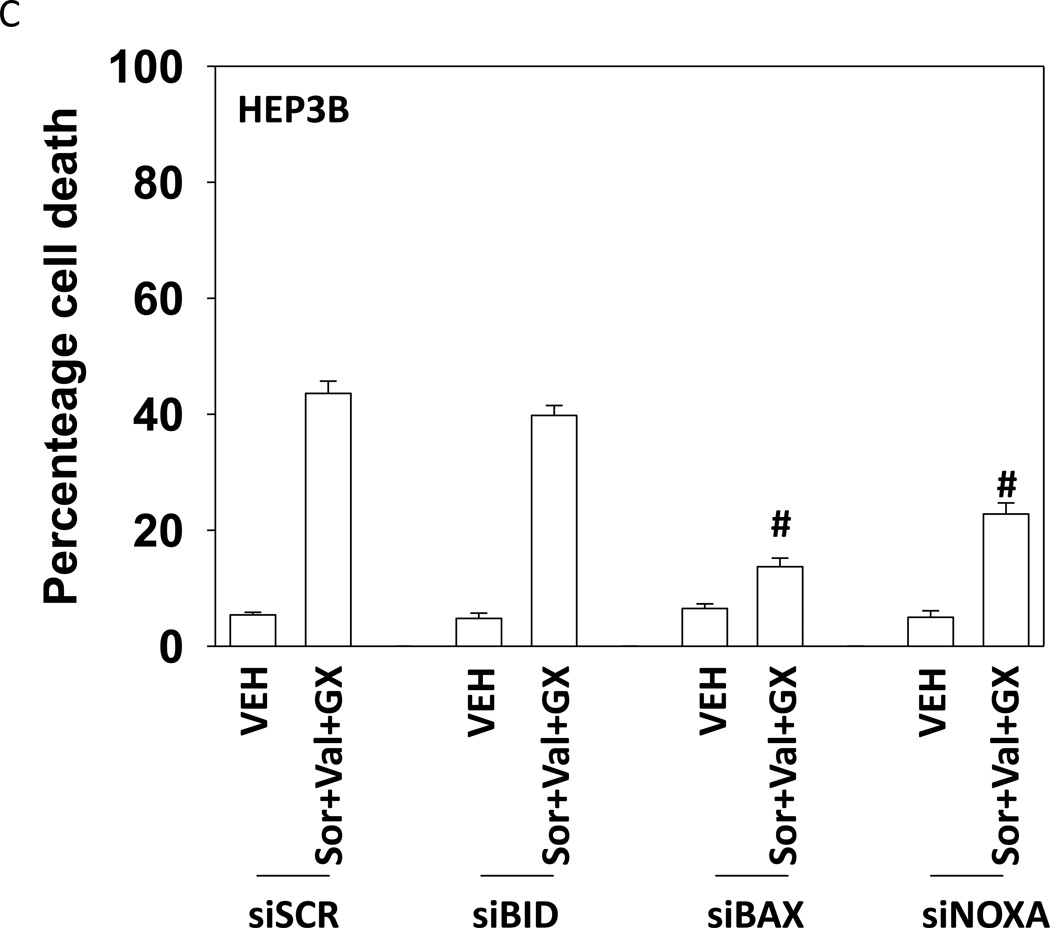
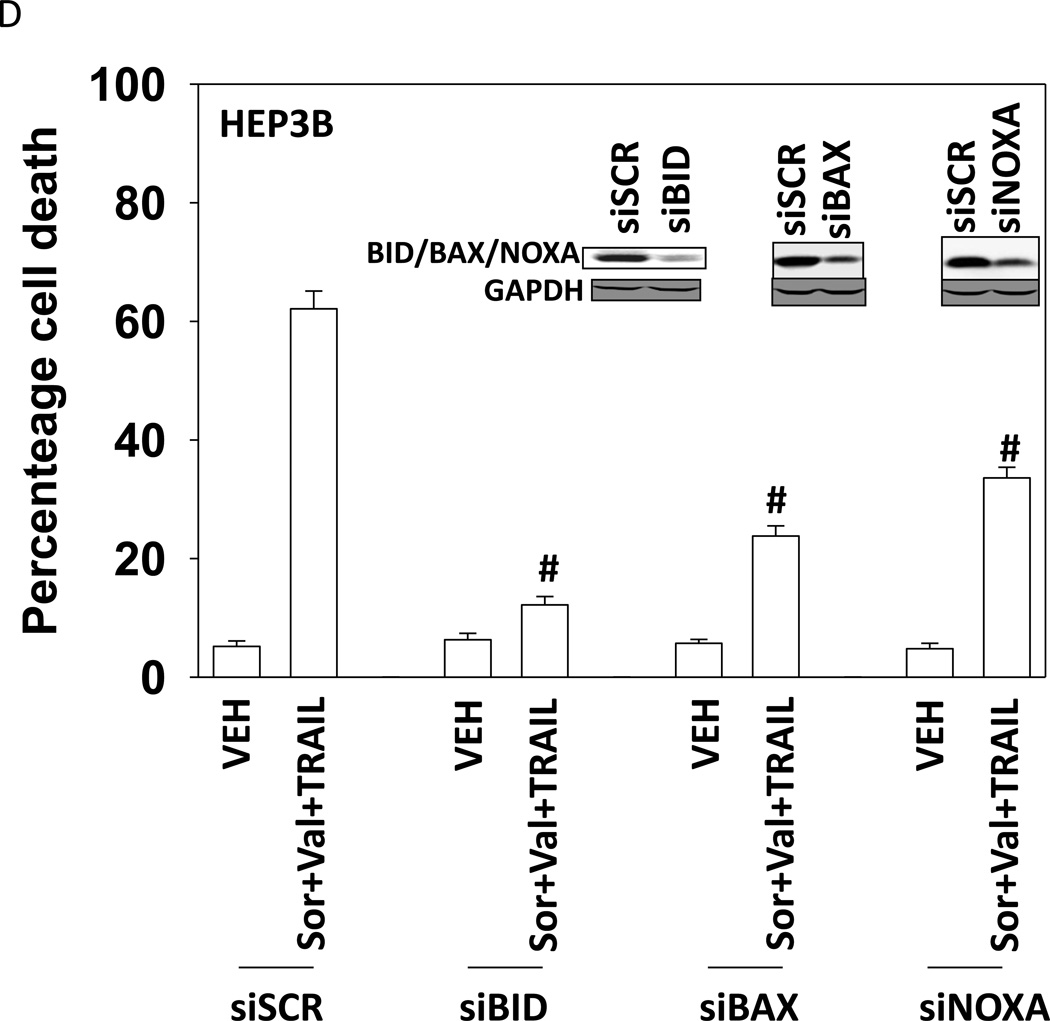
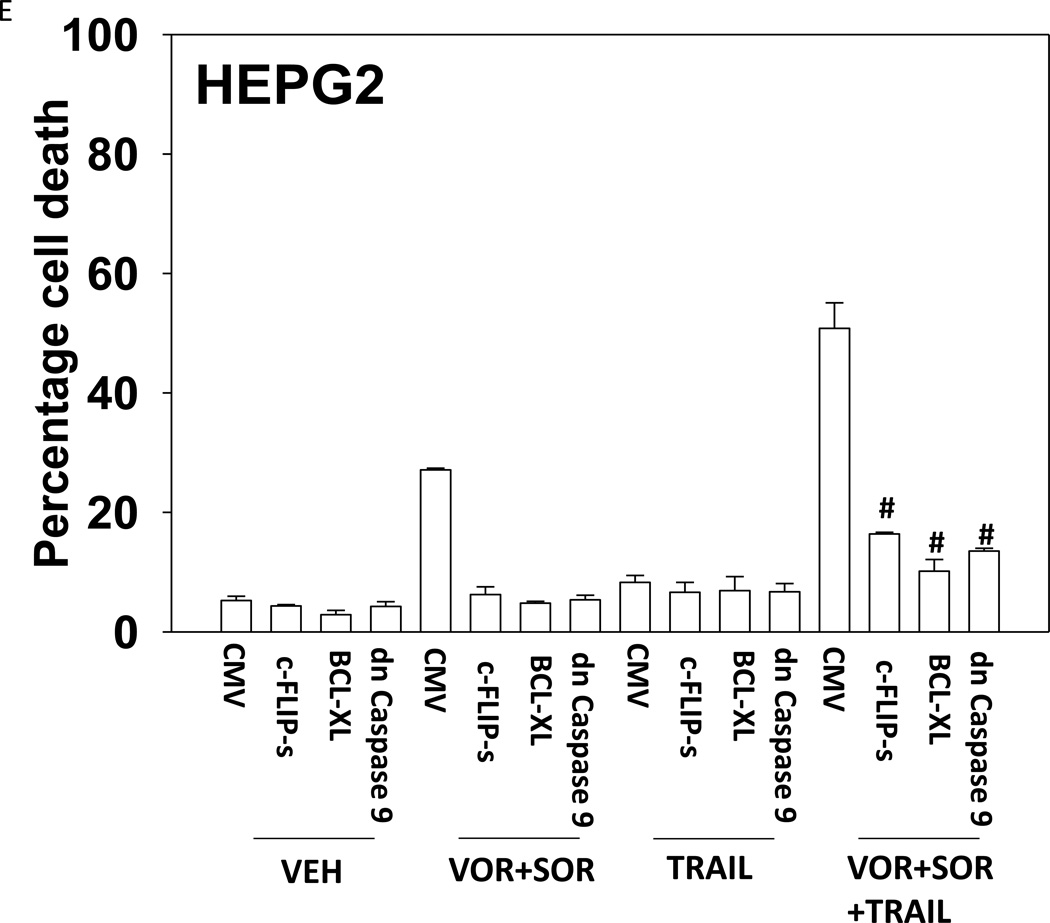
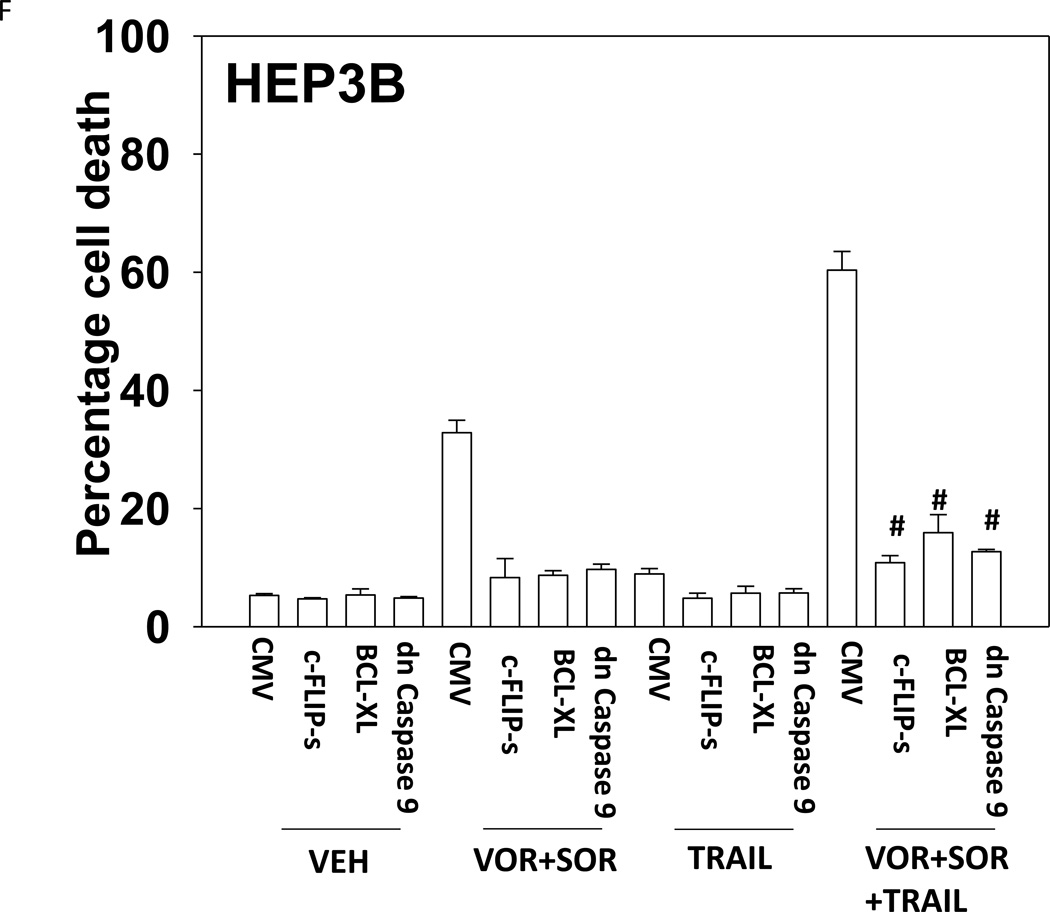
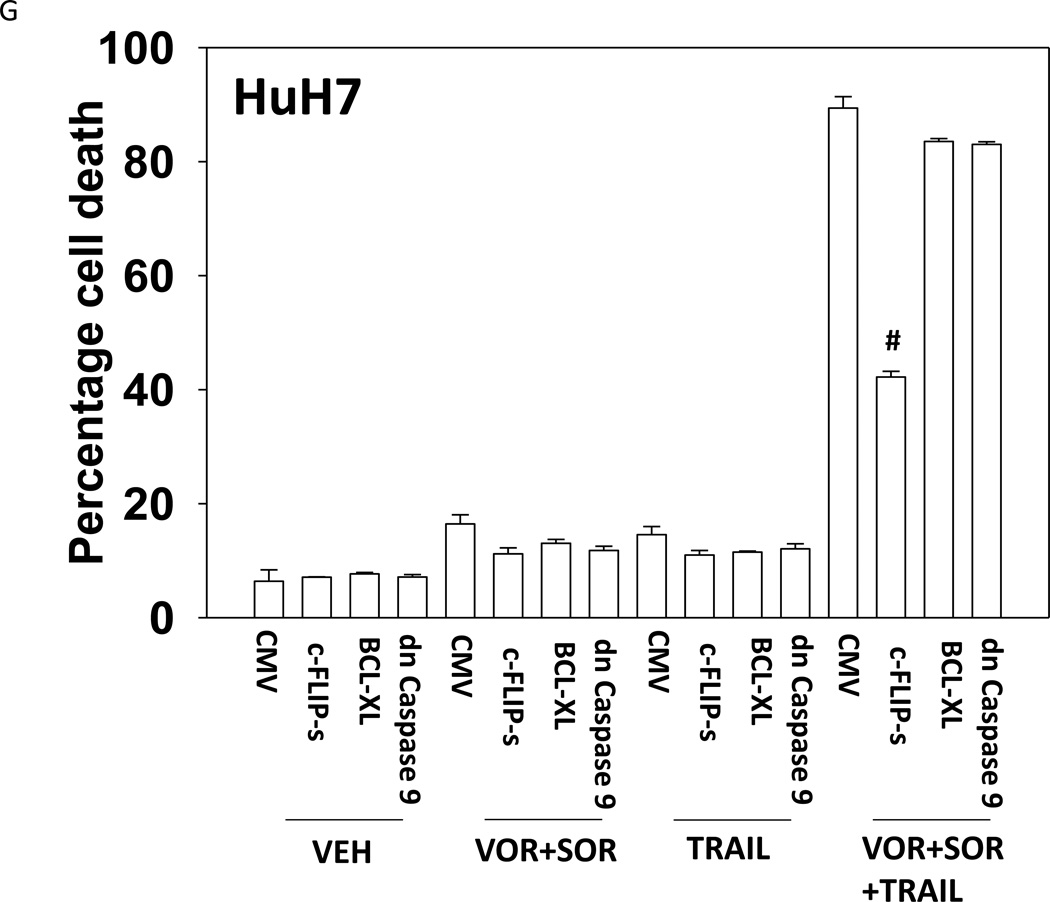
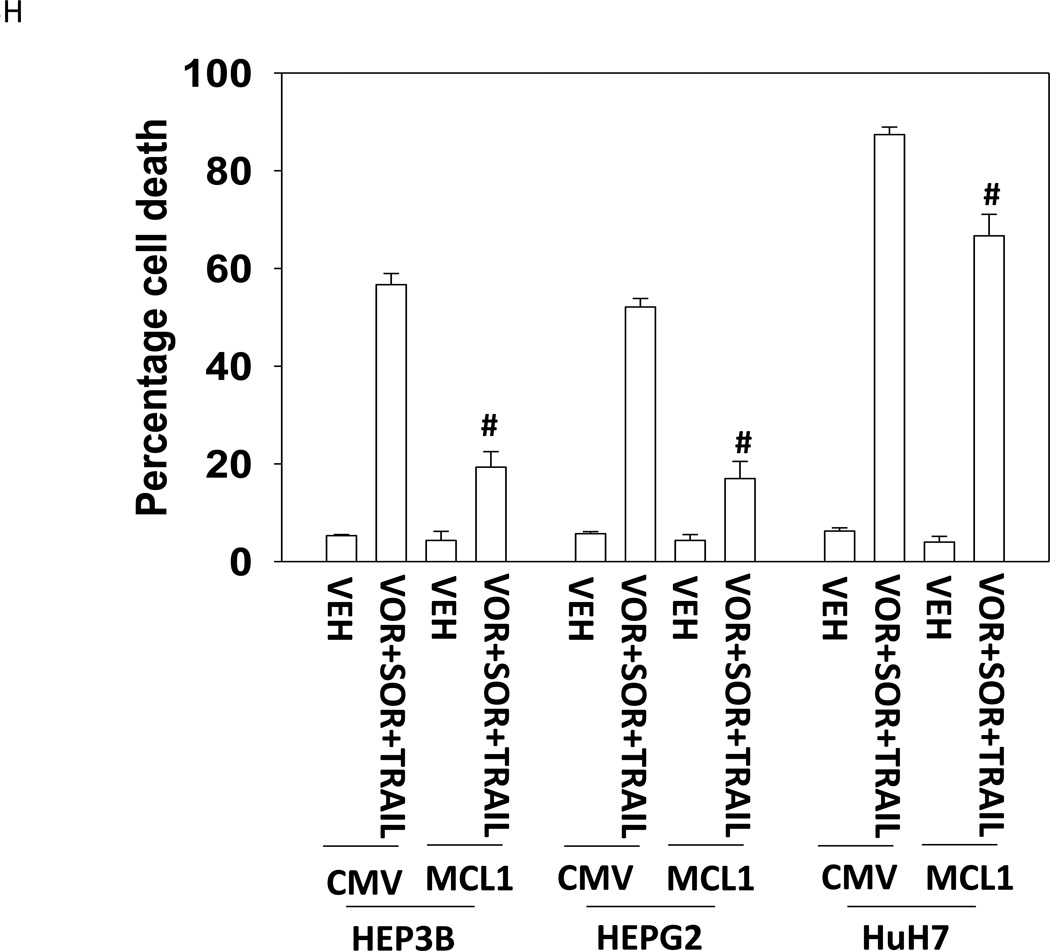
Treatment of hepatoma cells with [sorafenib + HDAC inhibitor] together with increasing doses of obatoclaxenhanced release of cytochrome c (Figure 3A). Treatment of hepatoma cells with [sorafenib + HDAC inhibitor] together with increasing doses of TRAIL enhanced cytochrome c release to a greater extent than obatoclax (Figure 3B). Knock down of BAX and NOXA suppressed killing by [sorafenib + HDAC inhibitor] plus obatoclax (Figure 3B). Knock down of BID, BAX or NOXAsuppressed killing by [sorafenib + HDAC inhibitor] plus TRAIL (Figure 3C). Knock down of BAD or BIM modestlysuppressed killing by [sorafenib + HDAC inhibitor] plus TRAIL (data not shown). In HEPG2 and HEP3B cells over-expression of c-FLIP-s (extrinsic pathway) or BCL-XL (intrinsic pathway) protected cells from drug combination toxicity (Figures 3D and 3E). Expression of dominant negative caspase 9 (intrinsic pathway) had a similar protective effect. In contrast to findings in HEPG2 and HEP3B cells, only over-expression of c-FLIP-s protected HuH7 cells (Figure 3F). Over-expression of MCL-1 significantly suppressed cell killing in HEPG2 and HEP3B cells, and protected HuH7 cells to a lesser extent (Figure 3G).
Figure 3. TRAIL enhances [sorafenib + HDACI] toxicity to a greater extent than obatoclax as judged by cytochrome c release.
(A) and (B) HuH7 cells were treated with sorafenib (Sor, 3 µM) and/or Na valproate (Val, 1 mM). In (A) cells were treated with increasing doses of TRAIL (0–5 ng/ml). Twelve h after treatment cells were isolated and the levels of cytochrome c released into the cytosolic fraction determined. In (B) cells were treated with increasing doses of obatoclax (GX, 0–50 nM). Twelve h after treatment cells were isolated and the levels of cytochrome c released into the cytosolic fraction determined. The –Fold increase in cytosolic cytochrome c levels were determined (n = 3 +/− SEM). **p < 0.05 greater fold increase release than in GX treated cells. Errors are not shown due to space restrictions.(C) HEP3B cells were transfected with scrambled siRNA (siSCR) or siRNA molecules to knock down BID, BAX or NOXA expression. Twenty four h after treatment cells were treated with vehicle (DMSO+PBS) or sorafenib (Sor, 3 µM) plus valproate (1 mM) plus TRAIL (5 ng/ml). Cells were isolated 24h after drug exposure and cell viability determined by trypan blue exclusion (n = 3 +/− SEM).#p < 0.05 value less than in siSCR cells. (D) HEP3B cells were transfected with scrambled siRNA (siSCR) or siRNA molecules to knock down BID, BAX or NOXA expression. Twenty four h after treatment cells were treated with vehicle (DMSO+PBS) or sorafenib (Sor, 3 µM) plus valproate (1 mM) plus obatoclax (50 nM). Cells were isolated 24h after drug exposure and cell viability determined by trypan blue exclusion (n = 3 +/− SEM). #p < 0.05 value less than in siSCR cells. (E) HEPG2; (F) HEP3B; (G) HuH7 cells were infected with empty vector virus Ad.cmv or viruses to express c-FLIP-s, BCL-XL or dominant negative caspase 9. Twenty four h after infection cells were treated with vehicle (DMSO) or sorafenib (Sor, 3 µM) and Vorinostat (Vor, 500 nM)and/or TRAIL (5 ng/ml). Cells were isolated 24h after drug exposure and cell viability determined by trypan blue exclusion (n = 3 +/− SEM). #p < 0.05 value less than in CMV cells. (H) Hepatoma cells were transfected with empty vector plasmid (CMV) or a plasmid to express MCL-1.Twenty four h after transfection cells were treated with vehicle (DMSO) or sorafenib (Sor, 3 µM) and Vorinostat (Vor, 500 nM)and TRAIL (5 ng/ml). Cells were isolated 24h after drug exposure and cell viability determined by trypan blue exclusion (n = 3 +/− SEM). #p < 0.05 value less than in CMV cells.
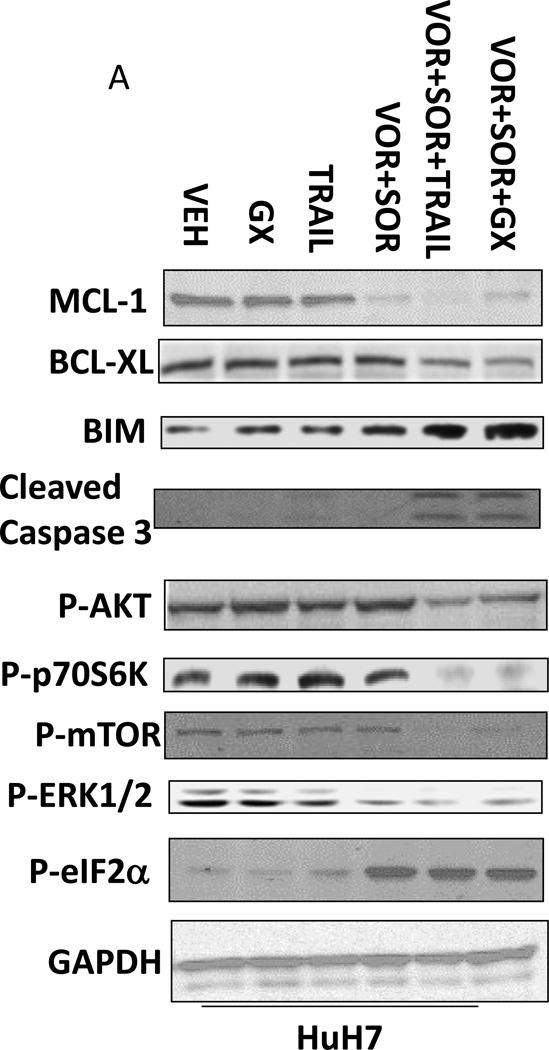
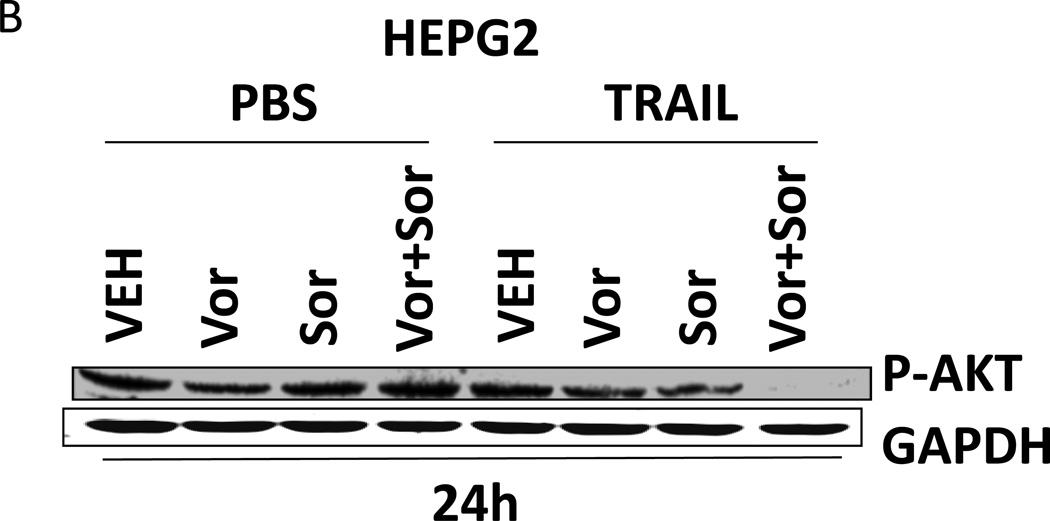
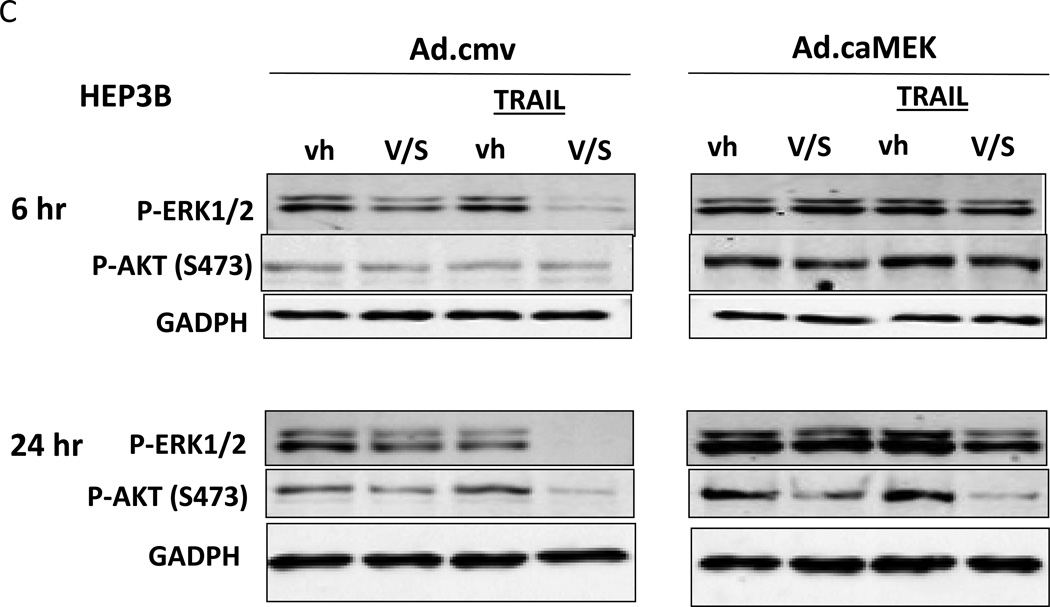
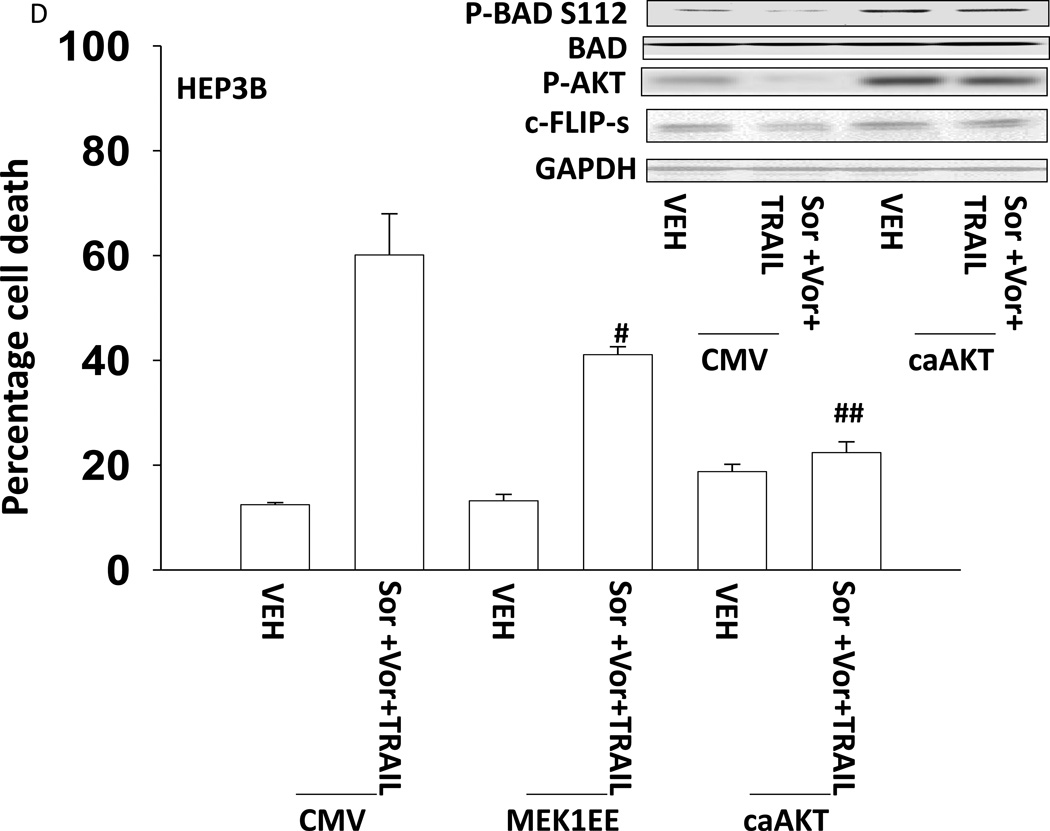
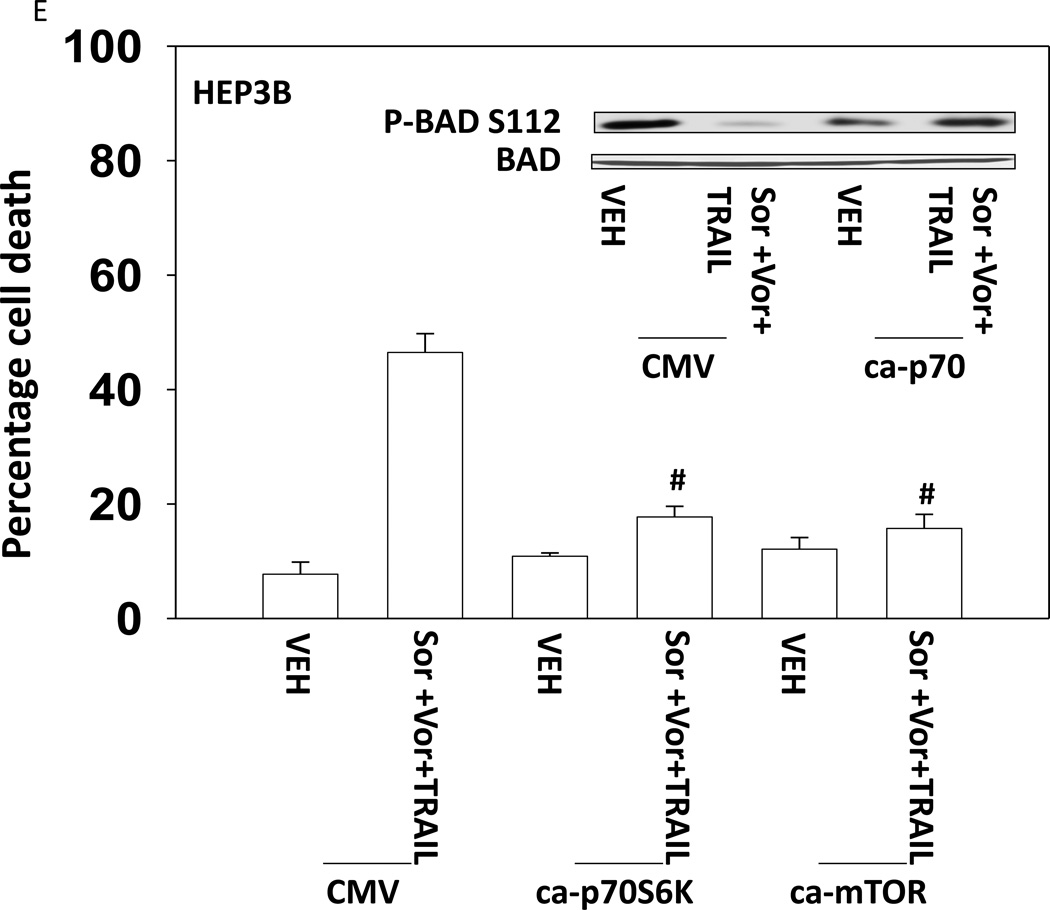
Based on the data in Figures 1–3 we explored changes in protein expression and phosphorylation in drug treated / transfected cells. In CD95 null HuH7 cells TRAIL andobatoclax, when combined with [sorafenib + vorinostat],both caused caspase 3 cleavage (Figure 4A). Drug exposure caused reduced expression of MCL-1 and to a lesser extent BCL-XL (Figure 4A). In HuH7 cells drug exposure plus TRAIL treatment selectively reduced AKT, p70S6Kand mTOR phosphorylation. Sorafenib and vorinostat exposure also modestly reduced ERK1/2 activity. Similar data with respect to P-AKT levels were obtained in HEPG2 cells (Figure 4B). Based on data in Figures 4A and 4B, we determined whether expression of activated kinase proteins altered cell survival after drug treatment. Drug treatment inhibited both ERK1/2 and AKT activity in HEP3B cells (Figure 4C). Expression of activated MEK1 restored ERK activity but not that of AKT. Expression of activated AKT, to a greater extent thanactivated MEK1, suppressed drug lethality (Figure 4D). This correlated with elevated / maintained expression of c-FLIP-s after drug treatment. Expression of activated mTOR or activated p70 S6K proteins also suppressed drug combination lethality (Figure 4E).
Figure 4. Signaling by PI3K/AKT/p70/mTOR plays a key role in cell survival after drug exposure.
(A) HuH7 cells transfected to express CD95-GFP were treated with vehicle (DMSO) or sorafenib (Sor, 3 µM) and/or Vorinostat (Vor, 500 nM) and/or TRAIL (5 ng/ml)and/or obatoclax (50 nM), as indicated. Cells were isolated 24h after drug exposure and the expression / phosphorylation of the indicated proteins determined by immunoblotting (n = 3). (B) HEPG2 cells were treated with vehicle (DMSO) or sorafenib (Sor, 3 µM) and/or Vorinostat (Vor, 500 nM) and/or TRAIL (5 ng/ml). Cells were isolated 24h after drug exposure and the expression / phosphorylation of AKT determined. (C) HEP3B cells wereinfected with either empty vector virus Ad.cmv or Ad.caMEK1 (MEK1 EE). Twenty four h after infection cells were treated with vehicle (DMSO) or sorafenib (Sor, 3 µM) and Vorinostat (Vor, 500 nM) and/or TRAIL (5 ng/ml). Cells were isolated 6h and 24h after drug exposure and the expression / phosphorylation of AKT and ERK1/2 determined. (D) HuH7 cells were infected with either empty vector virus Ad.cmv or viruses to express Ad.caAKT or Ad.caMEK1. Twenty four h after infection cells were treated with vehicle (DMSO) or sorafenib (Sor, 3 µM) and Vorinostat (Vor, 500 nM)and TRAIL (5 ng/ml). Cells were isolated 24h after drug exposure and cell viability determined by trypan blue exclusion (n = 3 +/− SEM) Upper blot: HuH7 cells were infected with either empty vector virus Ad.cmv or virus to express Ad.caAKT. Twenty four h after infection cells were treated with vehicle (DMSO) or sorafenib (Sor, 3 µM) and Vorinostat (Vor, 500 nM) and TRAIL (5 ng/ml). Cells were isolated 24h after drug exposure and immunoblotting performed to determine c-FLIP-s levels and BAD S112 phosphorylation. #p < 0.05 value less than in CMV cells; # #p < 0.05 value less than in MEK1EE cells.(E) HuH7 cells were transfected with either empty vector plasmid CMV, or with plasmids to express ca-p70 S6K or ca-mTOR. Twenty four h after transfection cells were treated with vehicle (DMSO) or sorafenib (Sor, 3 µM) and Vorinostat (Vor, 500 nM)and TRAIL (5 ng/ml). Cells were isolated 24h after drug exposure and cell viability determined by trypan blue exclusion (n = 3 +/− SEM). #p < 0.05 value less than in CMV cells.
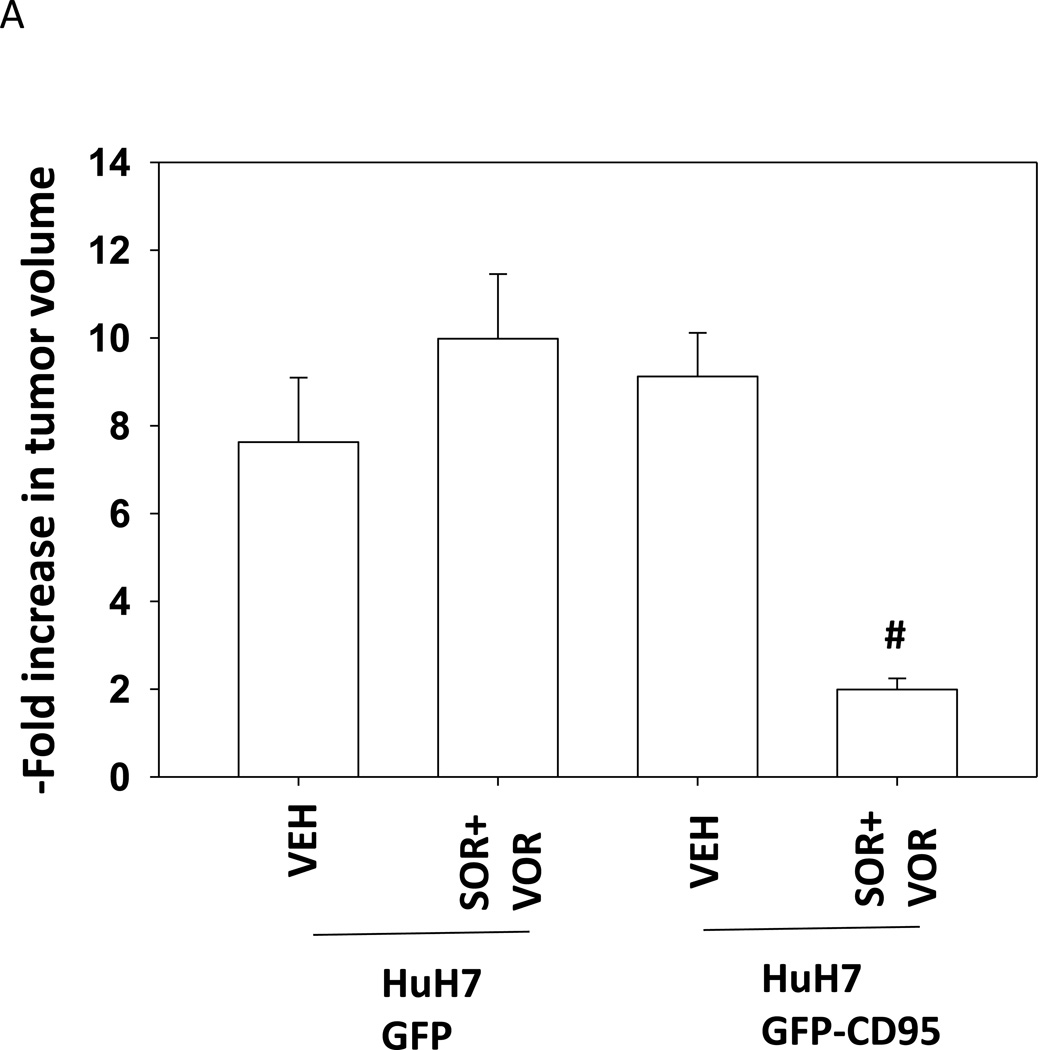
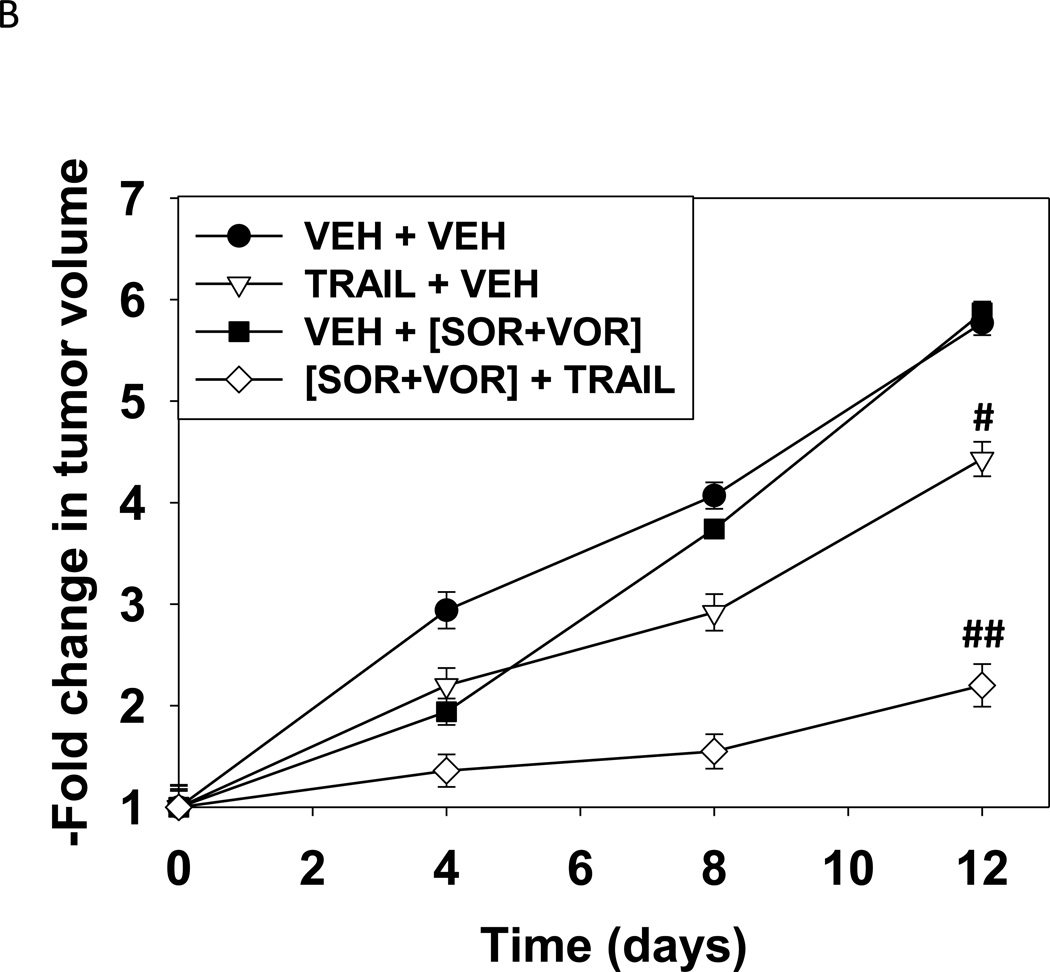
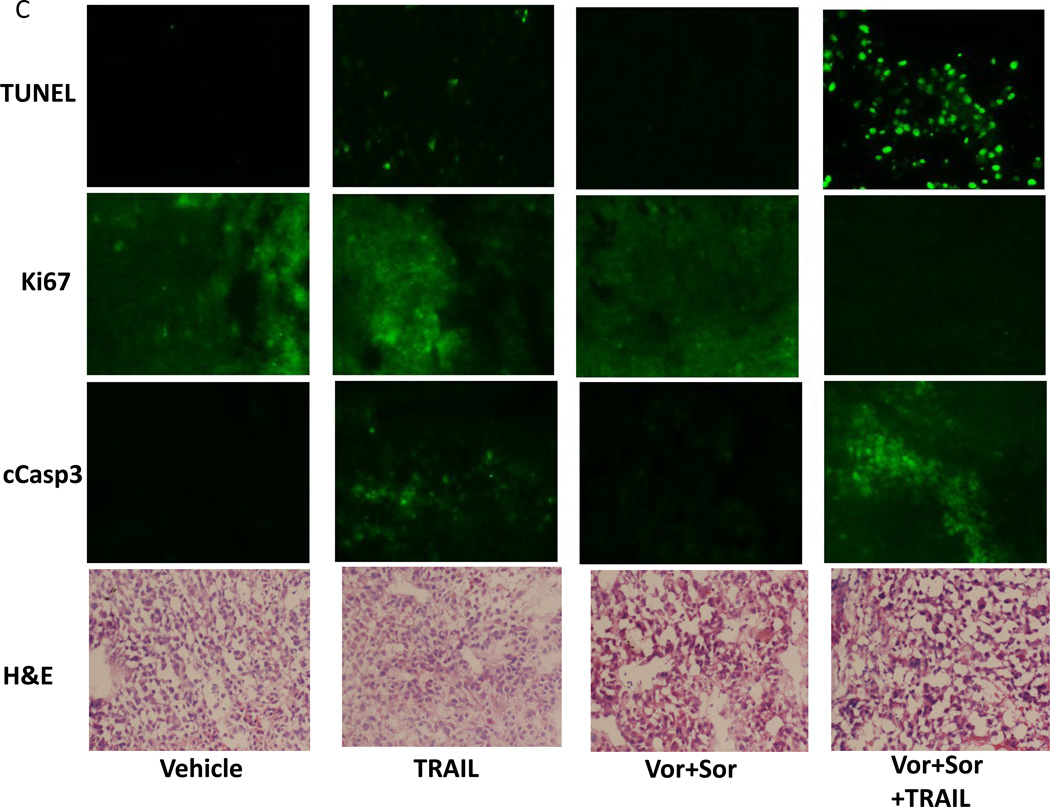
Based on our data in Figure 1 we sought to determine whether HuH7 tumors responded in vivo to sorafenib and vorinostat in a similar manner to their behavior in vitro. i.e. cell killing requiring expression of CD95. CD95 null HuH7 cells were transfected to express GFP or GFP-CD95 and cells were injected into the rear flank of athymic mice. Seven days after injection, animals were treated with vehicle control or with sorafenib and vorinostat. As was observed in vitro, in vivo expression of CD95 facilitated the anti-tumor effects of sorafenib and vorinostat treatment (Figure 5A). Based on these findings we determined whether TRAIL enhanced the lethality of sorafenib and vorinostat treatment in HuH7 cells growing in vivo. Treatment of animals with sorafenib and vorinostat had little impact on HuH7 tumor growth (Figure 5B). TRAIL treatment also only modestly reduced the tumor growth rate. Combined exposure to sorafenib, vorinostat and TRAIL significantly, however, reduced tumor growth below that of the individual agents. We examined sections of treated tumors for changes in staining for tumor apoptosis and growth. As a single agent TRAIL modestly increased staining for TUNEL (apoptosis) and cleaved caspase 3 (Figure 5C). As a single agent the combination of [sorafenib and vorinostat] decreased Ki67 staining (growth). The combination treatment of TRAIL with [sorafenib and vorinostat] resulted in a large increase in staining for TUNEL and cleaved caspase 3, and abolished Ki67 staining.
Figure 5. Expression of CD95 enhances the anti-tumor effect of sorafenib and vorinostat in vivo.
(A) HuH7 cells were transfected to express GFP or GFP-CD95. Cells (1×10⁶) were injected into the rear flank of athymic mice. Seven days after injection, prior to obvious tumor formation, animals were treated with vehicle diluent (DMSO, Cremophore) or sorafenib (25 mg/kg) and vorinostat (25 mg/kg) for 5 days. Tumors were permitted to form and 30 days after injection the volume of tumors determined (n =6 animals from 2 independent studies +/− SEM). #p < 0.05 value less than in GFP transfected cells treated with SOR+VOR. (B) HuH7 cells (1×10⁶) were injected into the rear flank of athymic mice. Tumors were permitted to form and 30 days after injection the volume of tumors determined. Initial tumor volumes for each condition were VEH+VEH (223 +/− 55 mm3); SOR+VOR+VEH (229 +/− 69 mm3); VEH+TRAIL (225 +/− 55 mm3); SOR+VOR+TRAIL (227 +/− 53 mm3). Animals were treated with vehicle diluent (DMSO, Cremophore); sorafenib (25 mg/kg) and vorinostat (25 mg/kg); TRAIL (1 mg/kg); and sorafenib and vorinostat and TRAIL for 5 days.(n =6 animals from 2 independent studies +/− SEM). #p < 0.05 value less than in vehicle treated cells; ##p < 0.05 less than TRAIL treated cells. (C) Tumors were removed, fixed and 10 µm slices obtained. Tumor sections were then blocked and subjected to immunohistochemical analysis as per the instructions of the manufacturer for each primary antibody (Ki67 and cleaved caspase-3). The tissue sections were dehydrated, cleared, and mounted with cover slips using Permount.
Discussion
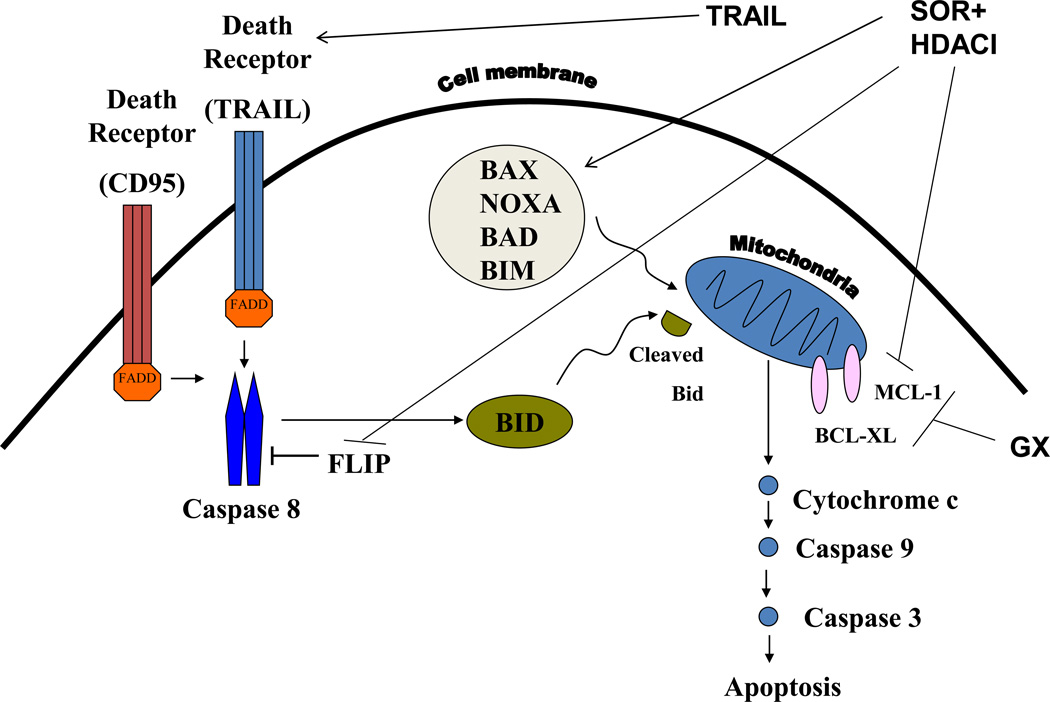
The present studies were to determine whether the toxicity of [sorafenib and HDAC inhibitor] was more efficaciously enhanced by activation of the extrinsic pathway using TRAIL or by activation of the intrinsic pathway using obatoclax. Expression of CD95 was required for [sorafenib and HDAC inhibitor] to kill tumor cells, and a CD95 protein lacking regulatory sites of tyrosine phosphorylation did not promote [sorafenib and HDAC inhibitor] killing. Our data also demonstrated that activation of the extrinsic pathway by use of TRAIL more efficaciously enhanced [sorafenib and HDAC inhibitor] toxicity than did activation of the intrinsic pathway using obatoclax. A likely reason for the difference in the potentiating effects of TRAIL and obatoclax may be that whereas TRAIL directly activates death receptors and pro-caspase 8, by its nature obatoclax only predisposes tumor cells to the noxious effects of other agents. In addition to this, sorafenib + HDAC inhibitor treatment has multiple targets; reduced expression of anti-apoptotic protein expression (c-FLIP-s, BCL-XL, MCL-1) and activation of BAX, BAD and NOXA (Figure 6). Thus [sorafenib + HDAC inhibitor] treatment facilitates TRAIL lethality by decreasing the levels of c-FLIP-s, BCL-XL, MCL-1 and activation of toxic BH3 domain proteins, whereas obatoclax can only facilitate the actions of [sorafenib + HDAC inhibitor] treatment on protective BCL-2 family proteins.
Figure 6. Molecular mechanisms by which Sorafenib, HDAC inhibitors, TRAIL and obatoclax kill hepatoma cells.
TRAIL activates the death receptors DR4 and DR5. Obatoclax (GX) inhibits the protective BCL-2 family proteins BCL-XL and MCL-1. Sorafenib + HDAC inhibitor treatment has multiple targets; reduced expression of anti-apoptotic protein expression (FLIP, BCL-XL, MCL-1) and activation of BAX, BAD, BIM and NOXA. Thus [sorafenib + HDAC inhibitor] treatment facilitates TRAIL lethality by decreasing the levels of FLIP, BCL-XL, MCL-1 and activation of toxic BH3 domain proteins, whereas obatoclax can only facilitate the actions of [sorafenib + HDAC inhibitor] treatment on protective BCL-2 family proteins.
Cells contain multiple signal transduction pathways that regulate survival and death in response to therapeutic drug exposure. Treatment of cells with [sorafenib and HDAC inhibitor] + TRAIL reduced AKT, p70 S6K and mTOR phosphorylation at regulatory sites. Thus multiple cell survival pathway activities are reduced following drug exposure. We determined that loss of ERK1/2 phosphorylation was partially involved in the toxic effect of the drugs. Expression of activated forms of AKT, p70 S6K and mTOR however largely abolished [sorafenib and HDAC inhibitors] + TRAIL lethality. The precise targets of AKT, p70 S6K and mTOR in our system are as yet largely unknown; elevated AKT activity increased expression of c-FLIP-s which would act to suppress drug-induced apoptosis through the extrinsic pathway and increased BAD S112 phosphorylation that would act to suppress drug-induced apoptosis through the intrinsic pathway.
There are two major pathways by which apoptosis can proceed: the extrinsic pathway via death receptors and the intrinsic pathway via mitochondrial dysfunction. The extrinsic pathway can either operate with caspase 8 directly cleaving and activating pro-caspase 3 (type I cells) or by cleavage of BID that causes mitochondrial dysfunction and activation of the intrinsic pathway through pro-caspase 9 (type II cells). In HEPG2 and HEP3B cells over-expression of c-FLIP-s, BCL-XL or expression of dominant negative pro-caspase 9 inhibited [sorafenib and HDAC inhibitor] + TRAIL lethality. Thus in these cells the extrinsic pathway is causing activation of the intrinsic pathway. In HuH7 cells, that lack CD95, over-expression of c-FLIP-s but not of BCL-XL protected cells. This argues that in HuH7 cells cell killing proceeds from caspase 8 to caspase 3 without intrinsic pathway involvement. In HuH7 cells drug treatment reduced the expression of MCL-1 that was in part causal in drug combination lethality. This correlated with increased endoplasmic reticulum stress / eIF2α phosphorylation. Thus both [sorafenib and HDAC inhibitor] treatment and treatment with obatoclax target MCL-1 function. Hence, loss of MCL-1 function per se does not cause tumor cell death but predisposes cells to cell death processes.
Loss of CD95 expression in colon cancer cells has been associated with advanced disease and a poorer response to therapeutic agents (e.g. Strand et al, 2004). HuH7 hepatoma cells, in contrast to HEPG2 and HEP3B hepatoma cells, lack expression of CD95 and in vitro were relatively resistant to the lethal effects of [sorafenib and HDAC inhibitor] exposure. We explored whether similar findings would be observed in vivo. Treatment of HuH7 tumors with [sorafenib and HDAC inhibitor] did not alter tumor mass when compared to vehicle control treated tumors. Expression of CD95 in HuH7 cells, growing as tumors, did not in of itself alter tumor growth. However, expression of CD95 facilitated the anti-tumor effects of [sorafenib and HDAC inhibitor] treatment. These findings would argue that the tumor cells were the primary target of [sorafenib and HDAC inhibitor] treatment rather than tumor endothelial or stromal cells.
Based on our in vitro and in vivo findings we determined whether TRAIL enhanced the lethal effects of [sorafenib and HDAC inhibitor] treatment in HuH7 tumors. As single agents neither [sorafenib and HDAC inhibitor] treatment nor exposure to TRAIL significantly altered the growth of HuH7 tumors, although there was a modest non-significant decrease in growth due to [sorafenib and HDAC inhibitor] treatment. In contrast combined exposure to [sorafenib and HDAC inhibitor] plus TRAIL significantly reduced tumor growth.
Collectively, our data demonstrate that [sorafenib and HDAC inhibitor] treatment lethality requires expression of CD95; that activation of the extrinsic pathway by TRAIL represents a more efficacious mode of enhancing the toxicity of this drug combination than does activation of the intrinsic pathway; and that these findings translate to in vivo models. The combination of sorafenib and vorinostat is presently undergoing Phase I clinical evaluation in liver cancer patients and the data in this manuscript argues that for future studies a combination of these drugs with the biologic agent TRAIL would represent a logical progression of these studies.
Supplementary Material
Acknowledgments
Support for the present study was funded from PHS grants from the National Institutes of Health [R01-CA141704, R01-CA150214, R01-DK52825]; the Department of Defense [W81XWH-10-1-0009]; the Lind-Lawrence Foundation. PD is the holder of the Universal Inc. Professorship in Signal Transduction Research.
Abbreviations
- ERK
extracellular regulated kinase
- MEK
mitogen activated extracellular regulated kinase
- PI3K
phosphatidyl inositol 3 kinase
- MAPK
mitogen activated protein kinase
- ca
constitutively active
- dn
dominant negative
- CMV
empty vector plasmid or virus
- si
small interfering
- SCR
scrambled
- IP
immunoprecipitation
- Ad
adenovirus
- TUNEL
Terminal deoxynucleotidyl transferaseUTP nick end labeling
- VEH
vehicle
- HDACI
histone deacetylase inhibitor
- SOR
sorafenib
Footnotes
There are no conflicts of interest to report.
References
- Abdulghani J, El-Deiry WS. TRAIL receptor signaling and therapeutics. Expert Opin Ther Targets. 2010;14:1091–1108. doi: 10.1517/14728222.2010.519701. [DOI] [PubMed] [Google Scholar]
- Bareford MD, Park MA, Yacoub A, Hamed HA, Tang Y, Cruickshanks N, Eulitt P, Hubbard N, Tye G, Burow ME, Fisher PB, Moran RG, Nephew KP, Grant S, Dent P. Sorafenib enhances pemetrexed cytotoxicity through an autophagy-dependent mechanism in cancer cells. Cancer Res. 2011;71:4955–4967. doi: 10.1158/0008-5472.CAN-11-0898. [DOI] [PMC free article] [PubMed] [Google Scholar]
- Chonghaile TN, Letai A. Mimicking the BH3 domain to kill cancer cells. Oncogene. 2008;27(Suppl 1):S149–S157. doi: 10.1038/onc.2009.52. [DOI] [PMC free article] [PubMed] [Google Scholar]
- Crawford N, Chacko AD, Savage KI, McCoy F, Redmond K, Longley DB, Fennell DA. Platinum resistant cancer cells conserve sensitivity to BH3 domains and obatoclax induced mitochondrial apoptosis. Apoptosis. 2011;16:311–320. doi: 10.1007/s10495-010-0561-1. [DOI] [PubMed] [Google Scholar]
- Dimberg LY, Anderson CK, Camidge R, Behbakht K, Thorburn A, Ford HL. On the TRAIL to successful cancer therapy? Predicting and counteracting resistance against TRAIL-based therapeutics. Oncogene. 2012 doi: 10.1038/onc.2012.164. [Epub ahead of print] [DOI] [PMC free article] [PubMed] [Google Scholar]
- Eberle A, Reinehr R, Becker S, Keitel V, Häussinger D. CD95 tyrosine phosphorylation is required for CD95 oligomerization. Apoptosis. 2007;12:719–729. doi: 10.1007/s10495-006-0003-2. [DOI] [PubMed] [Google Scholar]
- Fulda S, Galluzzi L, Kroemer G. Targeting mitochondria for cancer therapy. Nat Rev Drug Discov. 2010;9:447–464. doi: 10.1038/nrd3137. [DOI] [PubMed] [Google Scholar]
- Hellwig CT, Rehm M. TRAIL signaling and synergy mechanisms used in TRAIL-based combination therapies. Mol Cancer Ther. 2012;11:3–13. doi: 10.1158/1535-7163.MCT-11-0434. [DOI] [PubMed] [Google Scholar]
- Hockly E, Richon VM, Woodman B, Smith DL, Zhou X, Rosa E, Sathasivam K, Ghazi-Noori S, Mahal A, Lowden PA, Steffan JS, Marsh JL, Thompson LM, Lewis CM, Marks PA, Bates GP. Suberoylanilide hydroxamic acid, a histone deacetylase inhibitor, ameliorates motor deficits in a mouse model of Huntington's disease. Proc Natl Acad Sci U S A. 2003;100:2041–2046. doi: 10.1073/pnas.0437870100. [DOI] [PMC free article] [PubMed] [Google Scholar]
- Kim MJ, Kim DE, Jeong IG, Choi J, Jang S, Lee JH, Ro S, Hwang JJ, Kim CS. HDAC inhibitors synergize antiproliferative effect of sorafenib in renal cell carcinoma cells. Anticancer Res. 2012;32:3161–3168. [PubMed] [Google Scholar]
- Lachenmayer A, Toffanin S, Cabellos L, Alsinet C, Hoshida Y, Villanueva A, Minguez B, Tsai HW, Ward SC, Thung S, Friedman SL, Llovet JM. Combination therapy for hepatocellular carcinoma: additive preclinical efficacy of the HDAC inhibitor panobinostat with sorafenib. J Hepatol. 2012;56:1343–1350. doi: 10.1016/j.jhep.2012.01.009. [DOI] [PMC free article] [PubMed] [Google Scholar]
- Llobet D, Eritja N, Yeramian A, Pallares J, Sorolla A, Domingo M, Santacana M, Gonzalez-Tallada FJ, Matias-Guiu X, Dolcet X. The multikinase inhibitor Sorafenib induces apoptosis and sensitises endometrial cancer cells to TRAIL by different mechanisms. Eur J Cancer. 2010;46:836–850. doi: 10.1016/j.ejca.2009.12.025. [DOI] [PubMed] [Google Scholar]
- Martin AP, Park MA, Mitchell C, Walker T, Rahmani M, Thorburn A, Häussinger D, Reinehr R, Grant S, Dent P. BCL-2 family inhibitors enhance histone deacetylase inhibitor and sorafenib lethality via autophagy and overcome blockade of the extrinsic pathway to facilitate killing. Mol Pharmacol. 2009;76:329–341. doi: 10.1124/mol.109.056309. [DOI] [PMC free article] [PubMed] [Google Scholar]
- Meng XW, Lee SH, Dai H, Loegering D, Yu C, Flatten K, Schneider P, Dai NT, Kumar SK, Smith BD, Karp JE, Adjei AA, Kaufmann SH. Mcl-1 as a buffer for proapoptotic Bcl-2 family members during TRAIL-induced apoptosis: a mechanistic basis for sorafenib (Bay 43-9006)-induced TRAIL sensitization. J Biol Chem. 2007;282:29831–29846. doi: 10.1074/jbc.M706110200. [DOI] [PubMed] [Google Scholar]
- Mitchell C, Yacoub A, Hossein H, Martin AP, Bareford MD, Eulitt P, Yang C, Nephew KP, Dent P. Inhibition of MCL-1 in breast cancer cells promotes cell death in vitro and in vivo. Cancer Biol Ther. 2010;10:903–917. doi: 10.4161/cbt.10.9.13273. [DOI] [PMC free article] [PubMed] [Google Scholar]
- Park MA, Reinehr R, Häussinger D, Voelkel-Johnson C, Ogretmen B, Yacoub A, Grant S, Dent P. Sorafenib activates CD95 and promotes autophagy and cell death via Src family kinases in gastrointestinal tumor cells. Mol Cancer Ther. 2010a;9:2220–2231. doi: 10.1158/1535-7163.MCT-10-0274. [DOI] [PMC free article] [PubMed] [Google Scholar]
- Park MA, Mitchell C, Zhang G, Yacoub A, Allegood J, Häussinger D, Reinehr R, Larner A, Spiegel S, Fisher PB, Voelkel-Johnson C, Ogretmen B, Grant S, Dent P. Vorinostat and sorafenib increase CD95 activation in gastrointestinal tumor cells through a Ca(2+)-de novo ceramide-PP2A-reactive oxygen species-dependent signaling pathway. Cancer Res. 2010b;70:6313–6324. doi: 10.1158/0008-5472.CAN-10-0999. [DOI] [PMC free article] [PubMed] [Google Scholar]
- Porta C, Paglino C, Imarisio I, Ferraris E. Sorafenib tosylate in advanced kidney cancer: past, present and future. Anticancer Drugs. 2009;20:409–415. doi: 10.1097/CAD.0b013e32831fb500. [DOI] [PubMed] [Google Scholar]
- Reikvam H, Ersvaer E, Bruserud O. Heat shock protein 90 - a potential target in the treatment of human acute myelogenous leukemia. Curr Cancer Drug Targets. 2009;9:761–776. doi: 10.2174/156800909789271486. [DOI] [PubMed] [Google Scholar]
- Reinehr R, Becker S, Eberle A, Grether-Beck S, Häussinger D. Involvement of NADPH oxidase isoforms and Src family kinases in CD95-dependent hepatocyte apoptosis. J Biol Chem. 2005;280:27179–27194. doi: 10.1074/jbc.M414361200. [DOI] [PubMed] [Google Scholar]
- Reinehr R, Becker S, Wettstein M, Häussinger D. Involvement of the Src family kinase yes in bile salt-induced apoptosis. Gastroenterology. 2004;127:1540–1557. doi: 10.1053/j.gastro.2004.08.056. [DOI] [PubMed] [Google Scholar]
- Ricci MS, Kim SH, Ogi K, Plastaras JP, Ling J, Wang W, Jin Z, Liu YY, Dicker DT, Chiao PJ, Flaherty KT, Smith CD, El-Deiry WS. Reduction of TRAIL-induced Mcl-1 and cIAP2 by c-Myc or sorafenib sensitizes resistant human cancer cells to TRAIL-induced death. Cancer Cell. 2007;12:66–80. doi: 10.1016/j.ccr.2007.05.006. [DOI] [PubMed] [Google Scholar]
- Smoot RL, Blechacz BR, Werneburg NW, Bronk SF, Sinicrope FA, Sirica AE, Gores GJ. A Bax-mediated mechanism for obatoclax-induced apoptosis of cholangiocarcinoma cells. Cancer Res. 2010;70:1960–1969. doi: 10.1158/0008-5472.CAN-09-3535. [DOI] [PMC free article] [PubMed] [Google Scholar]
- Strand S, Vollmer P, van den Abeelen L, Gottfried D, Alla V, Heid H, Kuball J, Theobald M, Galle PR, Strand D. Cleavage of CD95 by matrix metalloproteinase-7 induces apoptosis resistance in tumour cells. Oncogene. 2004;23:3732–3736. doi: 10.1038/sj.onc.1207387. [DOI] [PubMed] [Google Scholar]
- Venugopal B, Evans TR. Developing histone deacetylase inhibitors as anti-cancer therapeutics. Curr Med Chem. 2011;18:1658–1671. doi: 10.2174/092986711795471284. [DOI] [PubMed] [Google Scholar]
- Walker T, Mitchell C, Park MA, Yacoub A, Graf M, Rahmani M, Houghton PJ, Voelkel-Johnson C, Grant S, Dent P. Sorafenib and vorinostat kill colon cancer cells by CD95-dependent and -independent mechanisms. Mol Pharmacol. 2009;76:342–355. doi: 10.1124/mol.109.056523. [DOI] [PMC free article] [PubMed] [Google Scholar]
- Wilhelm SM, Adnane L, Newell P, Villanueva A, Llovet JM, Lynch M. Preclinical overview of sorafenib, a multikinase inhibitor that targets both Raf and VEGF and PDGF receptor tyrosine kinase signaling. Mol Cancer Ther. 2008;7:3129–3140. doi: 10.1158/1535-7163.MCT-08-0013. [DOI] [PMC free article] [PubMed] [Google Scholar]
- Zhang G, Park MA, Mitchell C, Hamed H, Rahmani M, Martin AP, Curiel DT, Yacoub A, Graf M, Lee R, Roberts JD, Fisher PB, Grant S, Dent P. Vorinostat and sorafenib synergistically kill tumor cells via FLIP suppression and CD95 activation. Clin Cancer Res. 2008;14:5385–5399. doi: 10.1158/1078-0432.CCR-08-0469. [DOI] [PMC free article] [PubMed] [Google Scholar]
Associated Data
This section collects any data citations, data availability statements, or supplementary materials included in this article.


