The charophyte green alga Penium margaritaceum possesses an experimentally tractable pectin domain in its cell wall that offers insight into wall assembly and polar growth in plants.
Abstract
The pectin polymer homogalacturonan (HG) is a major component of land plant cell walls and is especially abundant in the middle lamella. Current models suggest that HG is deposited into the wall as a highly methylesterified polymer, demethylesterified by pectin methylesterase enzymes and cross-linked by calcium ions to form a gel. However, this idea is based largely on indirect evidence and in vitro studies. We took advantage of the wall architecture of the unicellular alga Penium margaritaceum, which forms an elaborate calcium cross-linked HG-rich lattice on its cell surface, to test this model and other aspects of pectin dynamics. Studies of live cells and microscopic imaging of wall domains confirmed that the degree of methylesterification and sufficient levels of calcium are critical for lattice formation in vivo. Pectinase treatments of live cells and immunological studies suggested the presence of another class of pectin polymer, rhamnogalacturonan I, and indicated its colocalization and structural association with HG. Carbohydrate microarray analysis of the walls of P. margaritaceum, Physcomitrella patens, and Arabidopsis (Arabidopsis thaliana) further suggested the conservation of pectin organization and interpolymer associations in the walls of green plants. The individual constituent HG polymers also have a similar size and branched structure to those of embryophytes. The HG-rich lattice of P. margaritaceum, a member of the charophyte green algae, the immediate ancestors of land plants, was shown to be important for cell adhesion. Therefore, the calcium-HG gel at the cell surface may represent an early evolutionary innovation that paved the way for an adhesive middle lamella in multicellular land plants.
Contemporary models of plant primary cell wall architecture (Doblin et al., 2010; Cosgrove and Jarvis, 2012) describe composites of semicrystalline cellulose microfibrils that are closely associated with a range of cross-linking glycans, or hemicelluloses. This load-bearing network is embedded in a hydrated gel matrix comprising several subclasses of pectic polysaccharides, including homogalacturonan (HG), rhamnogalacturonan I (RGI) and rhamnogalacturonan II, and xylogalacturonans (Caffall and Mohnen, 2009). Although considerable progress has been made in elucidating the structures and biosynthetic pathways of the predominant wall polymers, very little is known about how complex and heterogenous architectures are assembled in muro from these polymeric building blocks (Cosgrove and Jarvis, 2012).
Arguably the best resolved example of postsecretion assembly and modification is that of HG, a polymer of α-1,4-linked d-galacturonic acid (GalA) residues that may be methylesterified at the C-6 carboxyl or acetylated at the O-2 or O-3 position. Current models suggest that HG is synthesized in a highly methylesterified form but undergoes demethylesterification in the apoplast by pectin methylesterase (PME) enzymes (Wolf et al., 2009). Stretches of consecutive nonmethylesterified GalA residues are then cross-linked with calcium (Ca2+) as egg-box complexes, resulting in the formation of a hydrated HG-Ca2+ gel (Liners et al., 1992; Morris et al., 2009), which can account for up to 70% of wall pectin (Jarvis and Apperley, 1995). This gelation has profound effects on wall properties, including porosity, pH, and other physicochemical attributes (Willats et al., 2001), and has been associated with wall stiffening and a reduction in cell wall creep (Caffall and Mohnen, 2009; Wolf and Greiner, 2012). Accordingly, immunological analyses suggest that the distribution of demethylesterified HG epitopes correlates with areas of low wall extensibility (Wolf et al., 2012). However, other data suggest that the demethylesterification of HG results in wall loosening and an increase in tissue elasticity (Peaucelle et al., 2011). This discrepancy may relate to the nature of the cell or tissue type and the biomechanics of individual cell walls in the context of complex tissues (Wolf et al., 2012).
There is also evidence that HG plays a role in cell adhesion (Bouton et al., 2002). HG with a low degree of methylesterification or nonesterified HG is most abundant in the middle lamella, particularly at intercellular junctions and the corners of intercellular spaces (Bush et al., 2001; Parker et al., 2001; McCartney and Knox, 2002; Guillemin et al., 2005), which are regions where intercellular biomechanical forces are greatest (Jarvis et al., 2003). Ca2+ is also present at high levels in the middle lamella, especially at the same load-bearing junction areas (Rihouey et al., 1995; Huxham et al., 1999; Bush et al., 2001), giving rise to the idea that Ca2+-HG gelation is biomechanically important. Furthermore, treatment of plant tissues with Ca2+-chelating agents, such as cyclohexanediamine-N,N,N′,N′-tetraacetic acid (CDTA), can induce partial or extensive cell separation (Ng et al., 2000; McCartney and Knox, 2002), although this is apparently variable between tissues (Fry, 1988). Additionally, it has been observed that the Colorless nonripening mutant of tomato (Solanum lycopersicum), which has a defect in cell adhesion, has a reduction in Ca2+-complexed HG as well as lower levels of wall arabinan (Thompson et al., 1999; Orfila et al., 2001). However, other reports indicate that Ca2+ cross-linked HG may not always contribute to cell-cell adhesion or that both Ca2+ and HG-ester linkages play a role (Jarvis et al., 2003; Marry et al., 2006; Xu et al., 2011), so this remains controversial.
An excellent organism in which to evaluate the mechanistic model of HG gel formation, and to elucidate pectin dynamics in vivo, is the desmid algal species Penium margaritaceum, which forms an intricate HG-rich lattice on its surface (Domozych et al., 2007b). This provides an opportunity for direct, nondestructive visualization and experimental manipulation of the polymer-polymer interactions and wall assembly associated with this specific pectin domain in living cells. Moreover, P. margaritaceum is a member of the charophyte green algae (Leliaert et al., 2012), the immediate ancestors of land plants, which are of particular interest for the study of the evolutionary origins of land plant walls. Indeed, a survey of a broad range of extant charophyte species suggested that the development of walls with land plant-like compositions took place during diversification within the charophytes and was likely a preadaptation to terrestrial colonization (Sørensen et al., 2011).
The evolutionary origins of a pectin network involving Ca2+ cross-linking of demethylesterified HG may be traced back to the charophytes, and specifically to the Zygnematales, one of the six clades within the charophytes. The cell walls of Netrium species, which occupy an intermediate position between the basal saccoderm and the later diverging placoderm desmids within the Zygnematalean lineage, appear to have both low and high degrees of esterification (DE) HG and Ca2+ cross-linked HG, based on immunolabeling with monoclonal antibodies (mAbs) raised to land plant pectins (Eder and Lütz-Meindl, 2010). Similar analyses of the placoderm desmid Micrasterias spp. also revealed patterns suggesting pectin demethylesterification (Lütz-Meindl and Brosch-Salomon, 2000; Eder and Lütz-Meindl, 2008). Furthermore, Micrasterias spp. cells incubated in medium containing PME exhibited inhibited growth and cell deformation, and a PME-like enzyme activity was detected in Micrasterias spp. cultures. Such reports hint that mechanisms for the assembly of Ca2+ cross-linked HG may be similar in the Zygnematales and embryophytes. However, as with land plants, evidence supporting this model of Ca2+ cross-linked HG formation is largely indirect.
The goals of this study were, first, to take advantage of P. margaritaceum wall architecture to test the model of pectin domain deposition and, in particular, HG aggregation. Second, we wanted to determine whether the HG lattice is structurally and functionally analogous to the HG-rich middle lamella of land plants and, as such, might represent an evolutionarily significant adaptation for land colonization. We generated a high-resolution profile of pectin dynamics, fine structure, and relationships with wall architecture by employing a range of biochemical and microscopic techniques, immunological studies of living cells and cell wall sections, and carbohydrate microarray profiling.
RESULTS
P. margaritaceum Cell Wall Architecture and Sites of Cell Wall Deposition
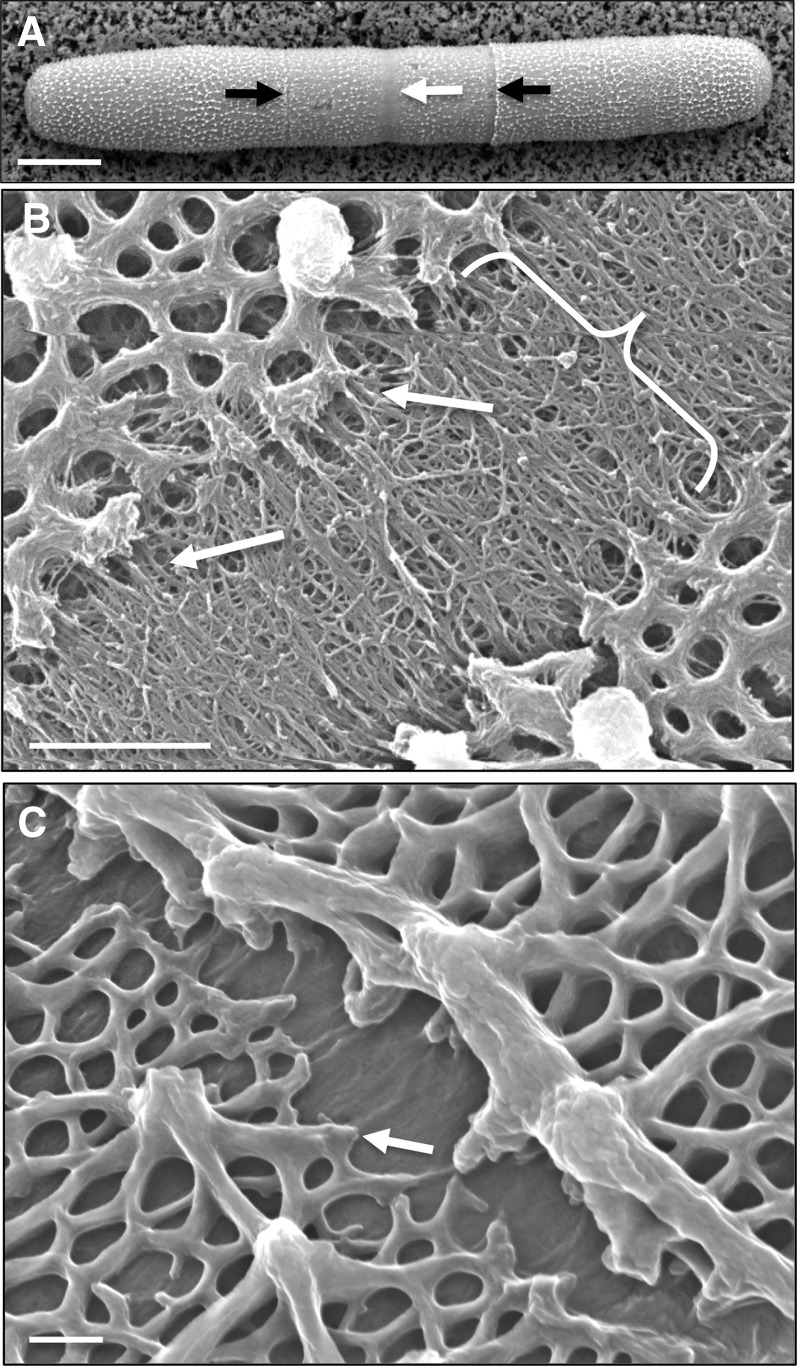
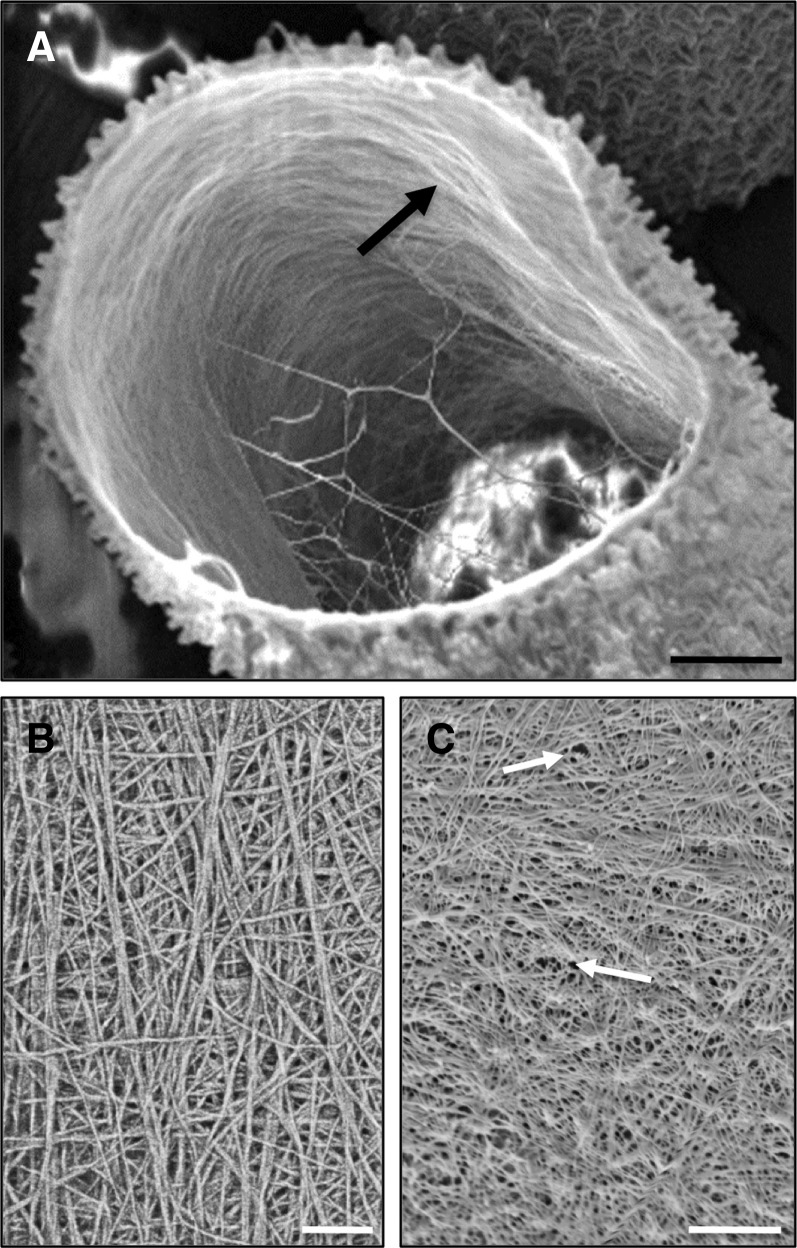
P. margaritaceum is a cylindrical unicell, consisting of two semicells attached at a central isthmus zone (Fig. 1A), which is the site of active wall expansion during cell growth and division (Domozych et al., 2009). This simple morphology and associated morphogenesis program allow for convenient imaging of P. margaritaceum cell wall architecture that, in this study, was assessed using variable pressure scanning electron microscopy (VPSEM), field emission scanning electron microscopy (FESEM), and transmission electron microscopy (TEM). These technologies provide highly resolved images that significantly refine our understanding of the P. margaritaceum cell wall. The outer cell wall surface is covered with a complex lattice-like network that can be extracted with the Ca2+ chelator CDTA and that is primarily composed of HG (Domozych et al., 2007b). This lattice is interrupted at the isthmus zone (Fig. 1, A and B) and at narrower, lateral bands that are found in variable numbers in each semicell (Fig. 1, A and C). FESEM imaging showed that the HG lattice adjacent to the lateral bands consists of projections that arise from the underlying wall, and there was no evidence of fracturing, suggesting that they are not simply ruptures caused by mechanical stress. The isthmus zone is characterized by numerous HG fibrils that merge with the outer wall lattice along the isthmus edges (Fig. 1B); however, such fibrils are absent in the lateral bands (Fig. 1C), indicating that pectin deposition occurs primarily at the isthmus. TEM imaging of the cell wall highlighted three layers: (1) an outer layer (OL) that contains the HG-rich lattice; (2) an inner layer (IL) consisting of cellulose (Domozych et al., 2011); and (3) an interfacing medial layer (ML) where components of the OL embed in the IL (Fig. 2A). An extracellular polymeric substance (EPS) coats the outer face of the OL. When P. margaritaceum cells were briefly treated with CDTA (50 mm, 4 h), the OL was shown to consist of numerous fibrils that are closely packed to form the lattice (Fig. 2B). FESEM imaging also revealed that the surface pectin lattice is embedded in an underlying wall layer of cellulose microfibrils (Domozych et al., 2007b) that are predominantly orientated perpendicular to the long axis of the cell on the innermost wall layer (Fig. 3A). In contrast, mature wall zones have a cross-meshed organization of fibrils (Fig. 3B) punctuated with numerous pores (Fig. 3C).
Figure 1.
P. margaritaceum cell wall surface topology. A, VPSEM image of a P. margaritaceum cell showing the lattice of projections made of Ca2+-complexed HG on the outer surface. The central isthmus zone (white arrow) and secondary lateral bands (black arrows) are indicated. B, FESEM image showing the isthmus zone (bracketed). Arrows highlight examples of fibrils emerging from the isthmus and fusing with the adjacent lattice. C, FESEM image of a lateral band. The arrow indicates the globular edge of the HG-rich lattice with no adjacent fibrils. Bars = 12 µm (A), 1.5 µm (B), and 150 nm (C).
Figure 2.
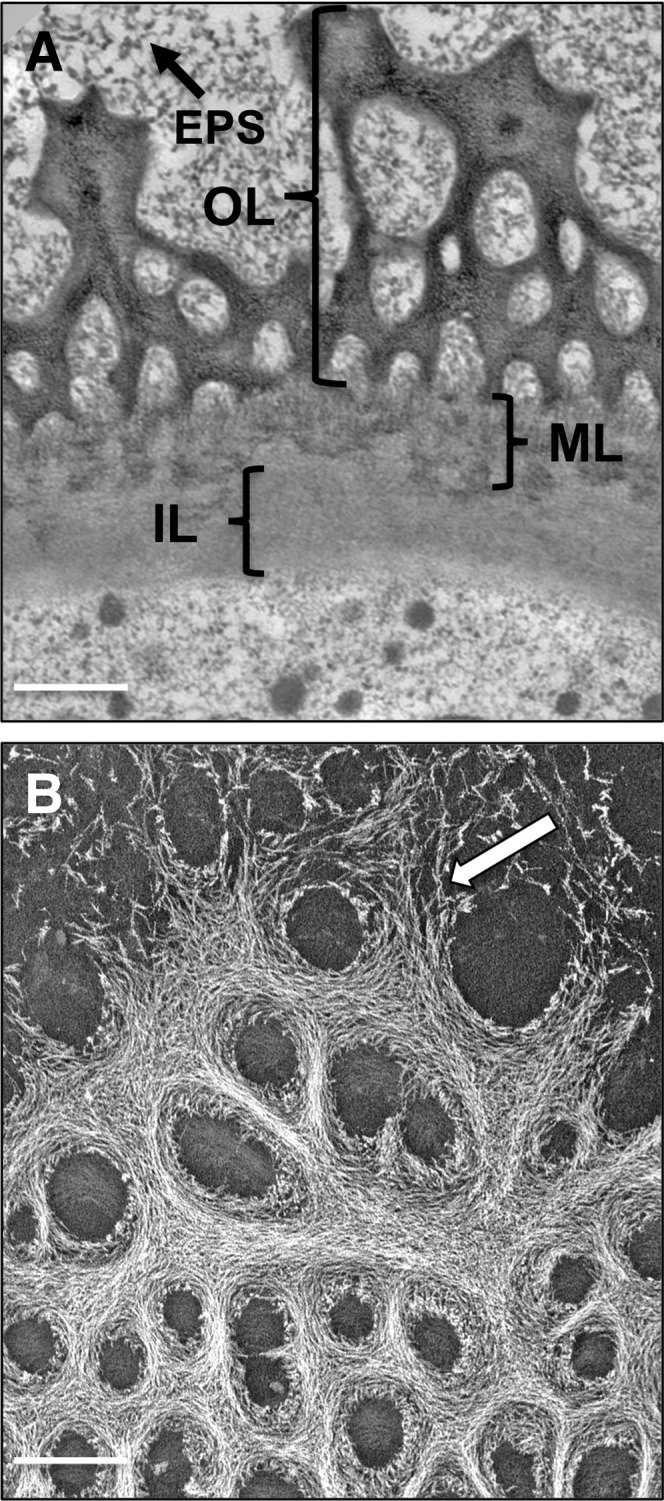
P. margaritaceum cell wall ultrastructure. A, Layers of the P. margaritaceum cell wall (TEM image): the OL consists of the HG-rich lattice, and the ML anchors the OL to the IL. The EPS is present outside the OL. B, The outer lattice of the cell wall after mild treatment with CDTA (50 mm, 4 h). This layer consists of aggregates of tightly packed fibrils (arrow) that form the lattice. The image was made with dark-field TEM. Bars = 250 nm (A) and 175 nm (B).
Figure 3.
The inner cellulosic layer of P. margaritaceum. A, Fractured cell showing microfibrils on the innermost layer that are mostly aligned perpendicular to the long axis of the cell. B, Network of cellulose microfibrils showing considerable crosshatching. C, Pores distributed throughout the inner wall layer (arrows). All images were made with FESEM. Bars = 2.8 µm (A), 100 nm (B), and 120 nm (C).
Localization of Pectin Domains within the Mature Wall and Isthmus Zone
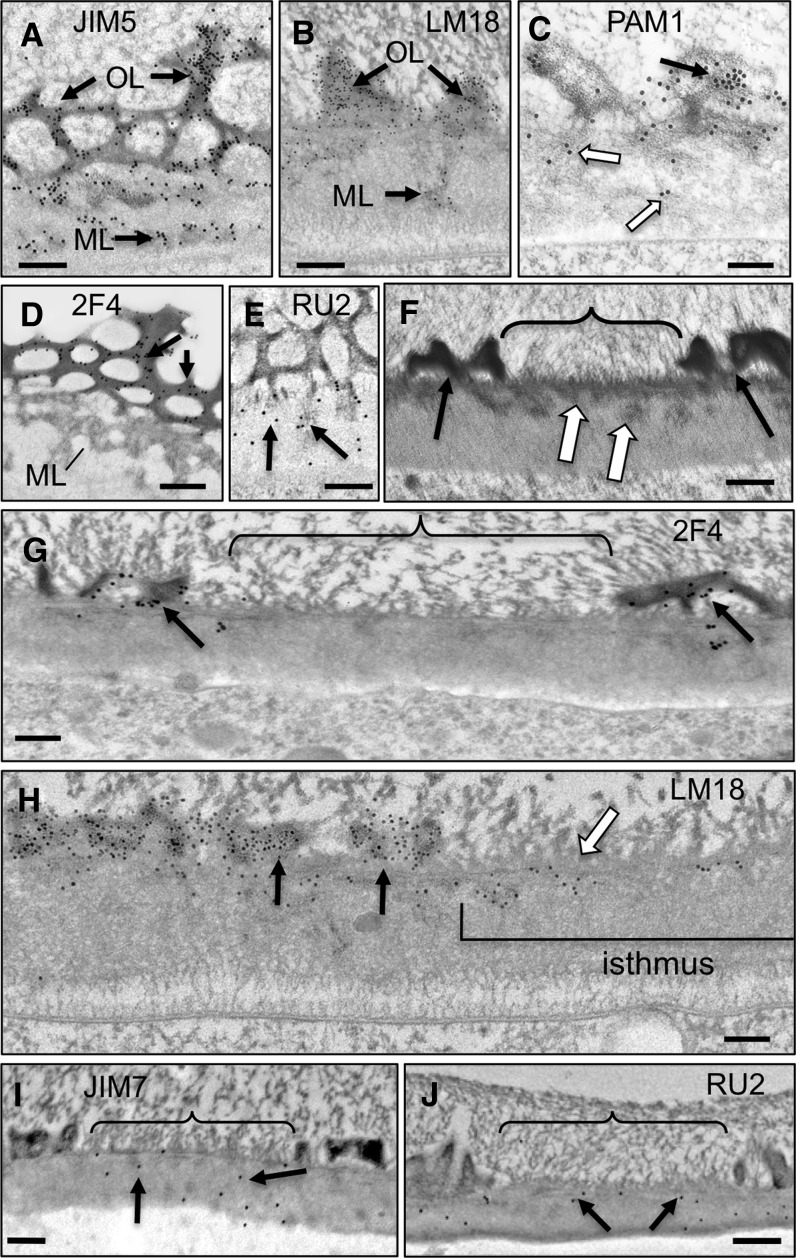
Immunogold labeling using an expanded set of mAbs that recognize different pectin epitopes and TEM imaging were employed to generate a more detailed spatial map of pectin distribution and dynamics than we have described previously (Domozych et al., 2007b, 2009). The mAb JIM5, which recognizes HG with a relatively low degree of methylesterification (Clausen et al., 2003), labeled both the OL lattice and ML (Fig. 4A). LM18, a more recently developed mAb with affinity toward HG with stretches of nonmethylesterified HG (Verhertbruggen et al., 2009), yielded an almost identical labeling pattern (Fig. 4B) to that of JIM5. This was also the case with PAM1 (Fig. 4C), an antibody that labels HG with large contiguous stretches of nonmethylesterified GalA (Manfield et al., 2005). The mAb 2F4, which recognizes Ca2+-complexed HG (Liners et al., 1989), labeled the OL but not the ML (Fig. 4D), while the mAb INRA-RU2, which binds to the RGI backbone (Ralet et al., 2010), only labeled the ML (Fig. 4E). Based on these labeling results, we subsequently used JIM5 or LM18 as a general marker for HG of the OL lattice and 2F4 to specifically label Ca2+-complexed HG during the various experimental treatments reported here.
Figure 4.
Immunogold localization of pectin epitopes in the mature wall and isthmus zone. A, JIM5 labeling of the OL and ML. B, LM18 labeling of the OL and ML. C, PAM1 labeling of the OL (black arrow) and ML (white arrows). D, 2F4 labeling of the OL (arrows) but not the ML. E, INRA-RU2 labeling of the ML (arrows). F, Cross section of the isthmus zone (bracket) showing ML aggregates embedded in the IL that traverse the wall and an absence of the OL (white arrows). G, 2F4 labels the OL (arrows) but is absent in the isthmus (bracket). H, LM18 labeling of the OL and IL of preexisting wall (black arrows) and the outer part of the isthmus wall (white arrow). I, JIM7 labeling (arrows) of the isthmus wall (bracket). J, INRA-RU2 labeling (arrows) of the isthmus wall (bracket). All images were made with TEM. Bars = 250 nm (A), 200 nm (B, I, and J), 150 nm (C), 175 nm (D), 110 nm (E), 225 nm (F and G), and 100 nm (H).
The cell wall of the isthmus is distinct from the rest of the P. margaritaceum wall in that there is an approximately 1-µm region that is devoid of the OL lattice (Fig. 4F). This zone corresponds to the region where new wall is deposited (Fig. 1B). Labeling of the isthmus zone and adjacent mature wall with 2F4 showed binding to the OL in the mature wall as before but not the isthmus zone (Fig. 4G). LM18 labeled both the outer lattice of the mature wall zone and the ML zone of the isthmus (Fig. 4H). This pattern was diametrically opposite to that seen with JIM7, an mAb that recognizes highly methylesterified HG (Clausen et al., 2003), which only labeled the isthmus zone (Fig. 4I). The INRA-RU2 mAb labeled the ML of the isthmus as well as the mature wall outside the isthmus region (Fig. 4J). Taken together, these distribution patterns suggest considerable spatial heterogeneity within the wall superstructure and a precisely coordinated mechanism of wall deposition and postsecretion modification of the constituent pectin polymers.
Effects of Experimental Treatments on Wall Expansion
The symmetrical cylindrical shape of a P. margaritaceum cell allows for quantitative determination of the cell wall surface area. Cells that are first live labeled with an mAb that binds to the OL HG can be returned to culture and, after a prescribed period of time, examined for new wall zones marked by nonlabeled zones (Domozych et al., 2011). New wall surface area can then be compared with total cell surface area to yield the percentage of surface area covered by newly deposited wall. In this study, we measured cells incubated with various experimental agents (Table I). While growth increment levels were generally similar, there were subtle differences under certain experimental conditions. First, after 48 h of growth, approximately half of the cell surface was covered by new wall in control, arabinase-treated, and varying Ca2+ concentration incubations. Second, when cells were incubated with PME, a notable decrease in wall expansion was observed (e.g. approximately 16%). This result agrees with a previous report that exogenous PME inhibited the growth of the desmid Micrasterias spp. (Eder and Lütz-Meindl, 2008). Likewise, there was a smaller but notable decrease in the expansion of P. margaritaceum cells incubated with a low DE pectin fraction, P16 (DE = 16%; Limberg et al., 2000). Third, when cells were incubated with pectate lyase (PL) or a relatively highly methylesterified (DE = 70%) pectin fraction, P70 (Limberg et al., 2000), a discernible increase in expansion was observed.
Table I. Percentage of the cell surface (as surface area) covered by new HG.
JIM5-labeled cells were incubated for 48 h in the conditions listed. After this time, nonlabeled areas (the zones of newly deposited HG) in the wall were measured, surface areas were determined (Domozych et al., 2011), and percentage values were calculated per whole cell surface area. At least three independent sets of 100 cells per treatment were calculated and averaged.
| Treatment | Percentage Surface Area of New Wall per Cell |
|---|---|
| Control (250 µm CaCl2) | 48.2 ± 2.5 |
| 10× Ca2+ (2.5 mm CaCl2) | 51.3 ± 2.7 |
| One-tenth Ca2+ (25 µm CaCl2) | 52.9 ± 3.5 |
| 3 units mL−1 PL | 63.8 ± 3.0 |
| 250 µg mL−1 PME | 32.0 ± 3.2 |
| 1 unit of arabinase | 55.1 ± 3.2 |
| P16 100 µg mL−1 | 42.5 ± 2.6 |
| P70 100 µg mL−1 | 60.4 ± 3.0 |
Effects of Pectin-Modifying Enzymes on Lattice Formation
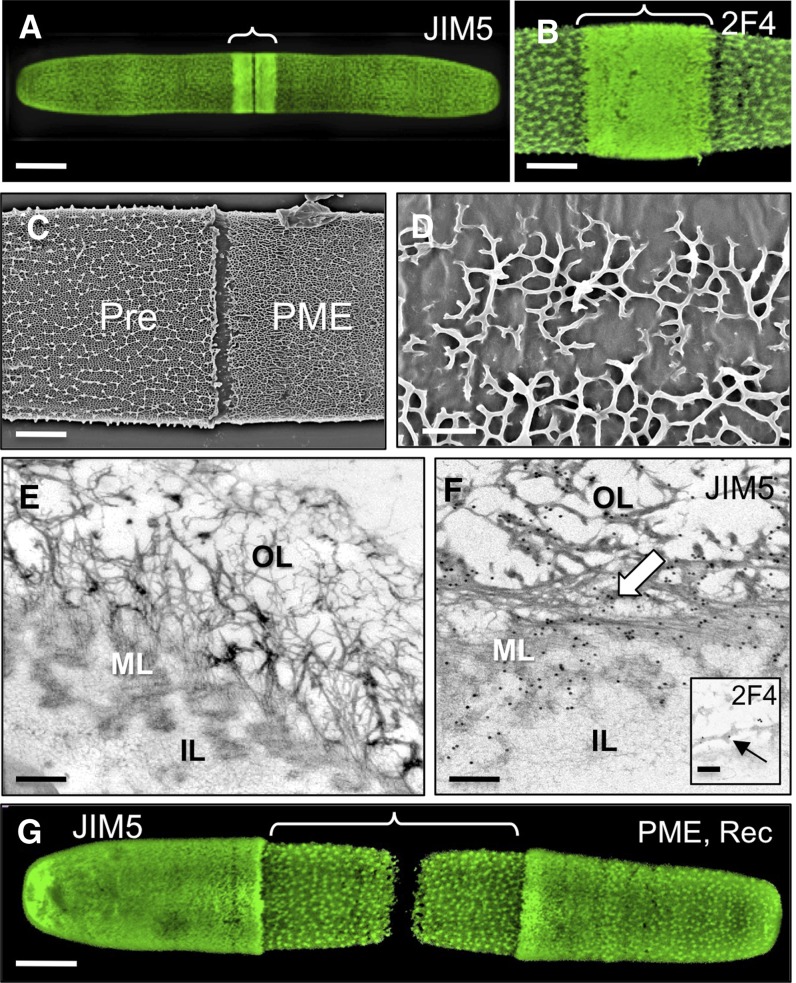
The immunological analysis shown in Figure 4 suggested that HG is secreted at the isthmus zone in a highly methylesterified form and is then demethylesterified prior to the formation of the HG lattice at the cell surface. To test the dependence of lattice formation on HG with the appropriate degree of methylesterification, cell cultures were incubated with exogenous PME for 8 h. This resulted in a dramatic change in lattice structure, as shown by live cell labeling of the cell surface with JIM5, which revealed a region of densely packed punctae in the newly synthesized wall rather than the normal lattice (Fig. 5A). An identical pattern was seen when treated cells were labeled with 2F4 (Fig. 5B). FESEM imaging highlighted notable changes to the OL (Fig. 5C), including small and incomplete stretches of interconnected HG projections (Fig. 5D). TEM analysis of the altered wall region further confirmed the disappearance of the compact OL lattice; instead, the surface consisted of thin intertwined fibrils (Fig. 5E). No structural alterations to the ML or IL were observed. The OL fibers and the ML of the PME-treated cells were still labeled with JIM5 (Fig. 5F), while 2F4 labeled just the OL fibrils (Fig. 5F). In all experiments, the preexisting cell wall was not affected by the PME treatment. When the treated cell cultures were washed to remove the PME and then grown in normal medium, the typical lattice reformed within a few hours, initiating at the isthmus (Fig. 5G). This enzyme treatment and recovery pulse-chase experiment suggested that while HG production and secretion are not affected by PME action, lattice formation and integrity require the presence of HG with an appropriate DE.
Figure 5.
The effect of PME treatment on the pectin network. A, Confocal image of a post-PME-treated cell labeled with JIM5 showing the altered lattice structure around the isthmus (bracket). B, Post-PME-treated cell labeled with 2F4 showing a similar pattern (bracket) to that of JIM5 labeling. C, FESEM image of a cell surface with contrasting topology of the preexisting wall (Pre) and after PME treatment (PME). D, Higher magnification FESEM image of an abnormal HG-rich lattice after PME incubation. E, TEM image of the altered wall of a cell treated with PME for 12 h. The OL no longer has the HG-rich lattice, while the IL and ML appear unchanged. F, JIM5 immunogold labeling after treatment with PME for 12 h. The inset shows 2F4 labeling of the OL. G, JIM5 labeling after PME treatment followed by recovery (Rec) in fresh WHM. The area of newly synthesized HG-rich lattice is bracketed. Bars = 15 μm (A), 5 μm (B), 4 µm (C), 400 nm (D), 120 nm (E), 100 nm (F), 200 nm (inset in F), and 6 μm (G).
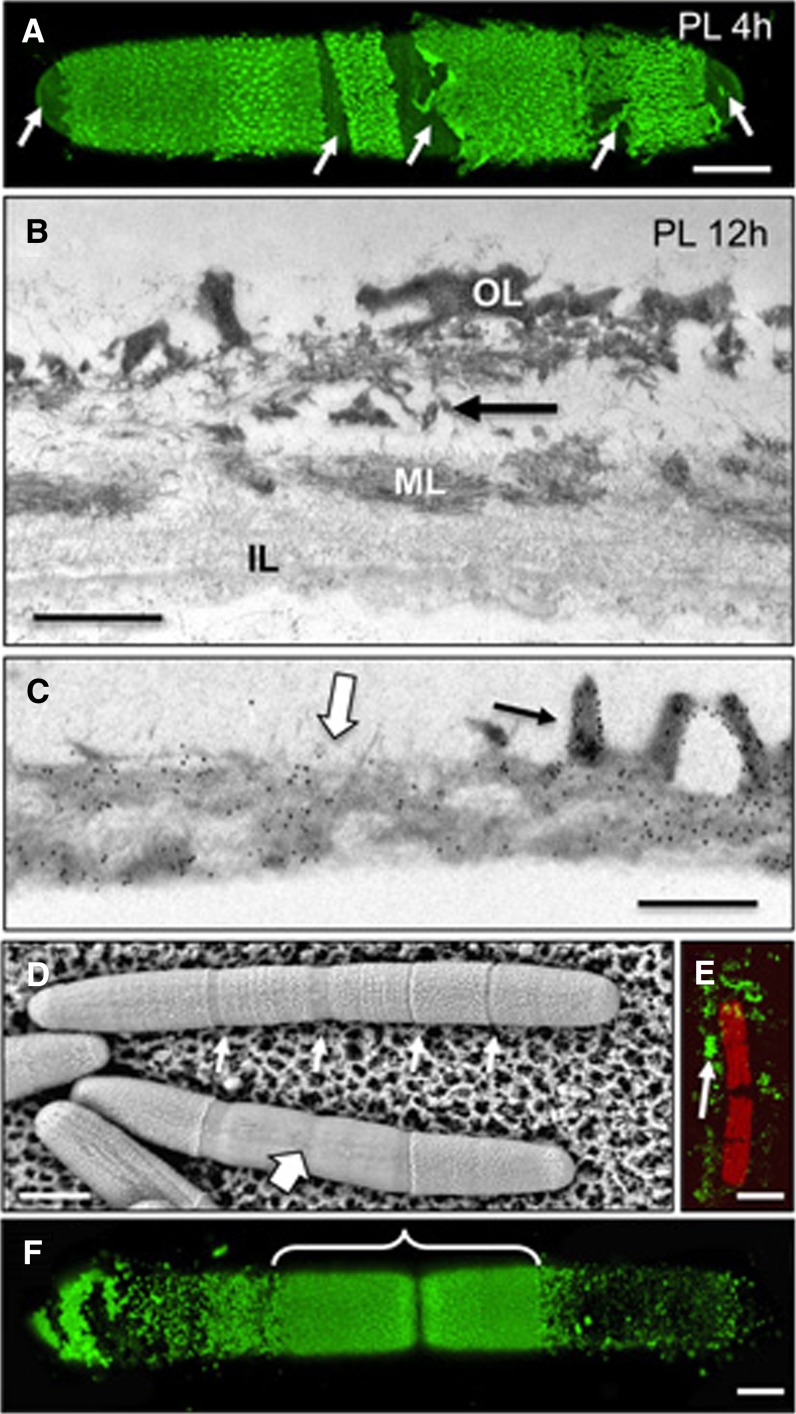
Similarly, cell cultures were incubated with PL, which catalyzes the eliminative cleavage of demethylesterified HG. After 4 to 6 h of PL treatment, the OL showed substantial disintegration at particular zones (Fig. 6A). TEM analysis of the PL-treated cells provided evidence of OL peeling away from the wall, leaving the ML and IL unaffected (Fig. 6B). This was further highlighted by JIM5 immunogold labeling, where the ML still retained label (Fig. 6C). VPSEM analysis of PL-treated cells showed that removal of the OL began at lattice-free zones of the wall, specifically the isthmus and lateral bands (Fig. 6D; see also Fig. 6A). After 36 h of PL incubation, the entire OL was virtually removed from the cell (Fig. 6E); however, the cylindrical shape of the cell was retained. After washing PL-treated cells and returning them to normal culture medium, a new lattice formed within 8 h, initiating at the isthmus (Fig. 6F). These results demonstrated that the OL lattice is not necessary for shape maintenance.
Figure 6.
Effects of PL on lattice formation. A, Confocal image of a cell incubated with PL for 4 h and then labeled with JIM5. Arrows indicate areas of wall digestion. B, TEM image of the cell wall showing the degradation of the OL at its intersection with the ML (arrow). C, JIM5 immunogold labeling of the interface zone of a PL-digested wall and an undigested wall of a cell treated for 12 h. The OL (black arrow) of the undigested zone and the ML of both digested and undigested zones (white arrow) are labeled. D, VPSEM image of PL-treated cells. Initial digestion of the lattice occurs at lattice-free zones of the cell such as the isthmus and lateral bands (small arrows). Further digestion removes large segments of the outer lattice (large arrow). E, JIM5-labeled cell after 36 h of PL digestion. Only remnants of the lattice remain (arrow). F, JIM5 labeling after the cell is allowed to recover for 8 h after 24 h of PL treatment. The area of new lattice formation at the isthmus is bracketed. Bars = 5 µm (A and F), 500 nm (B), 550 nm (C), 16 µm (D), and 25 µm (E).
Formation of the HG-Rich Lattice Is Sensitive to Ca2+ Levels
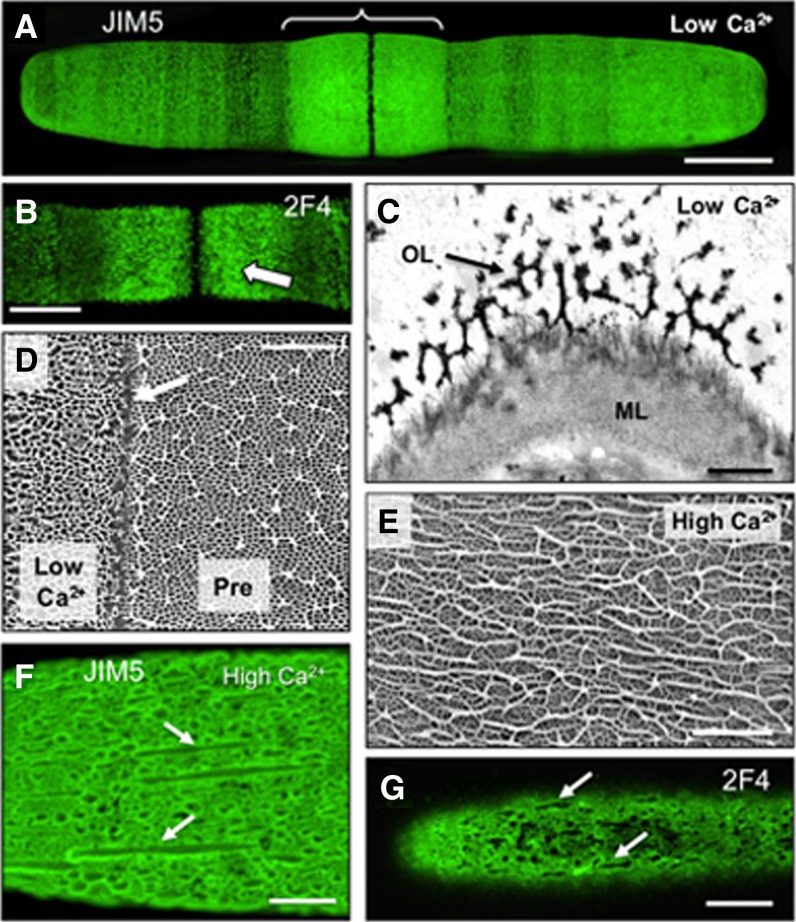
Given the proposed profound importance of Ca2+ in the rheological properties of pectinaceous cell wall matrices, and specifically on HG gelation, we investigated whether the concentration of Ca2+ in the culture medium affects HG-rich lattice formation. Cells grown in the presence of 25 µm CaCl2 (one-tenth the normal level) exhibited swelling adjacent to the isthmus zone, an area corresponding to the newly formed wall (Fig. 7A). Both JIM5 and 2F4 immunofluorescence labeling showed a dense and somewhat less intense aggregation of punctae instead of the typical lattice, which first appeared at the isthmus and was then displaced outward during cell expansion (Fig. 7, A and B). Older zones of the wall appeared unaltered by the reduced Ca2+ treatment (Supplemental Fig. S1A). When cells were returned to growth medium with normal levels of Ca2+ (250 µm CaCl2) for 6 h, the typical lattice formed in the newly synthesized wall, again starting at the isthmus (Supplemental Fig. S1B). In low-Ca2+ conditions, the OL lattice appeared incomplete when imaged both with TEM (Fig. 7C) and VPSEM (Fig. 7D). Furthermore, in immunogold labeling studies, the walls were only weakly labeled with either JIM5 (Supplemental Fig. S1C) or 2F4 (Supplemental Fig. S1D), suggesting that HG or HG-Ca2+ levels, respectively, were substantially reduced.
Figure 7.
Effects of Ca2+ on HG-rich lattice architecture. A, Confocal image of a JIM5-labeled cell grown in a low-Ca2+ medium. The swollen zone around the isthmus is bracketed. B, 2F4 labeling of a cell grown in low Ca2+. C, TEM image of the thin, irregular lattice (arrow) in the OL deposited under low-Ca2+ conditions (ML). D, FESEM image showing abnormal OL deposited under low-Ca2+ conditions (left) and the preexisting lattice (Pre; right) deposited under normal conditions. The arrow indicates the boundary between the two. E, Elongated ridges in the OL lattice deposited under high-Ca2+ conditions (FESEM). F, JIM5-labeled cell grown in high-Ca2+ medium. Elongated ridges are indicated with arrows. G, 2F4-labeled cell grown under high-Ca2+ conditions showing elongated ridges of the OL (arrows). Bars = 17 µm (A), 12 µm (B), 500 nm (C), 4 µm (D), 1.5 µm (E), 6 µm (F), and 10 µm (G).
In contrast, when cells were grown in a culture medium with 10 times the normal level of Ca2+ (2.5 mm CaCl2), the lattice projections showed an irregular distribution (Fig. 7E) and consisted of long aggregates, or ridges, of thick fibers that labeled with both JIM5 and 2F4 (Fig. 7, F and G). TEM imaging of these altered walls show that the OL lattice projections fused to form elongated projections (Supplemental Fig. S1E) that also labeled with JIM5 and 2F4. Upon returning to normal medium conditions, the typical lattice reformed, initiating at the isthmus (Supplemental Fig. S1F). It is important to note that, in all experiments with varying Ca2+ concentrations, this cation is also important for many other cellular processes/structures, which could have been affected. However, the distinct alteration to the lattice observed in live cells under varying Ca2+ concentrations and the rapid gelling of extracted P. margaritaceum HG in the presence of Ca2+ strongly suggest that the availability of this cation influences cell wall structure.
The Structures of Individual P. margaritaceum HG Polymers Are Similar to Those of Land Plants
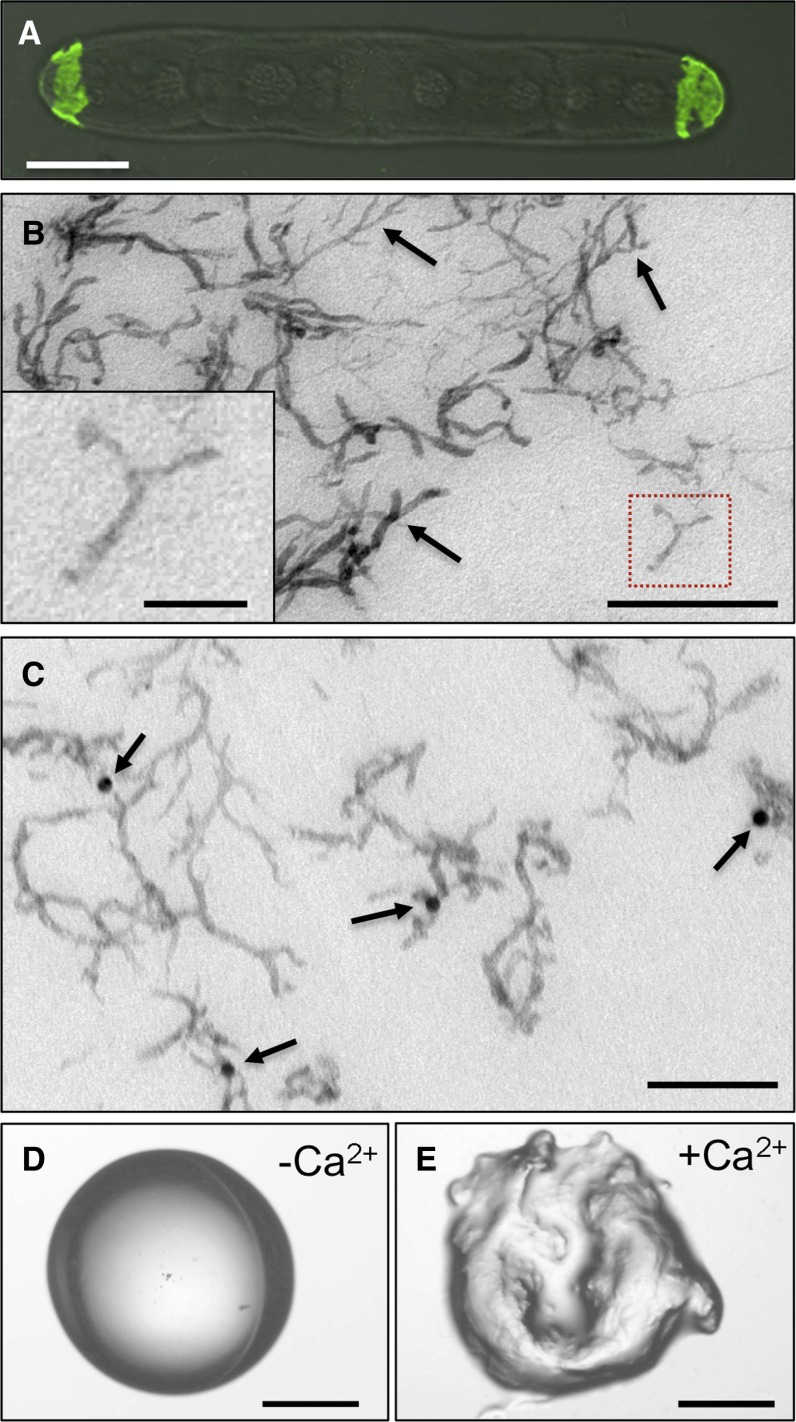
In addition to the mechanism of HG assembly into the large macrostructures of the lattice, an important question is the nature of the fine structure of the HG building blocks and whether they are similar to those reported for the CDTA-extracted HG of land plants (Morris et al., 2009). Treatment of live cells with CDTA resulted in the loss of JIM5 binding, except at the cell poles (Fig. 8A), which provided further evidence for the central role of Ca2+ in stabilizing the HG-rich lattice, but also yielded an HG fraction for structural analysis using high-resolution TEM. We developed a protocol that allowed the visualization of individual dispersed polymers with a low degree of aggregation. The polymers collectively have a relatively uniform structure in the form of elongated fibers, approximately 100 to 200 nm in length, and most had one or two branches per chain (Fig. 8B). Immunolabeling with JIM5 confirmed that the polymers corresponded to HG (Fig. 8C) and that the addition of Ca2+ to the extract caused their rapid gelation (Fig. 8, D and E). Gelation also occurred when the CDTA extract was mixed with salts of other cations (Supplemental Fig. S2).
Figure 8.
High-resolution imaging of CDTA-extracted P. margaritaceum HG polymers and their gelation by Ca2+. A, Confocal image of a JIM5-labeled cell incubated for 2 h with CDTA. B, TEM image of CDTA-extracted pectin. Arrows indicate branched structures. The inset shows a magnification of the red boxed area. C, Immunogold labeling of CDTA-extracted pectin with JIM5 (arrows). D, Light microscope image of a 5 mg mL−1 solution of P. margaritaceum CDTA extract. E, Light microscope image of the gel formed after mixing the P. margaritaceum CDTA extract with an equal volume of 50 mm CaCl2. Bars = 15 µm (A), 200 nm (B), 50 nm (inset in B), 160 nm (C), and 2 mm (D and E).
Effects of Exogenous Pectins with Varying DE on Lattice Formation
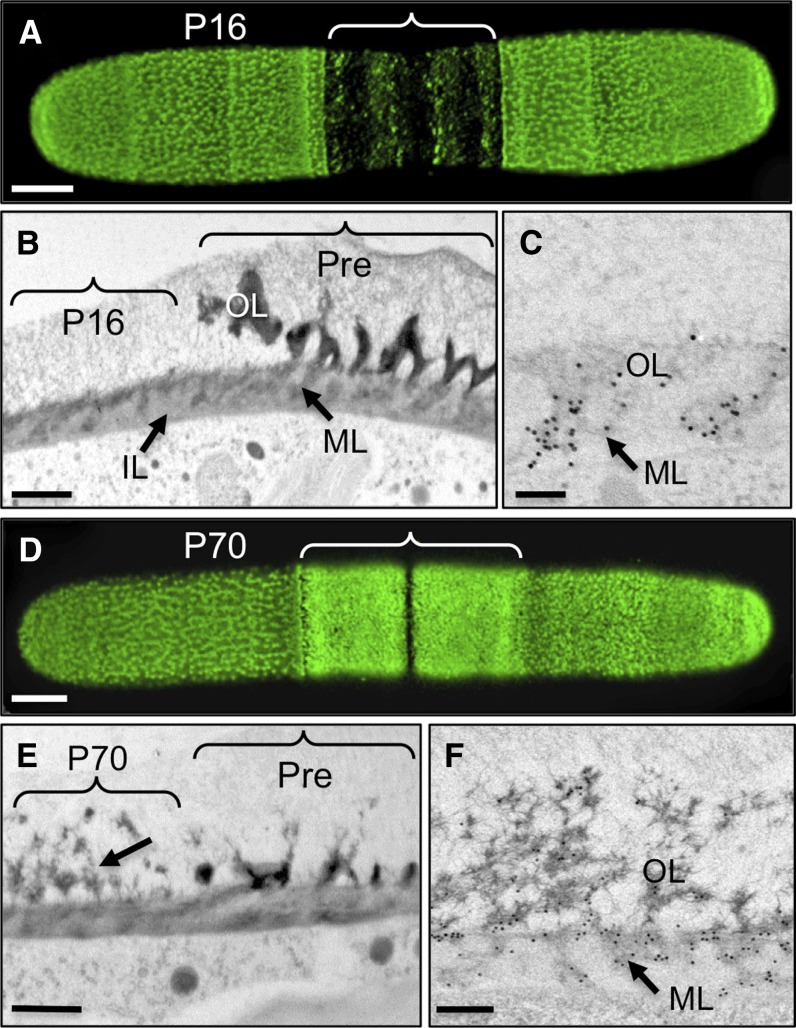
To further examine the significance of HG DE on lattice formation, cells were cultured in the presence of exogenous HG with either low or high DE. Specifically, we wanted to test whether exogenous HG with different DE values might be incorporated into the wall during expansion, as was observed with the charophyte species Chara corallina (Proseus and Boyer, 2008). Incubation with the low DE pectin fraction P16 (i.e. plant PME-deesterified pectin with 16% DE; Limberg et al., 2000; Ralet et al., 2001) resulted in loss of JIM5 binding from the middle section of the cell (Fig. 9A), and TEM imaging of the transition zone between the isthmus and the mature wall showed that this was due to a lack of HG projections (Fig. 9B). The small fibrils that formed instead did not label with JIM5, which only labeled the ML (Fig. 9C), and since JIM5 binds only weakly to P16 pectins (Verhertbruggen et al., 2009), this suggests that the new fibrils are composed of the exogenous P16 pectins. In contrast, incubation with the relatively highly methylesterified pectin fraction P70 (70% DE; Limberg et al., 2000) shows strong JIM5 binding (Willats et al., 2000) in the form of dense punctae (Fig. 9D). The P70 incubation resulted in the appearance of numerous fibrillar masses in the OL (Fig. 9E) that were recognized by JIM5 (Fig. 9F).
Figure 9.
Effects of exogenous pectins on the pectin network. A, JIM5 immunolabeling after a 36-h incubation with a low DE pectin fraction (P16). The area where the lattice is absent is bracketed. B, TEM image of the transition zone (pre- and post-P16 incubation) showing OL, ML, and IL of a cell incubated with P16. Preexisting wall (Pre) is bracketed. C, JIM5-labeled wall after P16 incubation highlighting the label in the ML. D, JIM5 labeling after 36 h of incubation with a high DE pectin fraction (P70). The area where the lattice is altered is bracketed. E, Transition zone in the wall of a cell incubated with P70. Preexisting wall is bracketed. The arrow indicates fibrillar masses. F, JIM5 labeling after P70 incubation, highlighting the fibrillar masses of the OL and ML. Bars = 6 µm (A and D), 450 nm (B), 125 nm (C), 500 nm (E), and 400 nm (F).
Pectinase Treatments Suggest the Physical Proximity of Pectin Polymer Classes and a Role for Surface Pectins in Cellular Adhesion
One of the technical challenges of detecting polysaccharide epitopes in intact cell walls is the potential for masking effects, where the presence of one polymer blocks the binding of probes to other wall components (Marcus et al., 2008; Hervé et al., 2009). This can be addressed in some cases by treating tissue samples with glycanases to remove specific wall polysaccharides, thereby exposing previously inaccessible polymers. Such unmasking treatments, therefore, can also provide valuable information regarding the relative spatial distribution of epitopes within the wall architecture and suggest close proximity or even indicate physical interactions between different polymers. We took this approach to investigate the distribution and the potential for such interactions between various classes of pectin polymers in living P. margaritaceum cells.
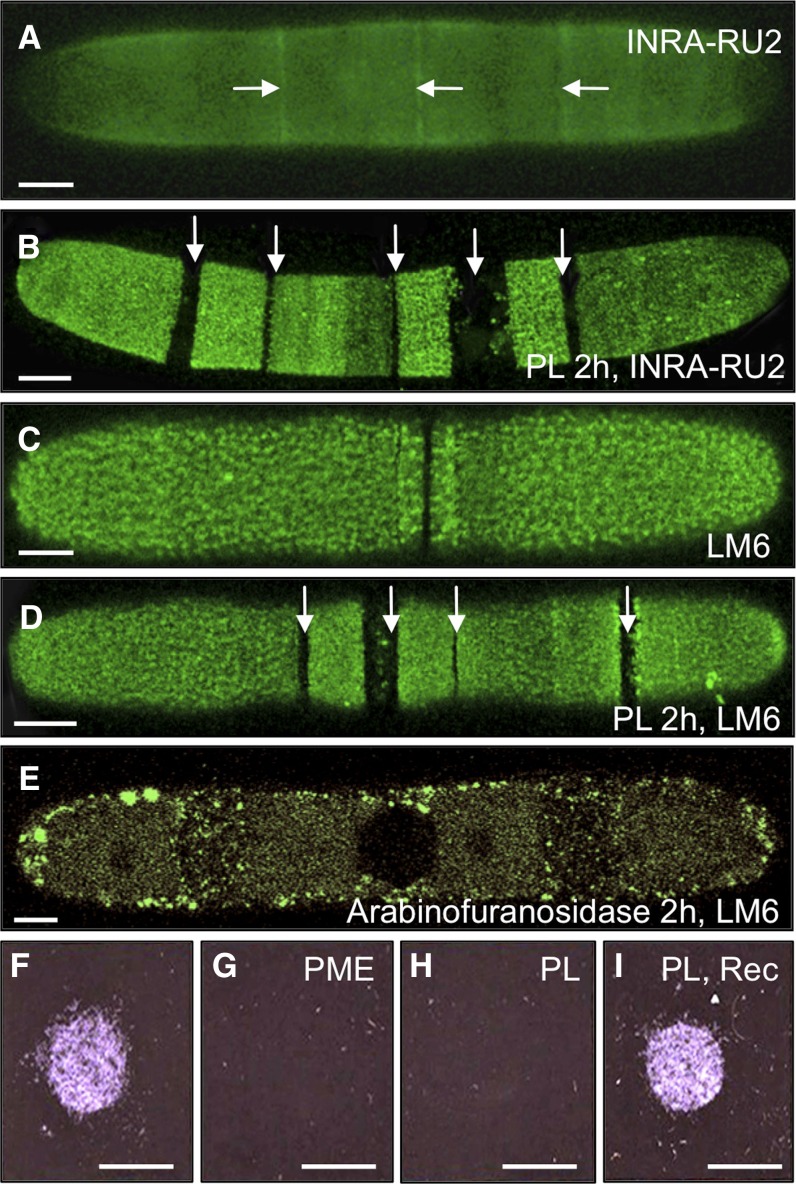
The INRA-RU2 mAb, which binds to the RGI backbone, labeled the entire cell surface in the plane of the ML (Fig. 10A), although, unlike JIM5 labeling, no lattice-like pattern was observed. More intense labeling was seen at the isthmus and secondary lateral bands, while there was reduced labeling at the cell poles. A brief pretreatment of the cells with PL resulted in a substantial reduction in labeling at the isthmus and lateral bands (Fig. 10B), and labeling with the LM6 mAb, which recognizes 1,5-linked α-arabinan, present as side chains on RGI as well as in arabinogalactan proteins (Lee et al., 2005), showed a similar pattern (Fig. 10, C and D). A subsequent second treatment with arabinofuranosidase, which hydrolyzes arabinans, resulted in almost complete loss of LM6 signal (Fig. 10E), confirming the nature of the epitope. The PL-based unmasking study thus suggests that the RGI and arabinan epitopes colocalize with HG in the mature wall ML and in the region adjacent to the isthmus and lateral bands, immediately after its deposition and demethylesterification.
Figure 10.
Pectinase unmasking treatments and to examine RGI distribution and evaluate HG-mediated adhesion. A, Immunolabeling of RGI with INRA-RU2. The arrows indicate more intense labeling at the isthmus and lateral bands. B, INRA-RU2 labeling after treatment with PL for 2 h, highlighting nonlabeled gaps (arrows). C, Labeling of arabinan with LM6. D, Labeling with LM6 after PL treatment, highlighting the nonlabeled gaps (arrows). E, LM6 labeling after 2 h of arabinofuranosidase treatment. F to I, Adhesion assay, showing cells adhering to the surface of a plastic petri dish (F) and after pretreatment with PME (G) or PL (H) and after a PL treatment followed by a recovery period in normal growth medium (Rec; I). Bars = 12 µm (A), 8 µm (B), 7 µm (C), 9.5 µm (D and E), and 5 mm (F–I).
In previous analyses of desmid extracellular matrices, surface cell wall polymers were suggested to be important for adhesion to substrates (Domozych et al., 2007a). Given our observations in this study that treatments with PME (Fig. 5) or PL (Fig. 6) effectively alter or remove the outer HG-rich lattice, we wanted to determine whether this secreted cell wall layer might be involved in cellular adhesion. To test this, freshly washed cells were placed on the surface of a plastic petri dish for 5 min; the dish was then flooded with fresh growth medium, and the degree of adhesion was monitored. Untreated cells attached firmly to the plastic surface (Fig. 10F), but when cells were first incubated with PME (Fig. 10G) or PL (Fig. 10H), no cell adhesion occurred. When PL-treated cells were washed free of enzyme and the pectin lattice was allowed to regenerate, adhesion was restored (Fig. 10I), indicating that the HG-rich lattice is indeed critical for cellular adhesion. We note that the adhesion assay took place in the dark, conditions under which EPS is not produced, so we can conclude that adhesion was not EPS mediated.
Carbohydrate Microarray Profiling of Sequentially Extracted Cell Walls
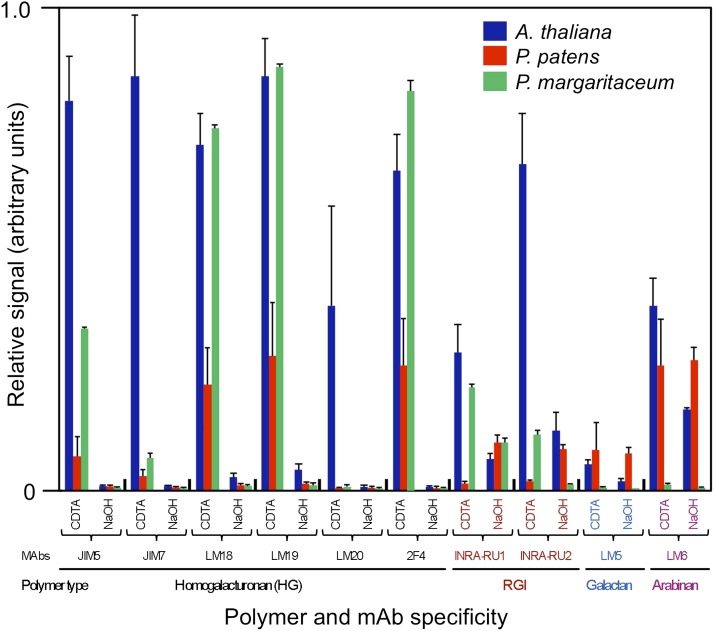
Another approach that can provide insights into physical interactions between cell wall polymers is to evaluate their extractability, and particularly coextraction, from walls using various solvents. To investigate the pattern and extractability of pectin polymers from P. margaritaceum walls, we performed a carbohydrate microarray experiment (Fig. 11) using an extended set of mAbs that recognize different pectin-associated epitopes to probe extracts that had been sequentially solubilized from P. margaritaceum wall material with CDTA and sodium hydroxide (NaOH). For comparative purposes, we similarly evaluated wall extracts from Arabidopsis (Arabidopsis thaliana) and Physcomitrella patens, to represent earlier and later diverging land plants, respectively.
Figure 11.
Carbohydrate microarray analysis of pectin epitopes from sequentially extracted cell wall material. Extracts sequentially solubilized by CDTA and NaOH from walls of P. margaritaceum, Arabidopsis, and P. patens were printed on microarrays and probed with the indicated mAbs. Spot intensities were quantified, with the highest value in the data set being set to 1 and others shown as relative values. Error bars reflect three individual experiments.
Overall, while P. margaritaceum and Arabidopsis walls contained larger amounts of HG than P. patens, the patterns of mAb binding indicated a similar HG extractability with CDTA and NaOH, suggesting a common association within their respective wall structures. For example, the epitope for Ca2+ cross-linked HG (2F4) was present in extracts from all three species and was more abundant in the CDTA-solubilized material. However, there were also some notable differences, and while RGI was more readily solubilized by CDTA than by NaOH from P. margaritaceum and Arabidopsis walls, the converse was true for P. patens. The LM6 and LM5 mAbs, which recognize arabinans and galactans (Willats et al., 1998), respectively, showed higher binding to extracts from the two land plant species than to those from P. margaritaceum. However, in general, the mAb binding pattern indicated similarity in relative extractability of the pectin polymer subclasses from P. margaritaceum and Arabidopsis.
DISCUSSION
The current model of HG gelation and its importance in intercellular adhesion is primarily based on three lines of evidence (Leboeuf et al., 2005): (1) unesterified HG is cross-linked by Ca2+ in vitro to form gel networks; (2) low DE HG and Ca2+ have been reported to colocalize in the middle lamella, cell junction zones adjacent to intracellular spaces, where cell adhesion is presumed to be particularly important; and (3) treatment of plant tissues with pectinases or Ca2+-chelating agents can induce cell separation. However, there is little direct evidence for this pectin assembly model occurring in vivo. In this study, we took advantage of the unusual wall architecture and exposed surface HG-rich lattice of P. margaritaceum to test this current model of HG deposition.
A Model for HG Assembly at the P. margaritaceum Cell Surface
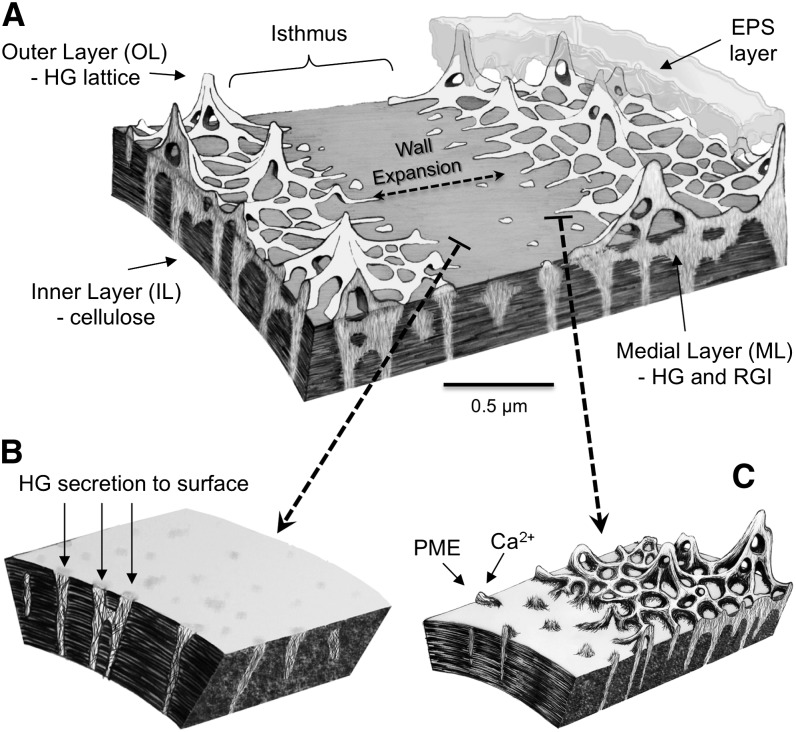
Immunological analyses using mAbs that recognize a range of pectin-associated epitopes were used to monitor the spatial and temporal patterns of different pectin structures in the mature wall and the isthmus, the site of active P. margaritaceum cell expansion. This suggests a model (Fig. 12) wherein the inner cellulosic layer, which is first deposited at the isthmus zone, serves as the foundation for the subsequent formation of the mature wall. Highly methylesterified HG is secreted at the isthmus (Fig. 12B) and is embedded in the cellulose domain, where it forms the HG aggregates of the ML. At the isthmus, the outer layer of HG is not present and the ML contains considerably smaller HG fibrillar aggregates. As more HG enters the wall during expansion, HG fibrils emerge onto the cell surface. During this displacement through the wall, the HG is deesterified, most likely by PME enzymes (Fig. 12C). The importance of demethylesterification for correct HG aggregation and lattice formation, in accordance with the model, was indicated by (1) immunocytochemical analysis revealing demethylesterification at the point of lattice formation; (2) in vivo perturbation of lattice formation by the addition of exogenous pectins with a low DE, or precocious and abnormal lattice formation induced by pectins with a high DE (Fig. 9); and (3) in vivo disruption of lattice formation by incubation with PME, including a pulse-chase recovery experiment (Fig. 5) that showed the direct but transient consequences of demethylesterification on HG assembly. Importantly, two of these sets of experiments involved living cells and direct observation of HG-rich lattice polymerization.
Figure 12.
P. margaritaceum cell wall and wall development model. A, The cell wall comprises three distinct layers: an OL consisting of the HG-rich lattice, an IL of cellulose, and an ML containing HG and RGI that traverses the IL. The isthmus zone at the cell center represents the focal point of cell expansion and division and consists of the IL and ML but not the HG-rich OL. B, During development, the inner cellulosic zone forms at the isthmus and highly methylesterified HG is secreted through pores in the cellulosic network of the IL to form the ML. C, HG fibrils ultimately emerge from the ML onto the surface of the isthmus wall, where they are demethylesterified, presumably by PME enzymes. This allows Ca2+ complexation of HG and the formation of the gel lattice.
The other key element of the model is the cross-linking of newly demethylesterified HG chains by Ca2+ at the cell surface (Fig. 12). This too was suggested by both immunocytochemical analysis, using the 2F4 mAb to reveal ubiquitous Ca2+ cross-linked HG in the OL but its absence from the ML (Fig. 4D), and also by studies with living cells. A reduction in Ca2+ levels in the culture medium also prevented lattice formation in expanding areas of the wall. Addition of the chelator CDTA caused extensive lattice solubilization, confirming the essential role of Ca2+ in HG aggregation in vivo.
Taken together, our data provide strong evidence that conformational changes in the HG fibrils occur during cross-linking and result in lattice formation. When Ca2+ bridges align/organize assemblages of HG fibrils of a specific packing density, physical forces, such as an increase in hydrophobicity, may cause the formation of lattice ring units. Continued secretion of HG may then result in branches arising from these rings, which ultimately fuse to form the raised wall projections. Significant changes in the physical state of HG via Ca2+ cross-linking, like those reported here, have been documented in both the formation of egg-box conformations (Jarvis, 1984) and rigid gels (Cabrera et al., 2008). However, the biophysical constraints or other factors that give rise to the distinctive lattice structure are currently unknown. We note that the P. margaritaceum wall also contains a range of hemicelluloses (Sørensen et al., 2011), and, while not the focus of this paper, they will be considered in future studies of wall microarchitecture.
The P. margaritaceum Cell Wall Shows Organizational and Structural Conservation with Those of Land Plants at Multiple Scales
In addition to HG distribution and dynamics, we also looked at the patterns of deposition and possible polymer-polymer interactions of RGI, the other pectin polysaccharide suggested to be present in the P. margaritaceum wall, albeit at very low levels (Sørensen et al., 2011). Immunological analyses of live cells and TEM imaging using mAbs that recognize the RGI backbone (INRA-RU1 and INRA-RU2) further indicated the presence of RGI. Moreover, they revealed the colocalization of RGI with HG in the ML but its absence from the cellulosic IL or the OL. The presence of RGI at the isthmus further suggests codeposition with methylesterified HG and extrusion through the pores in the cellulose microfibrillar network of the IL (Fig. 3C) during initial wall formation but exclusion from the OL lattice.
Interestingly, the layered P. margaritaceum wall organization resembles that of Arabidopsis seed coat mucilage, and it was recently shown that the formation of cellulose rays deposited on the inside of the mucilage layer is necessary for proper attachment of the complex pectic layer to the seed surface (Harpaz-Saad et al., 2011). We previously reported that P. margaritaceum exhibits an altered pattern of HG deposition after prolonged incubation with cellulases (Domozych et al., 2011). This further indicates that deposition of the pectic network depends on the cellulosic framework and that a structural connection between them is necessary for normal wall development. Indeed, recent studies of land plant walls have suggested physical associations between the arabinan and/or galactan side chains of RGI and cellulose microfibrils, and hence the pectin networks and cellulose, at least in some specialized cell types (Zykwinska et al., 2005, 2007; Harpaz-Saad et al., 2011; Chebli et al., 2012). In the P. margaritaceum wall, RGI may similarly function in connecting the pectin and cellulose domains, although the biochemical and carbohydrate microarray data suggest that any galactan or arabinan side chains on P. margaritaceum RGI polymers are less abundant than on RGI from land plants. An important caveat is that the LM6 mAb recognizes both the arabinogalactan side chains of RGI and arabinogalactan proteins. Therefore, these immunological data by themselves do not demonstrate that P. margaritaceum RGI has arabinan side chains, although glycan compositional analysis further suggests their presence (Sørensen et al., 2011).
We used the carbohydrate microarray analysis (Fig. 11) to compare the extractability of pectin polymers from the walls of P. margaritaceum and both early (P. patens) and later (Arabidopsis) diverging land plants. This allowed us to infer potential evolutionary conservation of molecular interactions within the wall. In general, similar patterns of epitope distribution were observed in all three species. However, RGI appeared to be more readily extracted from P. margaritaceum and Arabidopsis walls with CDTA than NaOH, while P. patens showed the opposite pattern, indicating a more extensive association by covalent linkages into the wall matrix. Pectinase treatments of live cells also gave insights into possible interpolymer connections, since PL treatment removed not only significant amounts of HG from the wall but also RGI and arabinan (Fig. 10), suggesting that they are physically associated.
In addition to demonstrating evolutionary conservation of the spatial distribution of different wall domains and polymer-polymer interactions within those domains, an important question is whether the individual polymers that form the microfibrillar structures of the lattice are also similar. Atomic force microscopy has been used to assess the structure and measure the size of individual pectin polymers/polymer complexes from land plants (Morris et al., 2009; Round et al., 2010). We developed a protocol using TEM to visualize CDTA-extracted HG. The dispersed HG polymers were shown to be extremely similar in both appearance and dimensions (Fig. 8, B and C) to those of CDTA-extracted HG from land plants (Round et al., 2010) and they showed rapid Ca2+-mediated gelling (Fig. 8D). This suggests that the fibrous network model of pectin long-range gel structure (Morris et al., 2009) can be applied to all green plants that synthesize HG.
Functional Significance of the HG-Rich Lattice: Implications for Plant Multicellularity and Middle Lamella Formation?
An examination of the walls of extant members of the charophytes, the lineage that gave rise to land plants (Supplemental Fig. S3), has the potential to reveal ancestral features that may have allowed the transition from unicellular aquatic plants to multicellular land species with complex body plans. P. margaritaceum is of particular interest in this regard as it is unicellular, but its complement of wall polymers has considerable overlap with those of embryophytes (Sørensen et al., 2010, 2011). As part of our studies of the deposition of the HG-rich lattice at the cell surface, we also determined that it has considerable adhesive properties (Fig. 10, F–I) and, as such, may function, together with the EPS layer, in adhering to solid surfaces.
This observation has intriguing parallels with the Ca2+-HG gels of the middle lamella of embryophytes, which also form at cell surfaces and are thought to be important for intracellular adhesion. While the middle lamella is generally reported as being formed at the cell plate during cell division, the amount of material laid down at the cell plate would be insufficient to accommodate the often dramatic increases in cell wall surface area during cell expansion. Typical changes in cell volume are from 100 μm3 to 107 μm3 (Geitmann, 2010), and without continued deposition of wall and middle lamella polymers, dramatic thinning and loss of wall or middle lamella integrity would occur. While not yet documented, we propose that the development and expansion of the middle lamella in growing cells require the coordinated deposition of pectins that must first cross the primary wall. The mechanism for such a process is unknown, but it may involve the natural segregation, phase separation, and self-assembly of polymers (MacDougall et al., 1997; Matyjaszewski, 2011), as has been suggested for pectinaceous middle lamella formation (Morris et al., 2009). P. margaritaceum provides an excellent opportunity to address this experimentally in vivo, and our recent development of a stable genetic transformation protocol for P. margaritaceum (Sørensen et al., 2014) may prove invaluable in this regard.
CONCLUSION
P. margaritaceum represents a valuable unicellular model organism for the study of pectin metabolism in plant cells. Its distinct outer pectin lattice offers a unique system for elucidating the nanostructure and developmental dynamics of HG. In addition, the amenability of live P. margaritaceum cells to various experimental treatments with subsequent changes in its pectin domain can be exploited to investigate the roles of pectin and cellulose in the maintenance of cell expansion and shape. Moreover, we suggest that the importance of P. margaritaceum pectin in substrate adhesion offers the potential to investigate the evolution, formation, and function of the middle lamella.
MATERIALS AND METHODS
Plant Materials and Culture Conditions
Penium margaritaceum (clonal strain 8; Skidmore Algal Culture Facility) was maintained in sterile liquid cultures of Woods Hole Medium (WHM; Nichols, 1973) and cultured at 5,400 lux, 16-h-light/8-h-dark photoperiod, and 18°C ± 1°C. Cultures were harvested as described previously (Domozych et al., 2007b). Arabidopsis (Arabidopsis thaliana Columbia-0 ecotype) and Physcomitrella patens were similarly grown using a 16-h-light/8-h-dark photoperiod. Arabidopsis was grown on 1.5% (w/v) agarose-solidified Murashige and Skoog medium (Sigma-Aldrich; http://www.sigmaaldrich.com/sigma-aldrich/home.html), while P. patens was maintained on 1.2% (w/v) agarose-solidified Waris medium (Nichols, 1973).
Live Cell Labeling and Treatments
Live cell labeling of cells with mAbs followed the protocol of Domozych et al. (2009, 2011). The antibody labeling buffer, except for 2F4, consisted of WHM (pH 7.2; contains 250 µm CaCl2), and the blocking buffer was WHM with 0.5% (w/v) bovine serum albumin (Sigma-Aldrich). For 2F4 labeling, the pH of the labeling and blocking buffers was maintained at 8.2. Enzymatic unmasking was performed by washing cells with WHM and incubating them with 3 units mL−1 PL (E-PLYCJ; Megazyme; www.megazyme.com) in WHM for up to 72 h at room temperature in the dark with continuous shaking. To confirm the presence of particular epitopes, cells were incubated with 1 unit mL−1 arabinofuranosidase (E-AFASE; Megazyme). In longer term studies with PL, enzyme concentrations were reduced to 1 unit mL−1 PL. Cells were treated with PME (Sigma-Aldrich; catalog no. P5400) for 12 h at 250 µg mL−1 in WHM. After enzyme treatments, cells were washed with WHM and labeled with primary mAbs and secondary mAbs (tetramethylrhodamine isothiocyanate–conjugated anti-rat [Sigma-Aldrich] for JIM and LM mAbs and tetramethylrhodamine isothiocyanate–conjugated anti-mouse [Sigma-Aldrich] for INRA-RU2). For exogenous pectin treatments, cells were incubated in 100 µg mL−1 P16 or P70 in WHM (pH 7.2) for up to 72 h and then sampled, washed, labeled, and observed as above. Cells were viewed with an Olympus BH-61 light microscope equipped with a Fluoview 300 confocal unit or an Olympus BH-60 light microscope equipped with a DP-71 digital camera (Olympus America; www.olympusamerica.com). An FM1-U2B93 PLANAPO 60× oil lens with a numerical aperture of 1.42 and working distance of 0.15 mm was used for the acquisition of images. Cells were dispersed in WHM before preparing the slides.
Cell Adhesion Assays
Aliquots of thoroughly washed cells (e.g. three times with WHM, shaking, and centrifugation) were applied to the surface of a plastic petri dish and allowed to settle for 5 min in the dark. The dish was then gently flooded with WHM, and cell adhesion was imaged with a flat-bed digital scanner. For the experimental treatment, freshly washed cells were incubated in PL (3 units mL−1) or PME (250 µg mL−1) in WHM for 24 h. Cells were then washed, and aliquots were similarly spotted on a petri dish and flooded. For the recovery experiment, PL-treated cells were washed three times with fresh WHM and placed back in culture for 24 h. At this time, cells were collected, washed, and assayed for adhesion as above.
Extraction of Cell Wall Material for Carbohydrate Microarray Profiling or Microscopic Analysis
For the carbohydrate microarray analysis, cell wall material was obtained from the alcohol-insoluble residue of freeze-dried P. margaritaceum cells, P. patens leafy gametophytes, and Arabidopsis rosette leaves, sequentially extracted, and subjected to microarray analysis using a range of mAbs, as described by Sørensen et al. (2011). Error bars represent the se values of three independent extractions and prints.
To obtain the CDTA-extractable fraction for microscopic imaging, P. margaritaceum walls were extracted as described by Domozych et al. (2007b), freeze dried, suspended in 50 mm of CDTA (pH 6.5), and shaken at 22°C for 6 h. Insoluble material was collected by centrifugation at 5,000g for 5 min, the supernatant was collected, and the wall pellet was washed with deionized water and recentrifuged. This procedure was repeated five times, and all supernatants were pooled. This CDTA-extracted fraction was then extensively dialyzed against deionized water (dialysis tubing with a 3,500 molecular weight cutoff; Fisher Scientific; Domozych et al., 2007b) and freeze dried. Five milligrams of the CDTA extract was dissolved in deionized water, and 50 µL was placed on a plastic coverslip and mixed with 50 µL of 50 mm CaCl2. The coverslip was then plunge frozen in liquid propane, cooled with liquid nitrogen (LN2), freeze substituted at −80°C in ethanol for 48 h, and warmed to −20°C over a 6-h period. The gel was transferred to the bottom of a Beem capsule and then infiltrated with London Resin at −20°C. The capsule was then polymerized at −20°C with UV light. Sections of 120 nm were collected using a Leica ultramicrotome and collected on Formvar-coated nickel grids. The sections were either first immunogold labeled with JIM5 and stained with conventional uranyl acetate/lead citrate or stained without immunogold labeling. Sections were viewed on a Zeiss Libra 120 transmission electron microscope at 120 kV.
Scanning Electron Microscopy
For VPSEM, cells were collected, washed, and applied in a thin liquid layer onto 1-cm-diameter circular sheets of nitrocellulose paper. The cells were allowed to settle for 1 min, and excess fluid was removed. The circular sheets were flash frozen in LN2, quickly transferred to a cryostub (JEOL; www.jeolusa.com), and cooled in LN2. The cryostub was placed in a 6480 JEOL VPSEM apparatus and viewed under the following conditions: Pascal, 10 kV, 30 Pascal, spot size = 60. For FESEM, frozen cells or isolated walls were placed on a Cambridge stub and viewed with an Ultra 55 FESEM device (Zeiss; http://www.zeiss.com).
TEM
For TEM, cells were harvested, washed and cryofixed, and freeze substituted as described previously (Domozych et al., 2005, 2007b). For immunogold labeling, 60-nm sections were obtained using a Reichert Ultracut ultramicrotome, collected on Formvar-coated nickel grids, and immunolabeled using the protocol of Domozych et al. (2007b). For high-resolution analysis of the outer wall layer, cell walls were isolated by sonication, washed with deionized water, and then cryofixed and freeze substituted (Domozych et al., 2007b). Sections of 60 nm were collected and viewed using a Libra 120 transmission electron microscope (Zeiss).
Supplemental Data
The following materials are available in the online version of this article.
Supplemental Figure S1. Effects of Ca2+ on HG-rich lattice architecture.
Supplemental Figure S2. Gelation of Penium CDTA-extracted pectin.
Supplemental Figure S3. Evolutionary tree of the charophyte green algae.
Supplementary Material
Acknowledgments
We thank Alicia Britton for technical assistance. mAbs were obtained from Plant Probes. INRA-RU1 and INRA-RU2 were kindly provided by Marie-Christine Ralet.
Glossary
- HG
homogalacturonan
- RGI
rhamnogalacturonan I
- PME
pectin methylesterase
- GalA
d-GalUA
- CDTA
cyclohexanediamine-N,N,N′,N′-tetraacetic acid
- DE
degree of esterification
- mAb
monoclonal antibody
- VPSEM
variable pressure scanning electron microscopy
- FESEM
field emission scanning electron microscopy
- TEM
transmission electron microscopy
- OL
outer layer
- IL
inner layer
- ML
medial layer
- EPS
extracellular polymeric substance
- PL
pectate lyase
- NaOH
sodium hydroxide
- WHM
Woods Hole Medium
- LN2
liquid nitrogen
Footnotes
This work was supported by the National Science Foundation (grant nos. NSF–MCB 0919925 and NSF–DBI 0922805 to D.S.D. and Plant Genome Program grant no. DBI–0606595 to J.K.C.R.) and by the Villum Kann Rasmussen Foundation, Denmark (postdoctoral stipend to I.S.).
The online version of this article contains Web-only data.
Articles can be viewed online without a subscription.
References
- Bouton S, Leboeuf E, Mouille G, Leydecker MT, Talbotec J, Granier F, Lahaye M, Höfte H, Truong HN. (2002) QUASIMODO1 encodes a putative membrane-bound glycosyltransferase required for normal pectin synthesis and cell adhesion in Arabidopsis. Plant Cell 14: 2577–2590 [DOI] [PMC free article] [PubMed] [Google Scholar]
- Bush MS, Marry M, Huxham IM, Jarvis MC, McCann MC. (2001) Developmental regulation of pectic epitopes during potato tuberisation. Planta 213: 869–880 [DOI] [PubMed] [Google Scholar]
- Caffall KH, Mohnen D. (2009) The structure, function, and biosynthesis of plant cell wall pectic polysaccharides. Carbohydr Res 344: 1879–1900 [DOI] [PubMed] [Google Scholar]
- Cabrera JC, Boland A, Messiaen J, Cambier P, Van Cutsem P. (2008) Egg box conformation of oligogalacturonides: the time-dependent stabilization of the elicitor-active conformation increases its biological activity. Glycobiology 18: 473–482 [DOI] [PubMed] [Google Scholar]
- Chebli Y, Kaneda M, Zerzour R, Geitmann A. (2012) The cell wall of the Arabidopsis pollen tube: spatial distribution, recycling, and network formation of polysaccharides. Plant Physiol 160: 1940–1955 [DOI] [PMC free article] [PubMed] [Google Scholar]
- Clausen MH, Willats WGT, Knox JP. (2003) Synthetic methyl hexagalacturonate hapten inhibitors of anti-homogalacturonan monoclonal antibodies LM7, JIM5 and JIM7. Carbohydr Res 338: 1797–1800 [DOI] [PubMed] [Google Scholar]
- Cosgrove DJ, Jarvis MC (2012) Comparative structure and biomechanics of plant primary and secondary cell walls. Front Plant Sci 3: 204 http://www.frontiersin.org/Plant_Physiology/10.3389/fpls.2012.00204/full [DOI] [PMC free article] [PubMed]
- Doblin MS, Pettolino F, Bacic A. (2010) Plant cell walls: the skeleton of the plant world. Funct Plant Biol 37: 357–381 [Google Scholar]
- Domozych DS, Brechka H, Britton A, Toso M. (2011) Cell wall growth and modulation dynamics in a model unicellular green alga—Penium margaritaceum: live cell labeling with monoclonal antibodies. J Bot 2011: 632165 http://www.hindawi.com/journals/jb/2011/632165/ [Google Scholar]
- Domozych DS, Elliott L, Kiemle S, Gretz MR. (2007a) Pleurotaenium trabecula, a desmid of wetland biofilms: the extracellular matrix and adhesion mechanism. J Phycol 43: 1022–1038 [Google Scholar]
- Domozych DS, Kort S, Benton S, Yu T. (2005) The extracellular polymeric substance of the green alga Penium margaritaceum and its role in biofilm formation. Biofilms 2: 129–144 [Google Scholar]
- Domozych DS, Lambiasse L, Kiemle SN, Gretz MR. (2009) Cell-wall development and bipolar growth in the desmid Penium margaritaceum (Zygnematophyceae, Streptophyta): asymmetry in a symmetric world. J Phycol 45: 879–893 [DOI] [PubMed] [Google Scholar]
- Domozych DS, Serfis A, Kiemle SN, Gretz MR. (2007b) The structure and biochemistry of charophycean cell walls. I. Pectins of Penium margaritaceum. Protoplasma 230: 99–115 [DOI] [PubMed] [Google Scholar]
- Eder M, Lütz-Meindl U. (2008) Pectin-like carbohydrates in the green alga Micrasterias characterized by cytochemical analysis and energy filtering TEM. J Microsc 231: 201–214 [DOI] [PubMed] [Google Scholar]
- Eder M, Lütz-Meindl U. (2010) Analyses and localization of pectin-like carbohydrates in cell wall and mucilage of the green alga Netrium digitus. Protoplasma 243: 25–38 [DOI] [PMC free article] [PubMed] [Google Scholar]
- Fry SC (1988) The Growing Plant Cell Wall: Chemical and Metabolic Analysis. H Longman, London [Google Scholar]
- Geitmann A. (2010) Mechanical modeling and structural analysis of the primary plant cell wall. Curr Opin Plant Biol 13: 693–699 [DOI] [PubMed] [Google Scholar]
- Guillemin F, Guillon F, Bonnin E, Devaux MF, Chevalier T, Knox JP, Liners F, Thibault JF. (2005) Distribution of pectic epitopes in cell walls of the sugar beet root. Planta 222: 355–371 [DOI] [PubMed] [Google Scholar]
- Harpaz-Saad S, McFarlane HE, Xu S, Divi UK, Forward B, Western TL, Kieber JJ. (2011) Cellulose synthesis via the FEI2 RLK/SOS5 pathway and cellulose synthase 5 is required for the structure of seed coat mucilage in Arabidopsis. Plant J 68: 941–953 [DOI] [PubMed] [Google Scholar]
- Hervé C, Rogowski A, Gilbert HJ, Knox JP. (2009) Enzymatic treatments reveal differential capacities for xylan recognition and degradation in primary and secondary plant cell walls. Plant J 58: 413–422 [DOI] [PubMed] [Google Scholar]
- Huxham IM, Jarvis MC, Shakespeare L, Dover CJ, Johnson D, Knox JP, Seymour GB. (1999) Electron-energy-loss spectroscopic imaging of calcium and nitrogen in the cell walls of apple fruits. Planta 208: 438–443 [Google Scholar]
- Jarvis MC. (1984) Structure and properties of pectin gels in plant cell walls. Plant Cell Environ 7: 153–164 [Google Scholar]
- Jarvis MC, Apperley DC. (1995) Chain conformation in concentrated pectin gels: evidence from 13C NMR. Carbohydr Res 276: 131–145 [Google Scholar]
- Jarvis MC, Briggs SPH, Knox JP. (2003) Intercellular adhesion and cell separation in plants. Plant Cell Environ 26: 977–989 [Google Scholar]
- Leboeuf E, Guillon F, Thoiron S, Lahaye M. (2005) Biochemical and immunohistochemical analysis of pectic polysaccharides in the cell walls of Arabidopsis mutant QUASIMODO 1 suspension-cultured cells: implications for cell adhesion. J Exp Bot 56: 3171–3182 [DOI] [PubMed] [Google Scholar]
- Lee KJD, Sakata Y, Mau SL, Pettolino F, Bacic A, Quatrano RS, Knight CD, Knox JP. (2005) Arabinogalactan proteins are required for apical cell extension in the moss Physcomitrella patens. Plant Cell 17: 3051–3065 [DOI] [PMC free article] [PubMed] [Google Scholar]
- Leliaert F, Smith DR, Moreau H, Herron MD, Verbruggen H, Delwiche CF, De Clerck O. (2012) Phylogeny and molecular evolution of the green algae. Crit Rev Plant Sci 31: 1–46 [Google Scholar]
- Limberg G, Körner R, Buchholt HC, Christensen TMIE, Roepstorff P, Mikkelsen JD. (2000) Quantification of the amount of galacturonic acid residues in blocksequences in pectin homogalacturonan by enzymatic fingerprinting with exo- and endo-polygalacturonase II from Aspergillus niger. Carbohydr Res 327: 321–332 [DOI] [PubMed] [Google Scholar]
- Liners F, Letesson JJ, Didembourg C, Van Cutsem P. (1989) Monoclonal antibodies against pectin: recognition of a conformation induced by calcium. Plant Physiol 91: 1419–1424 [DOI] [PMC free article] [PubMed] [Google Scholar]
- Liners F, Thibault JF, Van Cutsem P. (1992) Influence of the degree of polymerization of oligogalacturonates and of esterification pattern of pectin on their recognition by monoclonal antibodies. Plant Physiol 99: 1099–1104 [DOI] [PMC free article] [PubMed] [Google Scholar]
- Lütz-Meindl U, Brosch-Salomon S. (2000) Cell wall secretion in the green alga Micrasterias. J Microsc 198: 208–217 [DOI] [PubMed] [Google Scholar]
- MacDougall AJ, Rigby NM, Ring SG. (1997) Phase separation of plant cell wall polysaccharides and its implications for cell wall assembly. Plant Physiol 114: 353–362 [DOI] [PMC free article] [PubMed] [Google Scholar]
- Manfield IW, Bernal AJ, Møller I, McCartney L, Riess NP, Knox JP, Willats WGT. (2005) Re-engineering of the PAM1 phage display monoclonal antibody to produce a soluble, versatile anti-homogalacturonan scFv. Plant Sci 169: 1090–1095 [Google Scholar]
- Marcus SE, Verhertbruggen Y, Hervé C, Ordaz-Ortiz JJ, Farkas V, Pedersen HL, Willats WGT, Knox JP. (2008) Pectic homogalacturonan masks abundant sets of xyloglucan epitopes in plant cell walls. BMC Plant Biol 8: 60. [DOI] [PMC free article] [PubMed] [Google Scholar]
- Marry M, Roberts K, Jopson SJ, Huxham M, Jarvis MC, Corsar J, Robertson E, McCann MC. (2006) Cell-cell adhesion in fresh sugar-beet root parenchyma requires both pectin esters and calcium cross-links. Physiol Plant 126: 243–256 [Google Scholar]
- Matyjaszewski K. (2011) Architecturally complex polymers with controlled heterogeneity. Science 333: 1104–1105 [DOI] [PubMed] [Google Scholar]
- McCartney L, Knox JP. (2002) Regulation of pectic polysaccharide domains in relation to cell development and cell properties in the pea testa. J Exp Bot 53: 707–713 [DOI] [PubMed] [Google Scholar]
- Morris VJ, Gromer A, Kirby AR. (2009) Architecture of intracellular networks in plant matrices. Struct Chem 20: 255–261 [Google Scholar]
- Ng A, Parker ML, Parr AJ, Saunders PK, Smith AC, Waldron KW. (2000) Physicochemical characteristics of onion (Allium cepa L.) tissues. J Agric Food Chem 48: 5612–5617 [DOI] [PubMed] [Google Scholar]
- Nichols HW (1973) Growth media: freshwater. In JR Stein, ed, Handbook of Phycological Methods. Cambridge University Press, Cambridge, UK, pp 16–17 [Google Scholar]
- Orfila C, Seymour GB, Willats WGT, Huxham IM, Jarvis MC, Dover CJ, Thompson AJ, Knox JP. (2001) Altered middle lamella homogalacturonan and disrupted deposition of (1→5)-α-l-arabinan in the pericarp of Cnr, a ripening mutant of tomato. Plant Physiol 126: 210–221 [DOI] [PMC free article] [PubMed] [Google Scholar]
- Parker CC, Parker ML, Smith AC, Waldron KW. (2001) Pectin distribution at the surface of potato parenchyma cells in relation to cell-cell adhesion. J Agric Food Chem 49: 4364–4371 [DOI] [PubMed] [Google Scholar]
- Peaucelle A, Braybrook SA, Le Guillou L, Bron E, Kuhlemeier C, Höfte H. (2011) Pectin-induced changes in cell wall mechanics underlie organ initiation in Arabidopsis. Curr Biol 21: 1720–1726 [DOI] [PubMed] [Google Scholar]
- Proseus TE, Boyer JS. (2008) Calcium pectate chemistry causes growth to be stored in Chara corallina: a test of the pectate cycle. Plant Cell Environ 31: 1147–1155 [DOI] [PubMed] [Google Scholar]
- Ralet MC, Dronnet VO, Buchholt HC, Thibault JF. (2001) Enzymatically and chemically de-esterified lime pectins: characterisation, polyelectrolyte behaviour and calcium binding properties. Carbohydr Res 336: 117–125 [DOI] [PubMed] [Google Scholar]
- Ralet MC, Tranquet O, Poulain D, Moïse A, Guillon F. (2010) Monoclonal antibodies to rhamnogalacturonan I backbone. Planta 231: 1373–1383 [DOI] [PubMed] [Google Scholar]
- Rihouey C, Jauneau A, Cabin-Flaman A, Demarty M, Lefebvre F, Morvan MC. (1995) Calcium and acidic pectin distribution in flax cell walls: evidence for different kinds of linkages in the cell junction and middle lamella of the cortical parenchyma of flax hypocotyl. Plant Physiol Biochem 33: 497–508 [Google Scholar]
- Round AN, Rigby NM, MacDougall AJ, Morris VJ. (2010) A new view of pectin structure revealed by acid hydrolysis and atomic force microscopy. Carbohydr Res 345: 487–497 [DOI] [PubMed] [Google Scholar]
- Sørensen I, Domozych DS, Willats WGT. (2010) How have plant cell walls evolved? Plant Physiol 153: 366–372 [DOI] [PMC free article] [PubMed] [Google Scholar]
- Sørensen I, Fei Z, Andreas A, Willats WGT, Domozych DS, Rose JKC. (2014) Stable transformation and reverse genetic analysis of the charophyte green alga Penium margaritaceum: a new platform for studies of the immediate ancestors of land plants. Plant J 77: 339–351 [DOI] [PubMed] [Google Scholar]
- Sørensen I, Pettolino FA, Bacic A, Ralph J, Lu F, O’Neill MA, Fei Z, Rose JKC, Domozych DS, Willats WGT. (2011) The charophycean green algae provide insights into the early origins of plant cell walls. Plant J 68: 201–211 [DOI] [PubMed] [Google Scholar]
- Thompson AJ, Tor M, Barry CS, Vrebalov J, Orfila C, Jarvis MC, Giovannoni JJ, Grierson D, Seymour GB. (1999) Molecular and genetic characterization of a novel pleiotropic tomato-ripening mutant. Plant Physiol 120: 383–390 [DOI] [PMC free article] [PubMed] [Google Scholar]
- Verhertbruggen Y, Marcus SE, Haeger A, Ordaz-Ortiz JJ, Knox JP. (2009) An extended set of monoclonal antibodies to pectic homogalacturonan. Carbohydr Res 344: 1858–1862 [DOI] [PubMed] [Google Scholar]
- Willats WG, Orfila C, Limberg G, Buchholt HC, van Alebeek GJ, Voragen AG, Marcus SE, Christensen TM, Mikkelsen JD, Murray BS, et al. (2001) Modulation of the degree and pattern of methyl-esterification of pectic homogalacturonan in plant cell walls: implications for pectin methyl esterase action, matrix properties, and cell adhesion. J Biol Chem 276: 19404–19413 [DOI] [PubMed] [Google Scholar]
- Willats WGT, Limberg G, Buchholt HC, van Alebeek GJ, Benen J, Christensen TM, Visser J, Voragen A, Mikkelsen JD, Knox JP. (2000) Analysis of pectic epitopes recognised by hybridoma and phage display monoclonal antibodies using defined oligosaccharides, polysaccharides, and enzymatic degradation. Carbohydr Res 327: 309–320 [DOI] [PubMed] [Google Scholar]
- Willats WGT, Marcus SE, Knox JP. (1998) Generation of monoclonal antibody specific to (1→5)-α-L-arabinan. Carbohydr Res 308: 149–152 [DOI] [PubMed] [Google Scholar]
- Wolf S, Greiner S. (2012) Growth control by cell wall pectins. Protoplasma (Suppl 2) 249: S169–S175 [DOI] [PubMed] [Google Scholar]
- Wolf S, Hématy K, Höfte H. (2012) Growth control and cell wall signaling in plants. Annu Rev Plant Biol 63: 381–407 [DOI] [PubMed] [Google Scholar]
- Wolf S, Mouille G, Pelloux J. (2009) Homogalacturonan methyl-esterification and plant development. Mol Plant 2: 851–860 [DOI] [PubMed] [Google Scholar]
- Xu C, Zhao L, Pan X, Šamaj J. (2011) Developmental localization and methylesterification of pectin epitopes during somatic embryogenesis of banana (Musa spp. AAA). PLoS ONE 6: e22992. [DOI] [PMC free article] [PubMed] [Google Scholar]
- Zykwinska A, Thibault JF, Ralet MC. (2007) Organization of pectic arabinan and galactan side chains in association with cellulose microfibrils in primary cell walls and related models envisaged. J Exp Bot 58: 1795–1802 [DOI] [PubMed] [Google Scholar]
- Zykwinska AW, Ralet MC, Garnier CD, Thibault JF. (2005) Evidence for in vitro binding of pectin side chains to cellulose. Plant Physiol 139: 397–407 [DOI] [PMC free article] [PubMed] [Google Scholar]
Associated Data
This section collects any data citations, data availability statements, or supplementary materials included in this article.


