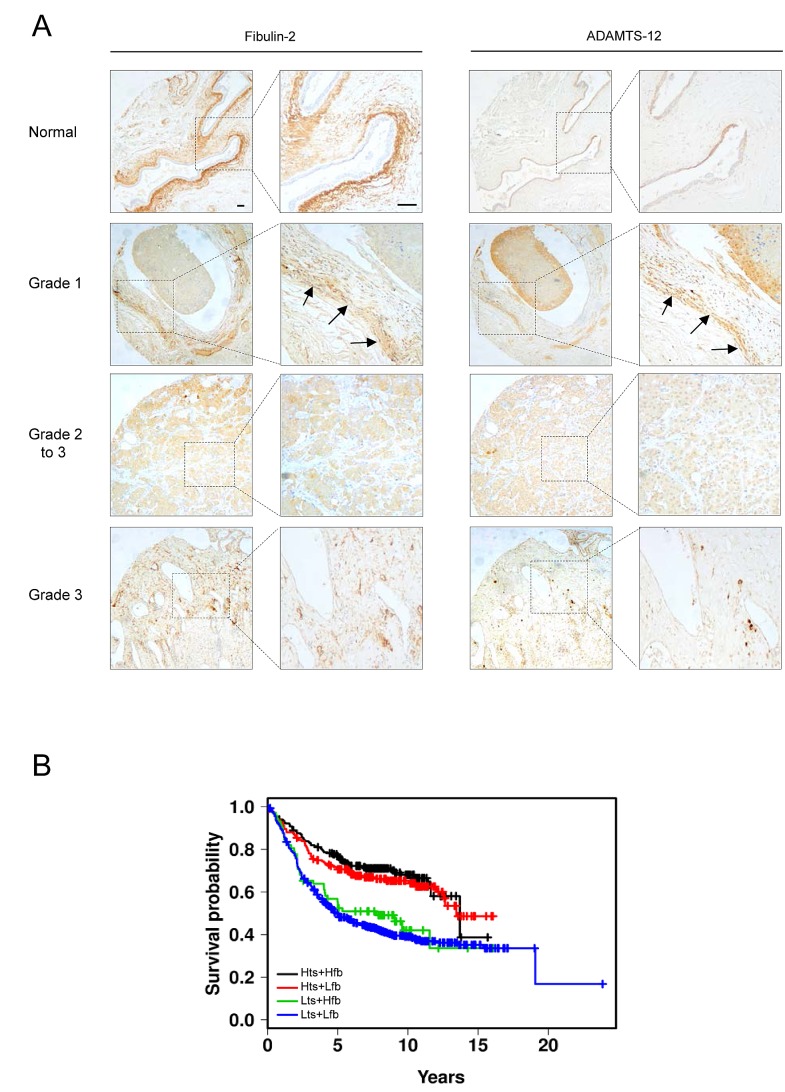
Figure 6. FBLN2 and ADAMTS12 expression analysis in breast cancer samples.
(A) representative tissue images for detection of ADAMTS-12 and fibulin-2 in healthy breast tissue and breast carcinoma samples. Arrows indicate detection of ADAMTS-12 and fibulin-2 in grade 1 breast carcinoma. Scale bar, 200 μm. (B) Kaplan-Meier survival plots showing a better outcome of breast patients with high expression level of both ADAMTS12 and FBLN2 (Hts+Hfb). Plots for high ADAMTS12 and low FBLN2 (Hts+Lfb); low ADAMTS12 and high FBLN2 (Lts+Hfb); and low ADAMTS12 and low FBLN2 (Lts+Lfb) are also included.

