

Abstract
G-protein coupled receptors (GPCRs) are key cellular signaling proteins and have been targeted by ∼30-40% of marketed drugs for treating many human diseases including cancer and heart failure. Recently, we directly observed activation of the M2 muscarinic receptor through long-timescale accelerated molecular dynamics (aMD) simulation, which revealed distinct inactive, intermediate and active conformers of the receptor. Here, FTMAP is applied to search for “hot spots” in these activation-associated conformers using a library of 16 organic probe molecules that represent fragments of potential drugs. Seven allosteric (non-orthosteric) binding sites are identified in the M2 receptor through the FTMAP analysis. These sites are distributed in the solvent-exposed extracellular and intracellular mouth regions, as well as the lipid-exposed pockets formed by the transmembrane α helices TM3-TM4, TM5-TM6 and TM7-TM1/TM2. They serve as promising target sites for designing novel allosteric modulators as receptor-selective drugs.
Keywords: GPCR, M2 Muscarinic receptor, FTMAP, Allosteric sites, Receptor-selective drugs
Introduction
G-protein coupled receptors (GPCRs) represent the largest superfamily of membrane proteins that mediate cellular responses to hormones, neurotransmitters, and the senses of sight, olfaction and taste. Due to their critical roles in both the central and parasympathetic nervous systems, GPCRs have served as targets of ∼30-40% of currently marketed drugs for treating a wide spectrum of diseases including cancer, heart failure, asthma, schizophrenia, Alzheimer's and Parkinson's diseases (1, 2).
Muscarinic acetylcholine receptors are members of the class A (rhodopsin-like) GPCRs, comprised of five subtypes, i.e., M1-M5. The odd-numbered subtypes prefer to couple with the Gq/11 proteins, which stimulate the metabolism of phospholipids and calcium release. The even-numbered subtypes predominantly couple with the Gi/o proteins, which inhibit the adenylyl cyclase activity and production of a second messenger, cAMP (3). The X-ray structures were recently determined for the human M2 and M3 muscarinic receptors, providing important insights into the receptor-ligand binding interactions (4, 5). However, both receptors were crystallized in an inactive state with an antagonist bound. At that time, it was unknown what different conformations the muscarinic receptors may adopt during activation, and details of the activation mechanisms remained unclear.
Recently, we applied accelerated molecular dynamics (aMD) simulation to the M2 muscarinic receptor and directly observed its activation in a ligand-free form (6). This enables us to characterize the receptor activation pathway and analyze its highly dynamic network for allosteric regulation at an atomistic level. Starting from the inactive X-ray conformation, the receptor initially changes into an intermediate state, in which the transmembrane α helix 7 (TM7) becomes undistorted with significant displacement in the intracellular NPxxY motif. Due to high mobility in the TM5 cytoplasmic end, two low-energy conformers with different Tyr2065.58 (the superscript denotes Ballesteros-Weinstein residue numbering convention (7)) orientations appear in the intermediate state. Finally, the receptor transitions into an active state, which is characterized by formation of a Tyr2065.58-Tyr4407.53 hydrogen bond in the intracellular G-protein coupling site and outward tilting of the TM6 cytoplasmic end by ∼6 Å.
As most residues in the orthosteric site (defined as the region where endogenous ligands bind) are highly conserved across different GPCRs, design of receptor-selective drugs targeting the orthosteric site has been challenging. Many orthosteric drugs have been known to cause adverse side effects due to nonspecific binding to closely related GPCR subtypes. For example, orthosteric agonists that target at the M1 and M4 muscarinic receptors for treating schizophrenia and the Alzheimer's disease cross-react the M2 and M3 receptors, causing serious gastrointestinal distress and bradycardia problems (8, 9).
Alternatively, development of allosteric modulators, drugs that act by binding to allosteric (non-orthosteric) sites, has emerged as a new paradigm to discover subtype-selective drugs in GPCR pharmaceutical research (10, 11). In muscarinic receptors, an extracellular vestibule located in the entrance of the ligand-binding cavity has been identified as a “common” allosteric site for designing various allosteric modulators (9, 12, 13). Furthermore, design of “dualsteric” or bitopic hybrid ligands that bind both orthosteric and the extracellular allosteric site have also been actively pursued to identify drugs with improved binding affinity and/or functional selectivity (14-16). A second allosteric site has been suggested in muscarinic receptors as well (12). In this context, a comprehensive search for receptor allosteric sites could provide valuable information for designing subtype-specific modulators.
FTMAP is a fragment-based mapping algorithm that implements an efficient fast Fourier transform (FFT) correlation approach to search global protein surface for potential druggable “hot spots” or consensus sites (CSs) (17). It has been applied to explore the allosteric sites in the β1- and β2-adrenergic receptors (β1AR and β2AR) (18). In that work, a set of representative receptor conformers was selected through RMSD-based clustering of 240 ns conventional molecular dynamics (cMD) simulation ensemble for each of the two receptors. FTMAP analysis of the representative conformers identified five allosteric sites in the two receptors with one located in the extracellular mouth, one in the intracellular G-protein coupling site, and three others in lipid-exposed regions of the TM bundle. Some of these allosteric sites were found undetectable in the receptor X-ray structures and one site located between the intracellular domains of TM3 and TM4 is specific to β2AR. However, cMD simulations performed for 240 ns or even on longer microsecond timescales suffer from incomplete conformational sampling and GPCRs could remain inactive through the simulations (19). As a result, the representative structures selected from these simulations are not able to capture the different GPCR conformational states.
Here, we apply FTMAP to search for allosteric binding sites in the M2 receptor, for which enhanced conformational sampling is achieved through long-timescale aMD simulation and representative inactive, intermediate and active conformers are identified along the receptor activation pathway. Seven allosteric sites are identified in the receptor with two distributed in the solvent-exposed extracellular and intracellular mouth regions and five in the lipid-exposed pockets formed by the transmembrane α helices. These sites provide a detailed picture of the receptor surface topology. They also serve as important target sites for future design of allosteric modulators as receptor-selective drugs.
Methods
Relaxed Complex Scheme with aMD Enhanced Sampling
Relaxed complex scheme (RCS) is a computational approach that has been implemented to account for receptor flexibility in computer-aided drug design(20-22). Initially, it made use of all-atom cMD simulations to capture dynamic motions of the target biomolecule and select ensemble structures for molecular docking. Simulations were performed on 1-10 ns timescales and snapshots were extracted at a certain time interval (e.g., 10 ps) to construct the structural ensemble. Due to increasing computational power, biomolecular simulations have now been extended to longer timescales, e.g., 100 ns-10 μs(18, 23). Accordingly, RMSD-based and QR-factorization algorithms have been developed to cluster simulation snapshots into representative structural ensemble (20), which greatly reduces the number of structures for docking while maintaining the major biomolecular conformations sampled by the entire simulation.
AMD enhances the conformational sampling of biomolecules by adding a non-negative boost when the system potential is lower than a reference energy (24, 25). It has been shown in previous applications that hundreds-of-nanosecond aMD simulations are able to capture millisecond-timescale events in a protein (26). Representative low-energy conformers can be obtained by energetic reweighting of the aMD simulations. They are relevant to different functional states of the biomolecule and thus serve as excellent target structures for RCS docking.
For the constitutively active M2 receptor, low-energy conformers derived from aMD simulation (6) can be used to identify allosteric sites and perform structural docking to discover functionally selective drugs. Fig. 1 shows a scheme of site mapping using FTMAP on the X-ray structure of the M2 receptor (PDB ID: 3UON) and the receptor representative low-energy conformers obtained from aMD simulation. With QNB antagonist removed from the X-ray structure, the ligand-free (apo) M2 receptor is able to sample multiple conformations with basal activity (3, 27). An ensemble of receptor structures is obtained from the aMD simulation by taking snapshots at a 10 ps time interval. Energetic reweighting is applied to recover canonical ensemble of the receptor dynamics and identify representative low-energy conformers as described in Ref. (6). These conformers are subject to FTMAP site mapping to analyze the distribution of probe molecules and identify top-ranked “hot spots” that preferentially bind fragments of drug molecules. Key protein residues that are found within a certain distance of bound probe molecules (e.g., 3 Å used here) can be used to characterize the chemical nature of the binding site, i.e., hydrophobic, hydrophilic, or both.
Fig. 1.
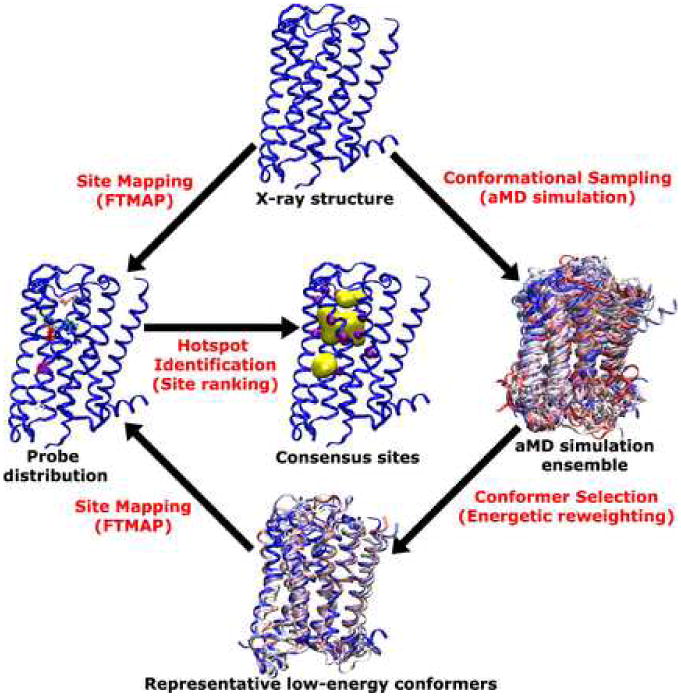
Scheme of site mapping using FTMAP on the X-ray structure of the M2 muscarinic receptor and the representative low-energy conformers revealed from aMD simulation.
Mapping of Druggable Binding Sites
With the X-ray structure and representative low-energy conformers of the M2 receptor derived from the aMD simulation (6), FTMAP is applied to identify druggable binding sites in the receptor through the online server (http://ftmap.bu.edu) (17). A library of 16 organic solvent molecules is used to map the receptor surface (i.e., solvent mapping) to search for “hot spots” or consensus sites (CSs). The 16 probe molecules that represent fragments of drug molecules with diverse hydrophobic and hydrophilic properties are benzene, cyclohexane, ethane, ethanol, isopropanol, isobutanol, acetone, acetaldehyde, dimethyl ether, acetonitrile, urea, methylamine, phenol, benzaldehyde, acetamide and N, N-dimethylformamide. Energy functions that account for nonbonded van der Waals and electrostatic interactions, as well as solvation effects, are used to evaluate the clusters of bound probe molecules.
For each FTMAP analysis, the main output obtained from the online server is a PDB file that contains atomic coordinates of the input receptor structure, as well as clustered probe molecules written into separate chains. Protein residues that have any heavy atom within 3 Å of the clustered probe molecules are used to define the corresponding CSs, which are ranked by the number of bound probes. The top ten CSs that are identified in the X-ray structure of the M2 receptor (Fig. S1) and each of the representative simulation-derived conformers (Fig. S2) are analyzed in detail regarding their locations and key interacting residues. If two CSs involve the same secondary structures in the receptor and the distance between their bound probe moelcules is within 5 Å, they are considered as subsites of one larger site. Thus, multiple CSs often overlap to form one single binding site with the bound probe molecules representing different moieties of potential drug ligands.
Results and Discussion
Through FTMAP analysis of the X-ray structure of the M2 receptor and its low-energy inactive, intermediate and active conformers revealed from the aMD simulation (see Methods), the receptor orthosteric site and seven allosteric sites are identified from the top-ranked CSs as shown in Fig. 2. Particularly, the key protein residues and secondary structures that interact with bound probe molecules in the allosteric sites are summarized in Table 1.
Fig. 2.
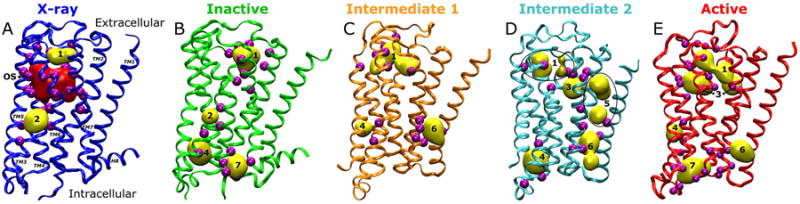
Consensus sites are identified in the M2 receptor through FTMAP analysis of (A) the X-ray structure (blue) and simulation-derived (B) inactive (green), (C) intermediate 1 (orange), (D) intermediate 2 (cyan) and (E) active (red) conformers. The orthosteric site (OS) is shown only in the X-ray structure using red surface representation. Seven non-orthosteric (allosteric) sites are labeled and shown as yellow surface in the structures. Key interacting residues that are identified within 3 Å of the bound probe molecules in the allosteric sites are rendered as purple spheres and listed in Table 1.
Table 1.
List of allosteric sites mapped using the X-ray structure and simulation-derived inactive, intermediate and active conformers of the M2 receptor. Key interacting residues are listed using the Ballesteros-Weinstein numbering (7).
| Location | Secondary Structures | Key Interacting Residues | Site |
|---|---|---|---|
| Extracellular | ECL2, TM3, TM7 | Ile178ECL2, Tyr1043.33, Tyr4267.39 | 1 |
| Lipid exposed | TM5, TM6 | Met2025.54, Tyr2065.58, Leu3936.41, Ile3976.45 | 2 |
| TM3, TM4 | Leu983.27, Trp993.28, Leu1023.31, Asp1033.32, Phe1524.54, Trp1554.57, Ile1594.61, Phe1614.63 | 3 | |
| Ile1163.45, Asp1203.49, Tyr1313.60, Met1394.41, Met1434.45, Ala1474.49 | 4 | ||
| TM7, TM1, TM2 | Ser341.43, Thr371.46, Met772.58, Thr4237.36, Tyr4307.43, Ile4317.44, Thr4347.47 | 5 | |
| Asn411.50, Val441.53, Leu622.43, Thr4347.47, Leu4357.48, Ala4387.51, Cys4397.52 | 6 | ||
| Intracellular | TM3, TM5, TM6, TM7 | Arg1213.50, Val1253.54, Tyr2065.58, Ile2095.61, Thr3866.34, Tyr4407.53 | 7 |
In the X-ray structure, probes from the top three and fifth CSs cluster in the orthosteric site and overlap excellently with the QNB antagonist (Fig. S1). Two allosteric sites are also identified in the X-ray structure as shown in Fig. 2A, i.e., Site 1 in the extracellular mouth and Site 2 in the junction between the TM5 and TM6 helices. In the simulation-derived representative conformers, five more allosteric sites are identified in the M2 receptor in addition to Sites 1 and 2 (Figs. 2B-E). Two of these five sites are located in the lipid-exposed extracellular (Site 3) and intracellular (Site 4) regions of the TM3 and TM4 helices. Another two sites are found in the extracellular (Site 5) and intracellular (Site 6) regions between TM1, TM2 and TM7. Finally, Site 7 is revealed in the receptor intracellular mouth that binds the G protein for cellular signaling (6).
Site 1: solvent-exposed extracellular mouth
As shown in Fig. 3, allosteric Site 1 is found in the extracellular mouth above the orthosteric site of the M2 receptor. It is surrounded by the TM3, TM5, TM6 and TM7 helices and covered by the ECL2 loop. In the X-ray structure, the extracellular mouth is opened by ∼11 Å as measured between the Cβ atoms of the Tyr177ECL2 and Trp4227.35 residues, and probe molecules mainly interact with receptor residues Ile178ECL2, Tyr1043.33 and Tyr4267.39 (Fig. 3B). In comparison, the extracellular mouth is closed in the active conformer as shown in Fig. 3C. Due to flexible motions of the ECL2, Site 1 exhibits varying shape and size in aMD simulation and the representative low-energy conformers (see Figs. 2B-E).
Fig. 3.
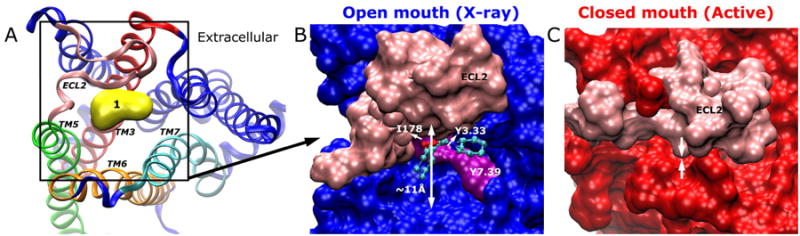
(A) Allosteric Site 1 is located in the extracellular mouth as illustrated in the X-ray structure. The ECL2, TM3, TM5, TM6 and TM7 are highlighted in pink, red, green, orange and cyan, respectively. (B) In the X-ray structure, the M2 receptor exhibits opened extracellular mouth by ∼11 Å as measured between the Cβ atoms of Tyr177ECL2 and Trp4227.35. The receptor is represented by surface with pink for ECL2, purple for key interacting residues and blue for the remainder of the receptor. The bound probes are rendered as ball-and-sticks. (C) In the active conformer (red), ECL2 (pink) is found to close up the extracellular mouth.
In previous microsecond-timescale cMD simulations of the M2 and M3 muscarinic receptors, antagonist tiotropium (TTP) was found to bind an extracellular vestibule formed by ECL2 and ECL3 (5). The extracellular vestibule corresponds closely to Site 1 identified here. It has been identified as a “common” allosteric site in five subtypes of muscarinic receptors and targeted for design of novel allosteric modulators (12, 16). Site 1 has also been identified in both β1AR and β2AR through FTMAP analysis of the cMD trajectory ensembles (18). Moreover, in the aMD simulation highly dynamic fluctuations were observed in ECL2 that can close/open the extracellular mouth. This is in agreement with previous experimental study (13), showing that ECL2 acts as a “gatekeeper” modulating the accessibility of the orthosteric site.
Therefore, Site 1 is an important target site for designing allosteric drugs that may inhibit the binding of orthosteric ligands from extracellular medium or dissociation of the bound antagonist/agonist. Design of “dualsteric” or bitopic ligands that bind both the orthosteric site and allosteric Site 1 simultaneously has also become a new strategy to trigger activation of the M2 receptor through restricting the spatial flexibility of the extracellular vestibule (15, 16).
Site 2: lipid-exposed pocket formed by TM5 and TM6
Allosteric Site 2 is located in a lipid-exposed pocket formed by the TM5 and TM6 helices (Fig. 4A). It is identified in the receptor X-ray structure, as well as the simulation-derived inactive conformer. As shown in Fig. 4B, probe molecules that bind Site 2 interact with residues Met2025.54, Tyr2065.58, Leu3936.41 and Ile3976.45 in the inter-helical pocket. During activation of the M2 receptor, Trp4006.48 (referred to as the “toggle switch” in many GPCRs) moves towards Phe1955.47 and Val1995.51(6) with the distances between Trp4006.48-Val1995.51 and Tyr2065.58-Ile3976.45 decreased (see Fig. S3). This conformational change disrupts the TM5-TM6 interface and thus Site 2 disappears in the intermediate and active conformers of the M2 receptor (Figs. 2C-E). Furthermore, previous study of the β1AR and β2AR also showed the absence of Site 2 (18). These findings suggest that the presence of Site 2 is highly dependent on local conformations of the interfacial residues between TM5 and TM6. Allosteric modulators that bind Site 2 with high affinity are likely to stabilize the TM5-TM6 interface in the inactive M2 receptor and thus inhibit activation of the receptor.
Fig. 4.
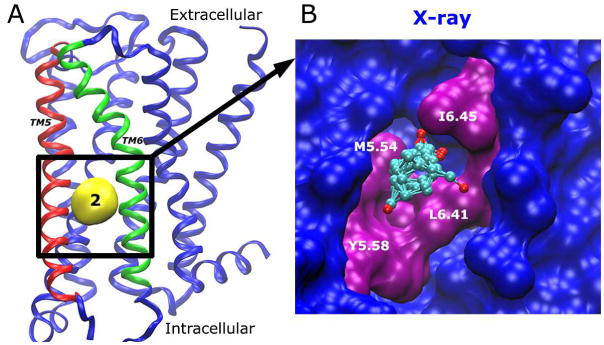
(A) Allosteric Site 2 is located between TM5-TM6 on the lipid-exposed side. TM5 and TM6 are highlighted in red and green, respectively. (B) The key residues that interact with bound probes (ball-and-sticks) are labeled and highlighted in purple.
Sites 3 and 4: lipid-exposed pockets formed by TM3 and TM4
Allosteric sites 3 and 4 are lipid-exposed pockets formed by the TM3 and TM4 helices in the extracellular and intracellular regions, respectively. As shown in Fig. 5A, Site 3 comprises of two subsites (denoted 31 and 32) that are separated by TM3. As transient and shallow surface pockets, the two subsites 31 and 32 are not detectable in either the X-ray structure or the simulation-derived inactive conformer, but only found in the intermediate 2 and active conformers. Site 4 is also composed of two subsites (denoted 41 and 42 in Fig. 5A), which undergo large variations between different representative receptor conformers as well (Fig. 2).
Fig. 5.
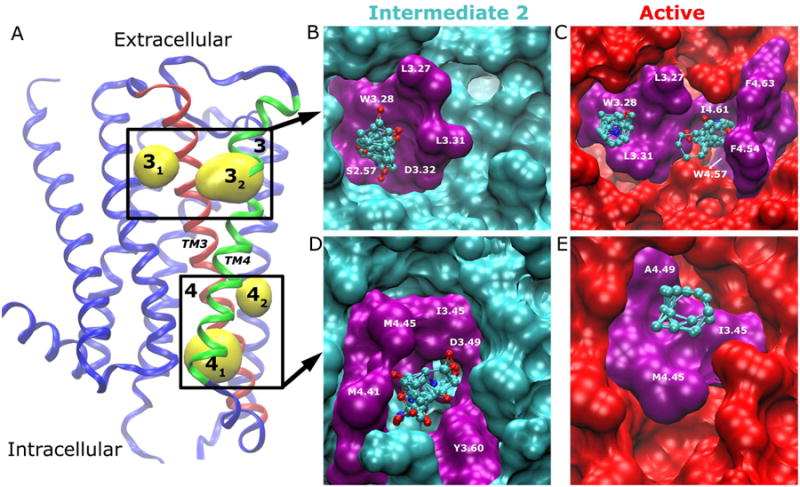
(A) Allosteric sites 3 and 4 are located in the lipid-exposed pockets formed by the TM3 (red)-TM4 (green) extracellular and intracellular domains, respectively. The receptor is rotated from Fig. 2 by 180° along the main axis of the TM bundle for better view of the two sites. The key residues that interact with bound probes (ball-and-sticks) are labeled and highlighted in purple for Site 3 in (B) intermediate 2 and (C) active conformers, and similarly for Site 4 in (D)-(E).
As shown in Fig. 5B, probe molecules that bind subsite 32 interact mainly with residues Leu983.27, Trp993.28, Leu1023.31 and Val1053.34 in the receptor intermediate 2 conformer. Subsite 32 is not detected in the intermediate 2 conformer, which has a flat receptor surface between TM3 and TM4 (Fig. 5B). In the active conformer, both subsites 31 and 32 appear with bound probe molecules interacting with additional residues Phe1524.54, Trp1554.57, Ile1594.61 and Phe1614.63 in subsite 32 (see Fig. 5D). Overall, subsite 32 is highly transient with rapid fluctuation, largely due to dynamic motions of the TM4 helix on the receptor surface (Fig. S4).
Site 4 exhibits similar dynamic changes in the two subsites through aMD simulation. In each of the simulation-derived representative conformers, either subsite 41 or 42 appears (Fig. 2). The two subsites are separated by residues Ile1163.45 and Met1434.45. Bound Probe molecules interact with these two residues in both subsites, plus residues Asp1203.49, Tyr1313.60, Met1394.41 and Met1434.45 in subsite 41 (Fig. 5D) and residue Ala1474.49 in subsite 42 (Fig. 5E). Particularly, hydrophilic probes including isopropanol and isobutanol form H-bonding interactions with Asp1203.49 and Tyr1313.60 in subsite 41, and hydrophobic interactions involving cyclohexane and benzene with Ile1163.45 and Ala1474.49 in subsite 42.
Subsites 41 and 42 were considered as two separate allosteric sites in previous study of β1AR and β2AR, i.e., Sites 3 and 5 in Ref. (18). Here, we cluster them into Site 4 because they involve the same secondary structures (TM3 and TM4) and are located very close to each other with the probe clusters separated by only ∼5 Å apart (see Fig. 5). Bound probe molecules that correspond to fragments of potential drugs in the two subsites can be connected by a short linker.
Sites 5 and 6: lipid-exposed pockets between TM1, TM2 and TM7
Allosteric sites 5 and 6 are lipid-exposed pockets located between the TM1, TM2 and TM7 helices in their extracellular and intracellular regions, respectively (Fig. 6A). Both sites are not detected in the receptor X-ray structure or the simulation-derived inactive conformer (Fig. 2). Site 5 appears in the intermediate 2 conformer with two subsites 51 and 52 observed (Fig. 6A). Site 6 is found in all intermediate and active conformers, which exhibit inward displacement of the NPxxY motif in the intracellular domain of TM7 relative to the inactive receptor conformation (6). Site 6 is also composed of two neighboring subsites (61 and 62) as shown in Fig. 6A.
Fig. 6.
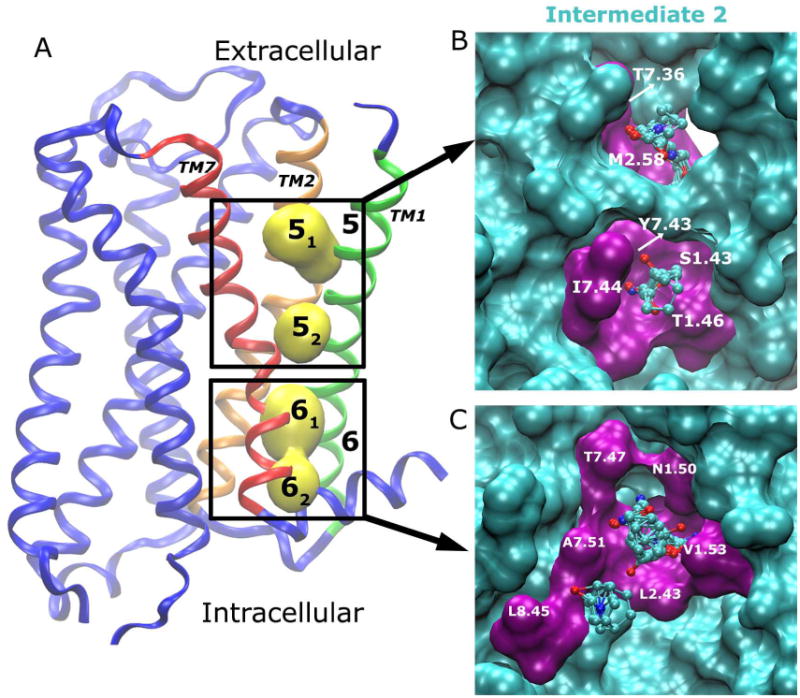
Allosteric sites 5 and 6 are located between TM7 (red)-TM1 (green)/TM2 (orange) in the lipid-exposed extracellular and intracellular regions, respectively. The key residues that interact with bound probes (ball-and-sticks) are labeled and highlighted in purple for (B) Site 5 and (C) Site 6 in the intermediate 2 conformer.
In the intermediate 2 conformer, probe molecules that bind subsite 51 include acetone, isopropanol and ethane. They interact mainly with residues Thr4237.36 and Met772.58. In subsite 52, bound probe molecules including acetamide and isobutanol are H-bonded to residues Ser341.43, Thr371.46, and Tyr4307.43, and cyclohexane forms hydrophobic interactions with Ile4317.44 (Fig. 6B).
The two subsites 61 and 62 are separated by residues Leu622.43 and Ala4387.51. Bound probe molecules interact with residues Asn411.50, Val441.53, Leu622.43, Thr4347.47, Ala4387.51 and Leu4428.45 (Fig. 6C). H-bond interactions are formed between probe molecules and side chains of Thr4347.47 and Asn411.50 residues and backbone of Ala4387.51. Hydrophobic probe molecules including benzene and cyclohexane are found interacting with residues Leu622.43 and Leu4428.45 in subsite 62.
In FTMAP analysis of the β1AR and β2AR (18), a “U”-shaped cavity was found between the extracellular ends of TM1 and TM7, which corresponds to Site 5 identified here in the M2 receptor. However, Site 6 was not seen in either β1AR or β2AR. This finding could be due to the fact that β1AR and β2AR were trapped in the inactive state during 240 ns cMD simulations. Thus exposure of Site 6 that requires inward displacement of the TM7 intracellular domain was not observed in previous study of β1AR and β2AR.
Site 7: Intracellular mouth
Allosteric Site 7 is located in the solvent-exposed intracellular mouth between the cytoplasmic ends of the TM3, TM5, TM6 and TM7 helices. This site is well known as the G-protein-coupling site that binds the G protein for various down-stream signaling processes. In the inactive X-ray structure, Site 7 is not present with the intracellular mouth closed (6), precluding the binding of probe molecules (Fig. 7A). Site 7 is detected in the simulation-derived inactive conformer with 9 probe molecules bound (see Figs. 2B and S2A). In the active conformer, it appears at a larger size with 14 probe molecules bound (see Figs. 2E and S2D), for which the cytoplasmic end of TM6 tilts outwards by ∼6Å. The receptor intracellular mouth opens up such that it can accommodate the C-terminal peptide of the G-protein α subunit (GαCT) (6) or bind more probe molecules. In comparison, Site 7 is not detected in the intermediate conformers. This is due to the fact that the intracellular domain of the TM7 helix (the NPxxY motif) moves inwards by ∼4 Å during the inactive-to-intermediate transition while the TM6 cytoplasmic end has not tilted outwards to open up the intracellular mouth.
Fig. 7.
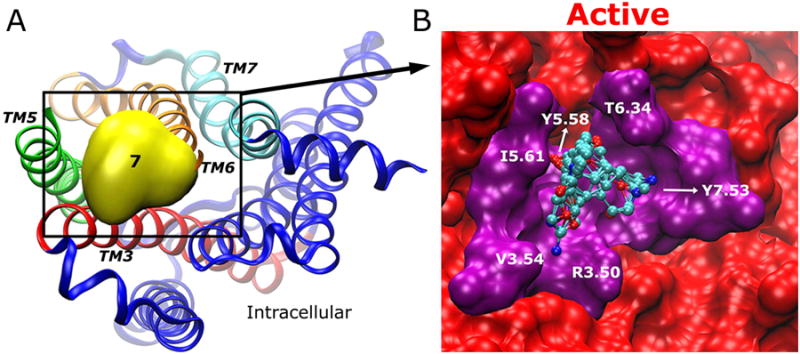
(A) Allosteric Site 7 is located between TM3 (red)-TM5 (green)-TM6 (orange)-TM7 (cyan) in the intracellular mouth. In the X-ray structure, Site 7 clashes with TM6 that maintains strong interactions with TM3, precluding the binding of probe molecules. (B) In the active conformer, the bound probe molecules (ball-and-sticks) mainly interact with Arg1213.50, Val1253.54, Tyr2065.58, Ile2095.61, Thr3866.34 and Tyr4407.53 as highlighted in purple.
As shown in Fig. 7B, all 16 probe molecules except acetone and acetonitrile are found in Site 7, interacting with residues Arg1213.50, Val1253.54, Tyr2065.58, Ile2095.61, Thr3866.34 and Tyr4407.53. In the receptor active state, residues Tyr2065.58 and Tyr4407.53 form a hydrogen bond, providing a “structural base” for binding the probe molecules. The breaking of salt bridge between Arg1213.50-Glu3826.30 contributes to opening of the intracellular mouth and exposure of Site 7 (6).
Conclusions
Because residues in the orthosteric site that bind GPCR endogenous ligands have evolved to be highly conserved across different subtypes, design of orthosteric receptor-selective drugs has been challenging. Alternatively, development of allosteric modulators that target at non-orthosteric sites has emerged as a new paradigm to search for subtype-specific drugs in the GPCR pharmaceutical research (11). Such effort requires detailed understanding of the different conformational states of GPCRs during their biological function and the pathway of receptor activation for allosteric regulation of the signaling process between extracellular ligand-binding and intracellular G-protein-coupling sites. Important structural insights have been obtained through recent X-ray crystallographic breakthroughs in the GPCR field, notably on inactive and active structures of rhodopsin (28, 29) and β2AR (30, 31). However, the crystal structures are rather static snapshots of highly dynamic GPCRs, i.e., low-energy populated states in their activation pathway (32). It is demanding to account for GPCR flexibility for mapping druggable binding sites and design of allosteric modulators.
Computational cMD simulations have been performed on the β1AR and β2AR to explore the receptor flexibility and map the druggable allosteric sites in the two receptors using FTMAP (18). Five allosteric sites were identified from the 240 ns cMD trajectory ensembles. Some of the sites were not detected in the X-ray structures and one of them is specific to β2AR. However, these cMD simulations still suffer from incomplete conformational sampling on GPCRs. The receptors remain inactive and representative structures selected from the simulations are not able to capture intermediate and active states of the receptors. Furthermore, much longer cMD simulations on the tens-of-microsecond timescales have been performed on β2AR (19, 33). Starting from the active X-ray structure, the β2AR transitioned into the inactive conformation upon removal of the G-protein or its mimetic nanobody, and an intermediate was identified in the transition pathways. However, activation of GPCRs from the inactive state has been shown experimentally to occur on millisecond timescales (34) that are still beyond the latest GPCR cMD simulations.
We recently performed hundreds-of-nanosecond aMD simulations on the M2 receptor and directly observed activation of the receptor in a ligand-free form (6). In this study, druggable binding sites are identified by mapping the X-ray structure and the simulation-derived inactive, intermediate and active conformers of the M2 receptor. Seven allosteric sites are found in the receptor including two solvent-exposed pockets (i.e., Sites 1 and 7 in the extracellular and intracellular mouth regions, respectively) and five lipid-exposed cavities (i.e., Site 2 between TM5-TM6, Sites 3 and 4 formed by the extracellular and intracellular domains of TM3-TM4, and Sites 5 and 6 between TM7-TM1/TM2). While Site 1 exists in all conformers of the receptor, most of the other sites appear transiently during the receptor activation. For example, Site 2 that is seen only in the inactive state disappears upon receptor activation due to conformational changes of the “toggle switch” in the TM5-TM6 interface. In contrast, Site 6 that is not detected in the inactive state appears when the receptor transitions into the intermediate and active conformers with inward displacement of the NPxxY motif in TM7. These allosteric sites serve as promising target sites for designing allosteric modulators that might bind to each site with differential binding affinity and stabilize the receptor in the corresponding conformation. In this context, the RCS approach combined with aMD simulation enables enhanced sampling of GPCRs and fully accounts for the receptor flexibility to explore the receptor allosteric sites and design receptor-selective drugs.
Supplementary Material
Acknowledgments
This work was supported by the National Science Foundation (NSF grant MCB1020765), National Institutes of Health (NIH grant GM31749), Howard Hughes Medical Institute, Center for Theoretical Biological Physics (CTBP), and National Biomedical Computation Resource (NBCR). Computing time was provided on the Gordon and Stampede supercomputers by the Extreme Science and Engineering Discovery Environment (XSEDE) Award TG-MCA93S013.
Footnotes
Conflict of Interest: The authors declare that there is no conflicts of interests.
References
- 1.Kow RL, Nathanson NM. Structural biology: Muscarinic receptors become crystal clear. Nature. 2012;482:480–1. doi: 10.1038/482480a. [DOI] [PubMed] [Google Scholar]
- 2.Lappano R, Maggiolini M. G protein-coupled receptors: novel targets for drug discovery in cancer. Nat Rev Drug Discov. 2011;10:47–60. doi: 10.1038/nrd3320. [DOI] [PubMed] [Google Scholar]
- 3.Spalding TA, Burstein ES. Constitutive activity of muscarinic acetylcholine receptors. J Recept Sig Transd. 2006;26:61–85. doi: 10.1080/10799890600567349. [DOI] [PubMed] [Google Scholar]
- 4.Haga K, Kruse AC, Asada H, Yurugi-Kobayashi T, Shiroishi M, Zhang C, et al. Structure of the human M2 muscarinic acetylcholine receptor bound to an antagonist. Nature. 2012;482:547–51. doi: 10.1038/nature10753. [DOI] [PMC free article] [PubMed] [Google Scholar]
- 5.Kruse AC, Hu J, Pan AC, Arlow DH, Rosenbaum DM, Rosemond E, et al. Structure and dynamics of the M3 muscarinic acetylcholine receptor. Nature. 2012;482:552–6. doi: 10.1038/nature10867. [DOI] [PMC free article] [PubMed] [Google Scholar]
- 6.Miao Y, Nichols SE, Gasper PM, Metzger VT, McCammon JA. Activation and dynamic network of the M2 muscarinic receptor. Proc Natl Acad Sci U S A. 2013;110:10982–7. doi: 10.1073/pnas.1309755110. [DOI] [PMC free article] [PubMed] [Google Scholar]
- 7.Ballesteros JA, Weinstein H. Integrated methods for the construction of three-dimensional models and computational probing of structure-function relations in G protein-coupled receptors. In: Stuart CS, editor. Integrated methods for the construction of three-dimensional models and computational probing of structure-function relations in G protein-coupled receptors. Academic Press; 1995. pp. 366–428. [Google Scholar]
- 8.Bymaster FP, Carter PA, Peters SC, Zhang W, Ward JS, Mitch CH, et al. Xanomeline compared to other muscarinic agents on stimulation of phosphoinositide hydrolysis in vivo and other cholinomimetic effects. Brain Res. 1998;795:179–90. doi: 10.1016/s0006-8993(98)00267-4. [DOI] [PubMed] [Google Scholar]
- 9.Jones CK, Brady AE, Davis AA, Xiang ZX, Bubser M, Tantawy MN, et al. Novel Selective Allosteric Activator of the M(1) Muscarinic Acetylcholine Receptor Regulates Amyloid Processing and Produces Antipsychotic-Like Activity in Rats. J Neurosci. 2008;28:10422–33. doi: 10.1523/JNEUROSCI.1850-08.2008. [DOI] [PMC free article] [PubMed] [Google Scholar]
- 10.Christopoulos A. Allosteric binding sites on cell-surface receptors: Novel targets for drug discovery. Nat Rev Drug Discovery. 2002;1:198–210. doi: 10.1038/nrd746. [DOI] [PubMed] [Google Scholar]
- 11.Jeffrey Conn P, Christopoulos A, Lindsley CW. Allosteric modulators of GPCRs: a novel approach for the treatment of CNS disorders. Nat Rev Drug Discov. 2009;8:41–54. doi: 10.1038/nrd2760. [DOI] [PMC free article] [PubMed] [Google Scholar]
- 12.Gregory KJ, Sexton PM, Christopoulos A. Allosteric modulation of muscarinic acetylcholine receptors. Current neuropharmacology. 2007;5:157–67. doi: 10.2174/157015907781695946. [DOI] [PMC free article] [PubMed] [Google Scholar]
- 13.Avlani VA, Gregory KJ, Morton CJ, Parker MW, Sexton PM, Christopoulos A. Critical role for the second extracellular loop in the binding of both orthosteric and allosteric g protein-coupled receptor Ligands. J Biol Chem. 2007;282:25677–86. doi: 10.1074/jbc.M702311200. [DOI] [PubMed] [Google Scholar]
- 14.Antony J, Kellershohn K, Mohr-Andra M, Kebig A, Prilla S, Muth M, et al. Dualsteric GPCR targeting: a novel route to binding and signaling pathway selectivity. Faseb J. 2009;23:442–50. doi: 10.1096/fj.08-114751. [DOI] [PubMed] [Google Scholar]
- 15.Valant C, Lane JR, Sexton PM, Christopoulos A. The Best of Both Worlds? Bitopic Orthosteric/Allosteric Ligands of G Protein-Coupled Receptors. Annual Review of Pharmacology and Toxicology, vol 52. 2012;52:153–78. doi: 10.1146/annurev-pharmtox-010611-134514. [DOI] [PubMed] [Google Scholar]
- 16.Bock A, Merten N, Schrage R, Dallanoce C, Batz J, Klockner J, et al. The allosteric vestibule of a seven transmembrane helical receptor controls G-protein coupling. Nat Commun. 2012;3:1044. doi: 10.1038/ncomms2028. [DOI] [PMC free article] [PubMed] [Google Scholar]
- 17.Ngan CH, Bohnuud T, Mottarella SE, Beglov D, Villar EA, Hall DR, et al. FTMAP: extended protein mapping with user-selected probe molecules. Nucleic Acids Res. 2012;40:W271–W5. doi: 10.1093/nar/gks441. [DOI] [PMC free article] [PubMed] [Google Scholar]
- 18.Ivetac A, McCammon JA. Mapping the Druggable Allosteric Space of G-Protein Coupled Receptors: a Fragment-Based Molecular Dynamics Approach. Chem Biol Drug Des. 2010;76:201–17. doi: 10.1111/j.1747-0285.2010.01012.x. [DOI] [PMC free article] [PubMed] [Google Scholar]
- 19.Dror RO, Arlow DH, Borhani DW, Jensen MO, Piana S, Shaw DE. Identification of two distinct inactive conformations of the beta2-adrenergic receptor reconciles structural and biochemical observations. Proc Natl Acad Sci U S A. 2009;106:4689–94. doi: 10.1073/pnas.0811065106. [DOI] [PMC free article] [PubMed] [Google Scholar]
- 20.Amaro RE, Baron R, McCammon JA. An improved relaxed complex scheme for receptor flexibility in computer-aided drug design. J Comput Aid Mol Des. 2008;22:693–705. doi: 10.1007/s10822-007-9159-2. [DOI] [PMC free article] [PubMed] [Google Scholar]
- 21.Lin JH, Perryman AL, Schames JR, McCammon JA. Computational drug design accommodating receptor flexibility: The relaxed complex scheme. J Am Chem Soc. 2002;124:5632–3. doi: 10.1021/ja0260162. [DOI] [PubMed] [Google Scholar]
- 22.Lin JH, Perryman AL, Schames JR, McCammon JA. The relaxed complex method: Accommodating receptor flexibility for drug design with an improved scoring scheme. Biopolymers. 2003;68:47–62. doi: 10.1002/bip.10218. [DOI] [PubMed] [Google Scholar]
- 23.Shaw DE, Maragakis P, Lindorff-Larsen K, Piana S, Dror RO, Eastwood MP, et al. Atomic-level characterization of the structural dynamics of proteins. Science. 2010;330:341–6. doi: 10.1126/science.1187409. [DOI] [PubMed] [Google Scholar]
- 24.Markwick PRL, McCammon JA. Studying functional dynamics in bio-molecules using accelerated molecular dynamics. Phys Chem Chem Phys. 2011;13:20053–65. doi: 10.1039/c1cp22100k. [DOI] [PubMed] [Google Scholar]
- 25.Hamelberg D, Mongan J, McCammon JA. Accelerated molecular dynamics: A promising and efficient simulation method for biomolecules. J Chem Phys. 2004;120:11919–29. doi: 10.1063/1.1755656. [DOI] [PubMed] [Google Scholar]
- 26.Pierce LCT, Salomon-Ferrer R, de Oliveira CAF, McCammon JA, Walker RC. Routine Access to Millisecond Time Scale Events with Accelerated Molecular Dynamics. J Chem Theory Comput. 2012;8:2997–3002. doi: 10.1021/ct300284c. [DOI] [PMC free article] [PubMed] [Google Scholar]
- 27.Kobilka B. The Structural Basis of G-Protein-Coupled Receptor Signaling (Nobel Lecture) Angewandte Chemie International Edition. 2013:2–11. doi: 10.1002/anie.201302116. [DOI] [PMC free article] [PubMed] [Google Scholar]
- 28.Scheerer P, Park JH, Hildebrand PW, Kim YJ, Krausz N, Choe HW, et al. Crystal structure of opsin in its G-protein-interacting conformation. Nature. 2008;455:497–502. doi: 10.1038/nature07330. [DOI] [PubMed] [Google Scholar]
- 29.Park JH, Scheerer P, Hofmann KP, Choe HW, Ernst OP. Crystal structure of the ligand-free G-protein-coupled receptor opsin. Nature. 2008;454:183–7. doi: 10.1038/nature07063. [DOI] [PubMed] [Google Scholar]
- 30.Rasmussen SGF, DeVree BT, Zou Y, Kruse AC, Chung KY, Kobilka TS, et al. Crystal structure of the [bgr]2 adrenergic receptor-Gs protein complex. Nature. 2011;477:549–55. doi: 10.1038/nature10361. [DOI] [PMC free article] [PubMed] [Google Scholar]
- 31.Rasmussen SGF, Choi HJ, Fung JJ, Pardon E, Casarosa P, Chae PS, et al. Structure of a nanobody-stabilized active state of the [bgr]2 adrenoceptor. Nature. 2011;469:175–80. doi: 10.1038/nature09648. [DOI] [PMC free article] [PubMed] [Google Scholar]
- 32.Deupi X, Kobilka BK. Energy Landscapes as a Tool to Integrate GPCR Structure, Dynamics, and Function. Physiology. 2010;25:293–303. doi: 10.1152/physiol.00002.2010. [DOI] [PMC free article] [PubMed] [Google Scholar]
- 33.Dror RO, Arlow DH, Maragakis P, Mildorf TJ, Pan AC, Xu H, et al. Activation mechanism of the β2-adrenergic receptor. Proc Natl Acad Sci U S A. 2011;108:18684–9. doi: 10.1073/pnas.1110499108. [DOI] [PMC free article] [PubMed] [Google Scholar]
- 34.Vilardaga JP, Bunemann M, Krasel C, Castro M, Lohse MJ. Measurement of the millisecond activation switch of G protein-coupled receptors in living cells. Nat Biotech. 2003;21:807–12. doi: 10.1038/nbt838. [DOI] [PubMed] [Google Scholar]
Associated Data
This section collects any data citations, data availability statements, or supplementary materials included in this article.