

Abstract
This Review focuses on recent work in the field of paper microfluidics that specifically addresses the goal of translating the multistep processes that are characteristic of gold-standard laboratory tests to low-resource point-of-care settings. A major challenge is to implement multistep processes with the robust fluid control required to achieve the necessary sensitivity and specificity of a given application in a user-friendly package that minimizes equipment. We review key work in the areas of fluidic controls for automation in paper-based devices, readout methods that minimize dedicated equipment, and power and heating methods that are compatible with low-resource point-of-care settings. We also highlight a focused set of recent applications and discuss future challenges.
For accurate and reliable disease detection, many gold-standard diagnostic methods rely on multistep sample preparation and analysis techniques that require expensive laboratory equipment and trained technicians. Thus, these tests are not appropriate for point-of-care (POC) use, especially in low-resource settings, and are not available to populations who need them most. Over the last two decades, research and development in the field of microfluidics has made advances in the miniaturization, automation and cost-reduction of gold-standard laboratory-based sample processes, in order to make them appropriate for POC applications [1]. Traditionally, POC diagnostic tests were designed as single-use chips composed of plastics, polydimethylsiloxane or silicon that utilized the many advantages of microfluidics, including requiring only small sample and reagent volumes and having a rapid time to result [2]. In recent years, there has been an explosion of interest in the use of porous materials in POC diagnostic devices. The Whitesides group is responsible for generating much of this interest, starting with their demonstration in 2007 of using patterned cellulose to simultaneously detect glucose and protein in urine samples [3] and continuing with multiple contributions on detection using microfluidic paper-based analytical devices (μPADs) ([4–6], earlier work is reviewed in [7]). Since then, there have been many advances in the still growing subfield of ‘porous network microfluidics’ or ‘paper microfluidics’. Specifically, we define a ‘paper’ (the term ‘paper’ is defined broadly here to include porous membranes such as nitrocellulose) or ‘porous network’ as a device that exclusively uses capillary pressure to drive flow in the porous matrix of which it is composed, for the automatic pumping of fluid within the device. These networks are most often composed of the porous materials used in the conventional lateral flow industry: cellulose and nitrocellulose [8,9]. These porous network devices share other attributes of the conventional lateral flow test (LFT); namely they are disposable, have a rapid time to result, are composed of inexpensive materials, and can be cost effective to manufacture.
In recent years there have been multiple reviews focused on work in paper microfluidics. Ballerini et al. reviewed the increased functionality and variety of paper-based materials for the development of POC diagnostics [10]. Li et al. have described the various fabrication techniques and some applications for paper-based technologies [11], while other reviews have focused specifically on paper-based device fabrication via ink-jet printing or toner transfer methods [12]. Nie et al. and Maxwell et al. separately described electrochemical sensing techniques in paper-based devices [13,14], while Liana et al. took a broader perspective focusing on recent advances in all paper-based sensing technologies and the need to increase device sensitivity [15]. There have also been recent reviews on the challenges of transferring traditional plastic-based electronics to paper-based formats [16], as well as the development of LFTs for the detection of contaminated food [17]. Shah et al. reviewed the development of an entire paper-based analytical kit for biomarker and bacterial detection at the POC [18]. Kuo et al. described the emerging trend of hybrid devices that utilize the advantages of different substrates in one combined effective device [19]. Additionally, developments in materials science that are relevant to paper microfluidics have been reviewed recently [20–22], including a discussion of the advantages of paper as a material for devices [23]. Most recently, Yetisen et al. have reviewed multiple areas in the field of paper microfluidics, including device fabrication, device capabilities, detection techniques on paper and quantitative handheld readout systems [24]. Although this is not a comprehensive list of porous membrane-based devices reviews, it is representative of the breadth of literature surrounding paper microfluidics and indicates the rapidly growing interest in the field.
In this Review, we focus on recent work in the field that specifically addresses the goal of translating the multistep processes that are characteristic of gold-standard laboratory tests to low-resource POC settings. There are specific constraints that must be addressed when designing tests that are appropriate for use in these settings. For example, the often lengthy time to result of many laboratory-based diagnostic tests can be inappropriate in low-resource settings, where requiring patients to make at least two visits before getting diagnosed may be impractical [25]. These tests need to be affordable, specific, sensitive, user-friendly, rapid and robust, equipment-free and deliverable (or ‘ASSURED’) [26]. Thus, a major challenge is to implement multistep processes with the robust fluid control required to achieve the necessary sensitivity and specificity of a given application in a user-friendly package that minimizes equipment. We review key work in the areas of fluidic controls for automation in paper-based devices, readout methods that minimize dedicated instrumentation, and power and heating methods which are compatible with low-resource POC settings. Finally, we highlight a focused set of recent applications and discuss future challenges.
Fluidic controls for automation in paper-based devices
A major challenge in creating POC diagnostic tests that are appropriate for applications in low-resource settings is to achieve precise and robust automated fluidic control of the multiple fluid sources in an assay. As in conventional lateral flow assays, properties of the porous materials, including pore size, pore structure and surface treatments, affect the delivery of reagents in an assay. These considerations have been discussed previously in the context of conventional LFTs and will not be discussed here [27]. Recently, a number of tools have been developed to control fluid flow in porous network devices. These tools serve to replace the costly and often complicated valves and pump controls in conventional microfluidics. This section will discuss fluidic controls for automation in porous network devices including network topology, channel geometry for changing flow rates, on-switches or delays for flow, off-switches for flow, and spatial and temporal controls for manipulating rehydrated reagents.
Network topology for the sequential delivery of multiple fluids
Networks with multiple inlets for each outlet have been developed to perform the automatic sequential delivery of multiple fluids to a detection region [28–31]. Fu et al. have demonstrated a simple three-inlet 2D paper network (2DPN), shown in Figure 1, in which fluids, after being applied simultaneously to the inlets, are staged in the main horizontal leg of the device, and then delivered sequentially to the detection region [28]. The dimensions of the network can be used to accommodate different volumes of fluids and the number of inlets increased to accommodate a greater number of reagents.
Figure 1. 2D paper networks with multiple inlets per detection region for automated multistep sample processing.
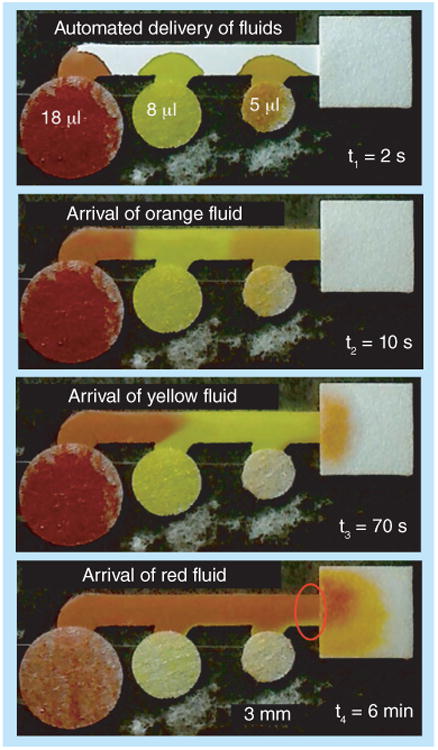
The sequential delivery of multiple fluid volumes has been pre-programmed into the configuration of the network.
Reproduced with permission from [28] © Elsevier.
Please see colour figure at www.Futuremedicine.com/doi/suppl/10.4155/Bio.13.243
More recently, Dharmaraja et al. demonstrated that sequential delivery can be achieved through the use of a Pseudo-1DPN [32]. This format consists of a linear strip composed of a porous material and multiple fluid-filled wells as sources. As in the case of the 2DPN above, the contents of the sources are delivered sequentially to the detection region in order of distance from the detection region. The authors presented an electrical circuit model for explaining the sequential delivery of the multiple fluids in the strip as a balance of the capillary pressures and fluidic resistances in the system. An alternative source used in conventional LFTs that may be more appropriate than fluid-filled wells for the lowest-resource settings are porous pads. Pad sources were also used to produce clean sequential delivery when the fluidic resistances between the pads were made sufficiently large by increasing the interpad spacing.
Channel geometry to control flow rates
A key method for controlling the flow rate in porous channels is to vary the geometry of the channel. Flow in 1D lateral flow strips is well characterized. The 1D transport of the fluid front in a porous matrix during wet-out is characterized by the Lucas–Washburn equation:
| Equation 1 |
where L is the distance moved by the fluid front, t is time, D is the average pore diameter, γ is the effective surface tension, cosθ is the contact angle dependence, and μ is viscosity [33–35] (for review on the physics of paper see Alava and Niskanen [36]). Therefore, in a constant width strip:
| Equation 2 |
the length of the strip can be used to control the interaction time between reagents in an assay. Additionally, the volumetric flow rate can be adjusted by varying the width of the strip [37]. In an extension to 2D structures, Medina et al. investigated imbibition in triangular shapes of blotting paper and characterized the deviation from Lucas-Washburn flow [38]. Recently, Fu et al. have described the use of simple 2D geometries to control the flow rates of fluids and presented some basic design rules for transport in paper networks [37]. For example, in the case of an expansion in geometry, a transition to a greater width results in an increase in the transport time of the fluid front relative to that in a constant width strip. The complementary result for the case of a contraction, a transition to a smaller width, is that the transport time of the fluid front is decreased relative to that in a constant-width strip. Thus, a simple control parameter for regulating the transport time of the fluid front is the downstream location of the expansion or contraction. In addition, the width of the expansion or contraction can be used to further adjust the transport time.
In the case of fully wetted flow, when the fluid front has reached a wicking pad, an absorbent pad used to wick additional fluid through the substrate, the velocity is approximately steady and is described by Darcy's Law. In 1D, Darcy's Law reduces to:
| Equation 3 |
where Q is the volumetric flow rate, κ is the permeability of the material to the fluid, A is the area of the channel perpendicular to flow, μ is the viscosity of the fluid, and ΔP is the pressure difference along the direction of flow over the length L [39]. An analogy to electrical circuits can be useful, where pressure difference is analogous to electrical potential difference, the volumetric flow rate is analogous to current, and the fluidic resistance depends on physical parameters of the system, including geometric factors in the paper circuit. Extension to simple 2D geometries is straightforward; fluidic resistances in series are summed while fluidic resistances in parallel can be added in reciprocals. Fu et al. presented a description of how one can predict and control flow rates for simple changes in geometry, such as those in Figure 2 [37]. A time series comparison of experimental and simulation results for flow in the strips of different geometries indicates good quantitative agreement [37]. Furthermore, simple manipulation of inlet leg length and width were used to control the time of reagent delivery in a 2DPN [37].
Figure 2. Experimental (left) and model (right) results for fully wetted flow into a wicking pad show good agreement.
Reproduced with permission from [37] © Springer (2011).
Mendez et al. employed complex paper shaping to adjust the flow rate in their devices [40]. Specifically, they used fan shapes located downstream of a rectangular strip, as shown in Figure 3, to achieve the quasi-stationary flow of conventional lateral flow strips that use cellulose wicking pads. Once fluid reaches the fan-shaped section, there is a sudden increase in the volume of available dry porous media, similar to the situation in a wicking pad, and the transport of the fluid front within the rectangular stem transitions from Lucas–Washburn to quasi-stationary. A significant advantage of this method is potential simplification to device fabrication and manufacturing by requiring only a single material. Additionally, quasi-stationary flow can enable approximately constant reaction time within porous membrane-based assays.
Figure 3. Velocity data from a complex shape used by Mendez et al. to adjust the flow rate in their nitrocellulose devices.
Reproduced with permission from [40] © American Chemical Society (2010).
On-switches/delays to control the arrival time of fluids
Another key fluidic control is the ability to delay the downstream arrival of a given fluid for a specific amount of time. As described above, the use of network topology and channel geometry can be used to achieve sequential delivery, but for the case of larger reagent volumes, these methods can significantly increase the footprint of the device. Thus, alternative paper fluidic tools that act as an on-switch, or a timed fluid flow delay, are critical. Several methods have been developed and will be discussed in this section. These include methods that do not require any user intervention, such as dissolvable barriers and hydrophobic surface treatments, as well as user-activated methods, including folding tabs and push buttons.
One type of on-switch or delay for fluid flow uses dissolvable barriers. Lutz et al. have demonstrated that a dissolvable sugar barrier will produce a delay in the transport time of fluid relative to if the barrier were absent [41]. Both the extent of the sugar barrier and the concentration of the sugar solution used to form the barrier within the porous material can be used to control the delay time.
Delays from seconds to almost an hour were achieved with measured variability in arrival times between 9 and 19% [41]. One potential issue with this method is the effect of the barrier components on downstream processes. For example, low concentrations of sugar, such as trehalose, are used for the preservation of dry reagents and are generally compatible with common signal-generation schemes for LFTs. However, the impact of higher concentrations of sugar, as employed by the barrier for longer delay times, on signal generation should be considered. Another potential issue for the use of higher sugar concentration barriers is the effect on sample and reagent fluid flow downstream of the barrier due to increased fluid viscosity. A second type of on-switch for flow is based on the use of hydrophobic and hydrophilic coatings to control the wetting properties of the substrate. Noh et al. controlled flow rate using a hydrophobic wax coating on the cellulose substrate to affect the wettability of the cellulose and reduce the flow rate in a wax-treated region [42]. A wide range of delays were demonstrated, from 30 s to over 1 h, with increasing time delays achieved by depositing increasing quantities of wax [42], as shown in Figure 4. The use of multiple wax-treated regions in series provided fine-level control of flow rate within a device. Chen et al. employed hydrophobic and hydrophilic coatings to develop a single-use fluidic diode [43]. In their diode design, a hydrophobic barrier separates two channels with surfactant deposited on only one side of the barrier. Thus, fluid flow can be switched on in the direction in which surfactant is rehydrated before reaching the hydrophobic barrier; the rehydrated surfactant enables the fluid to cross the previously hydrophobic barrier. No flow is allowed in the other direction unless triggered, as shown in Figure 5. As in the case of the dissolvable barriers, the effect of the released chemical, in this case the bolus of surfactant, on downstream processes should be considered. A third method for creating a delay of fluid flow was demonstrated by Toley et al. They demonstrated delays of fluid flow in nitrocellulose channels by using a parallel piece of cellulose to wick fluid from the nitrocellulose channel. The delay time could be varied by manipulating the length and thickness of the cellulose piece. Delays of up to approximately 18 min were demonstrated with coefficients of variation in delay times of less than 10% [Toley B, McKenzie B, Liang T, Buser J, Yager P, Fu E. Tunable-delay shunts for paper microfluidic devices. Accepted to Analytical Chemistry (2013), Unpublished Data].
Figure 4. Plot demonstrates the ability to vary the delay time through the amount of wax deposited onto the substrate.

Reproduced with permission from [42] © 2010 American Chemical Society.
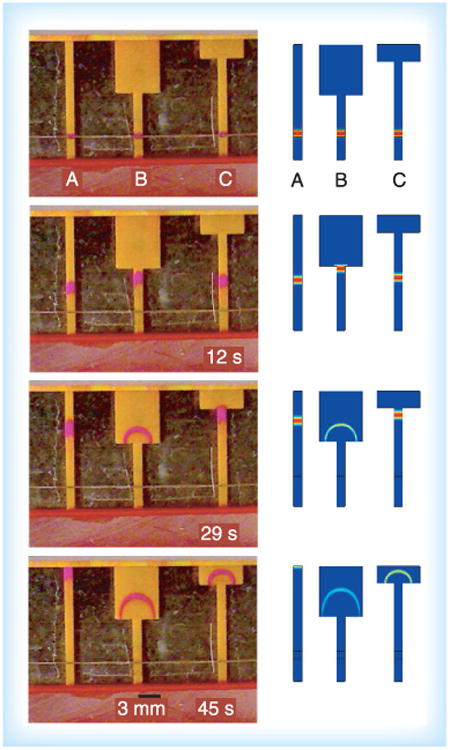
Figure 5. The use of a diode valve to program timed release of the blue fluid by the green fluid.
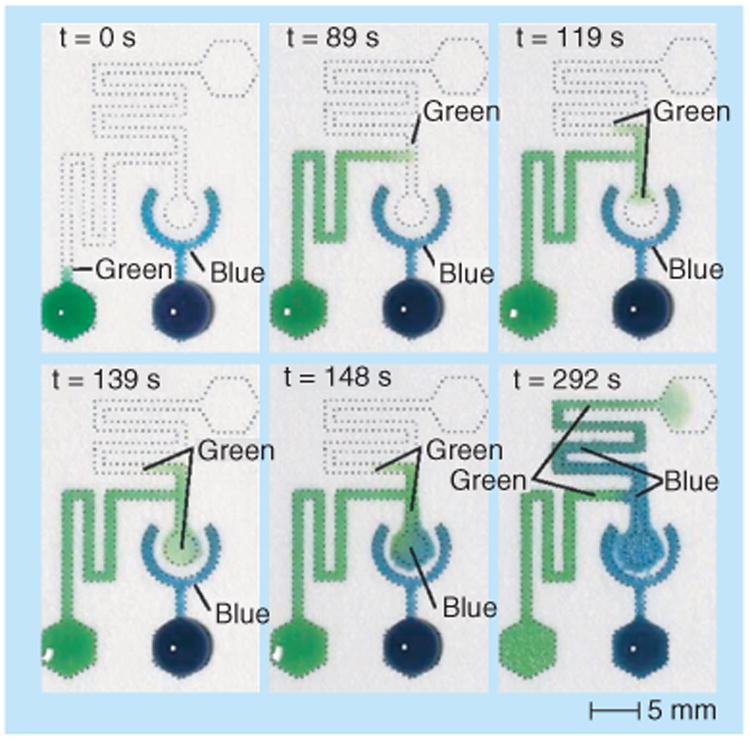
Reproduced with permission from [43] © The Royal Society of Chemistry (2012).
Please see colour figure at www.Futuremedicine.com/doi/suppl/10.4155/Bio.13.243.
Several active methods for the automated switching on of flows have also been developed. Koo et al. have demonstrated electrowetting of a dielectric to control flow rate in a porous channel [44]. Specifically, they showed the ability to tune the flow rate in nitrocellulose channels by varying the applied potential between their hydrophilic and hydrophobic electrodes, with increasing potential difference producing shorter time delays [44]. A potential advantage of this method is very fine control of the flow rate. Li et al. have demonstrated magnetically actuated valves that are triggered using an ionic resistor to sense fluid flow in the channel [45]. A potential advantage of this method is the capability to also switch off fluid flow. A disadvantage of both of these methods is the requirement of additional instrumentation, a power source in the former case, and an electromagnet and electrical circuit in the latter case. The cost per test may still be reasonable for lower-resource settings since the instrumentation cost may be amortized over the instrument lifetime. However, the requirement for maintenance or repair on the instrumentation may not be supported in the lowest-resource environments.
In addition to the automated methods for turning on fluid flows described above, simple and user-friendly methods of turning on flows based on a mechanical step have been developed. Fu et al. have demonstrated a card format for simple device activation that is appropriate for use in POC settings [30]. In this method, reagents are loaded onto source pads located on one side of a folding card, while the network is located on the opposite side of the folding card, as shown in Figure 6. Folding then creates contact between the source pads and network, initiating fluid flow from all sources into the network simultaneously. Reagents can be stored dry in the source pads, so the user only adds sample and water, further simplifying user operation. While this technique requires a mechanical step, it is not a time-critical step. Use of the method does require careful design of the card such that folding produces a reproducible and reliable contact between the source pads and the network.
Figure 6. Automated amplified 2D paper network assay developed by Fu et al.
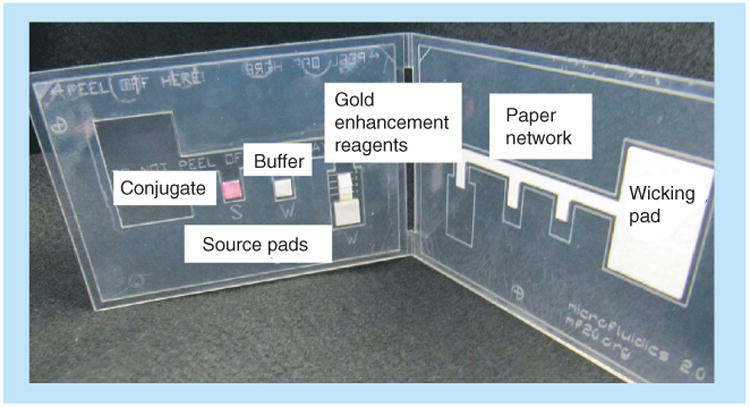
Reproduced with permission from [30] © American Chemical Society (2012).
Another type of mechanically activated valve has been demonstrated by Li et al. in a paper device [46]. A foldable paper tab-based switch was designed such that the fluidic channel upstream of a reaction site is discontinuous while the tab is folded. Once the tab is unfolded, fluid can then progress to the reaction site. In this manner, multiple valves can be employed to deliver multiple reagents in a desired sequence. Similarly, Martinez et al. designed user-activated single-use buttons in their 3D μPADs to be used in two contexts; a user initiating one or more assays from a panel of assays and running a fluidic de-multiplexer [47]. The 3D μPADs were fabricated such that a gap exists between two adjacent layers of paper and fluid cannot wick between the paper layers without intervention. In order to connect the paper channels, mechanical force was applied by pressing the button with a stylus to bring the layers into contact. More recently, Liu et al. have demonstrated the SlipChip approach in paper substrates [48]. In their SlipPAD, the ON/OFF switch of flows is accomplished through user sliding of two paper layers [49]. A significant advantage of this approach is high-throughput parallel detection in an array format. Although simple in design, a potential disadvantage of mechanically activated valves if used for a time-critical operator step, is the possibility of user error that could produce downstream variability in signal generation.
Off-switches for volume metering
A complementary fluidic control to the on-switch is a fluid flow off-switch. A critical use of an off-switch is to automatically meter multiple fluid volumes, enabling easy-to-use devices that do not require the user to make any precise measurements of fluid volumes. One automated method to control the shut-off of multiple flows independently is the use of inlet legs that are submerged into a common well at varying distances, as demonstrated by Lutz et al. [50]. The level of the fluid in the well drops as fluid wicks into the paper inlets. Fluid shuts off from the inlets at different times, in order of shortest to longest submerged lengths, as shown schematically in Figure 7. Additional parameters that can be used to control the shut-off volume for an inlet include the geometry of the fluid well, the geometry and composition of an inlet leg, and the use of a regulator wick (as shown in Figure 7). This method has been characterized for reproducibility with coefficient of variation in shut-off times between 5 and 20% [50]. Automated sequential reagent delivery from a single user activation step has been demonstrated using this method in a simple 2DPN [50]. A potential disadvantage of this method is the requirement for the device to rest on a level surface in a particular orientation. An alternative method to turn off flow from multiple inlets independently, is the use of pads of varying fluid capacity that are prefilled to saturation [30]. Contact between the pads and inlets activates the multiple flows. Fu et al. have demonstrated that volume metering using source pads provides reproducible fluid release profiles, with coefficient of variation of less than 10% in the volumes delivered [30]. The properties of the pad, most importantly the bed volume and the surface treatment, determine the release profile of fluid from the pad to the inlet. Furthermore, the rate of fluid volume released into the paper network can be adjusted by varying the cross-sectional area of the inlet.
Figure 7. A volume metering method in which fluid flows shut off from the inlets in the order of shortest to longest submerged length.
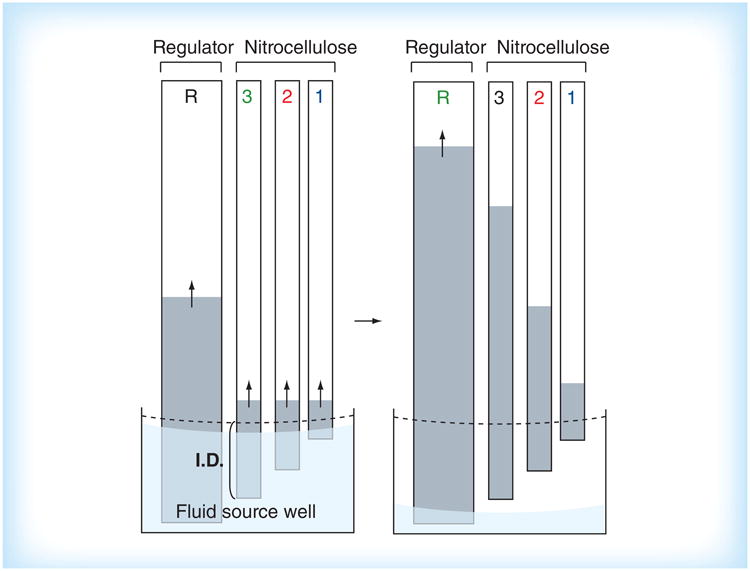
I.D.: Immersion depth.
Reproduced with permission from [50] © The Royal Society of Chemistry (2011).
Temporal & spatial control of rehydrated reagents
Complementary to the control of fluid transport using the tools described above is the ability to manipulate the spatial and temporal concentration profiles of rehydrated reagents within the porous channels. For example, Fridley et al. have demonstrated that the amount of reagent delivered in a pulse can be tuned by varying the amount of reagent printed in each spot and the number of spots arrayed across the channel [51]. Furthermore, the duration of the reagent pulse can be adjusted by varying the amount of sugar patterned with the reagent. Patterning is a serial process, so the time for patterning reagents onto substrates must be factored into the time for device fabrication. However, a significant advantage of patterning directly onto the substrate is that a complete assay can be fabricated using a single material; this can translate to a reduced number of pieces that must be assembled to create the final device and lower manufacturing costs.
We have examined a variety of tools for the control of fluid flow and reagent delivery in porous materials. These constitute a set of fluidic tools that can be used alone or in combination to create automated integrated paper microfluidic assays. Examples are included in the applications section below.
Readout methods compatible with low-resource POC settings
It is important that the users of POC diagnostic devices in low-resource settings are able to easily read and interpret assay results with minimal instrumentation. High-performance tests often rely on methods that require expensive dedicated instrumentation for data acquisition, analysis and interpretation. However, the added cost and requirement for maintenance then makes these tests unsuitable for many POC settings [26]. LFTs are a longstanding example of a POC immunoassay that produces a visible signal that can be simply read by eye [27]. For example, the pregnancy dipstick is a well-known example of a LFT, which detects human chorionic gonadotropin. Current disadvantages of many commercially available instrument-free LFTs are that the signal is restricted to being qualitative and that sensitivity is too low to have clinical significance for a number of analytes of interest [52]. Introduction of a dedicated reader to enable more sensitive or quantitative readout of LFTs has been a successful approach for higher resource POC settings [27] (commercially available dedicated readers including smartphone-based readers have been reviewed by Yetisen et al. [24]). However, this approach leads to a greater cost of the final device and a requirement for maintenance that may not be appropriate for lower-resource settings. Here we focus on several promising methods that have been developed to enable quantitative or higher sensitivity readouts that are easy to use, low cost and have minimal dedicated instrumentation. These include methods for instrument-free semi-quantitative visual readout and adapters for use with nondedicated mobile phones for extended assay readout capabilities.
Quantitative visual readout
A noninstrumented approach has been developed to provide semi-quantitative readout of LFTs, called a ladder-bar assay [53–56]. The ladder-bar assay is based on the stepwise generation of signal (e.g., due to binding of analyte and antibody conjugated to label) at patterned stripes of reacting species in the detection region (e.g., immobilized capture antibody) to produce a readout in which the number of colored lines is an indication of analyte concentration. Fung et al. adapted the ladder-bar method to demonstrate an enzyme-based assay for the quantification of hydrogen peroxide, the product of glucose and glucose oxidase [53], as shown in Figure 8. The assay response can be tuned through the manipulation of the number and spacing of capture stripes, the density of capture molecules, and the velocity of fluid flow through the detection region. According to the Lucas–Washburn relationship, the fluid front velocity decreases with the distance traveled. Therefore, the time of interaction between analyte and surface-bound antibodies increases at each subsequent test line. This complication should be taken into consideration during the development of a ladder-bar assay. Recently, a similar readout strategy was demonstrated by Lewis et al., using a device to quantify the level of hydrogen peroxide in a sample [57]. In this method, oxidative cleavage of a hydrophobic compound by hydrogen peroxide yields hydrophilic compounds, which modify the wettability of the channel and the rate at which the sample containing hydrogen peroxide wicks through the membrane. The number of colored radial bars, read at a specific time point, determines the sample concentration. Higher quantitative resolution is achieved without instrumentation through this method; however, the requirement for readout at a specific time may not be compatible with user needs in lower-resource settings and has the potential for signal variation due to user error in time of readout. A complementary approach is distance-based readout. Zuk et al. and Chen et al. have demonstrated an enzyme-based immunoassay for theophylline with coefficients of variation of less than 10% [58, 59]. Most recently, Cate et al. have demonstrated distance-based readout using multiple detection schemes, including an enzyme-based system for glucose detection [60]. They obtained a comparable limit of detection to, and a dynamic range approximately half that of a commercial system [60].
Figure 8. Ladder-bar readout for a glucose assay.
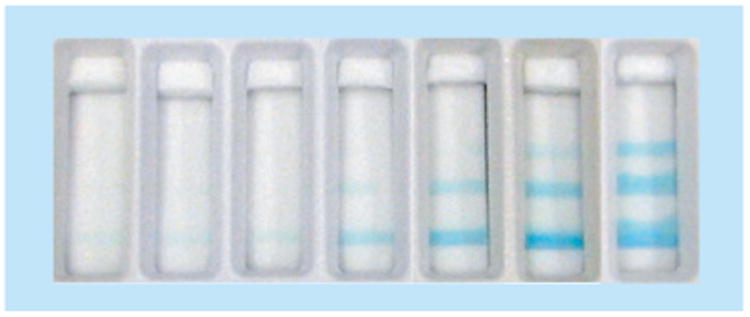
A sample consisting of 0, 1, 5, 25, 50, 100 and 200 μm glucose was added to the strip, from left to right, respectively.
Reproduced with permission from [53] © Elsevier (2009).
Nondedicated mobile phone reader model for expanded assay readout capabilities
The nondedicated mobile phone reader model is promising for applications in low-resource POC settings that require an expanded assay readout, for example, fully quantitative output, over what is possible with simple visible readout by the user. In recent years, multiple reports have testified that mobile phones hold the power to transform global health and diagnostic technologies [61,62]. This is due to their ease of use and highly ubiquitous dissemination, with recent estimates of at least 5 billion devices worldwide [101]. Camera-equipped mobile phones have permeated throughout even the least developed countries. They are lightweight, portable, increasingly affordable, and can provide high resolution images (>2 megapixels) [63].
Martinez et al. first outlined a process for the quantification of diagnostic assays by remote analysis of image data taken by a mobile phone camera [63]. In their demonstration, the camera on a mobile phone was used to image the colorimetric results of a biplexed glucose and protein assay. The image was then sent to a remote computer through a wireless communication system, and there the image was processed to output analyte concentration. In their use scenario, the quantitative results could then be reported back to the user's mobile phone along with a prescribed treatment. A complementary approach to extract quantitative kinetic data using smartphones was presented by Stevens and Yager [64]. They demonstrated that the rate of intensity generation extracted from smart-phone-acquired image data could be correlated with the concentration of the target analyte in a flow-through membrane-based immunoassay. Potential advantages they cite are a shorter time to result and a larger dynamic range compared with end-point measurements. In an extension of this work, Dell et al. demonstrated the ability to process the kinetic data in real time using an Android mobile phone [65].
Further utilizing the ubiquity of camera-equipped mobile phones, the Ozcan laboratory (MA, USA) has developed adapters that can physically attach to a nondedicated mobile phone for use in multiple contexts. Zhu et al. have demonstrated wide-field fluorescent and darkfield imaging using an adapter composed of compact, lightweight and cost-effective optical components, including a simple lens, a plastic color filter, LEDs and a battery [66]. A spatial resolution of 10 μm was achieved with a field of view of 81 mm2, allowing for the possibility of a high level of multiplexing [66]. Considering the high-sensitivity of fluorescence detection, this approach is especially promising for applications that require a very low limit of detection. More recently, Mudanyali et al. extended this work to perform imaging and analysis of commercially available LFTs in refection and transmission mode using the smartphone plus adapter system demonstrated in Figure 9. In this demonstration, raw images were acquired and digitally processed by an application on the smartphone, increasing robustness of the results, especially at lower concentrations that approached the limit of detection [67]. As a further extension of this work, a personalized food allergen test was demonstrated [68]. Compared with visual inspection, the optical readout was rapid (image was processed within 1 s) and allowed for a more sensitive quantitative result (between 1 and 25 ppm). The smartphone plus adapter approach is promising, directly addressing issues such as variability of ambient lighting conditions and variability of user positioning of the smartphone.
Figure 9. Adapter that interfaces with an Android phone to perform imaging and analysis of commercially available lateral flow tests in reflection and transmission mode by Mudanyali et al.
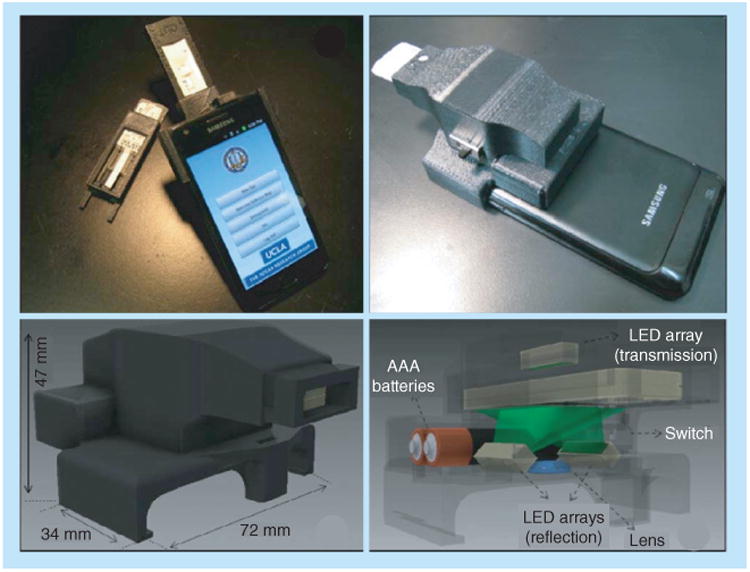
Reproduced with permission from [67] © The Royal Society of Chemistry (2012).
Power & heating compatible with low-resource POC settings
Many laboratory-based assays utilize mains electricity for operation. For example, power is required to generate the excitation source for fluorescence-based assays. Examples of processes that require heating are nucleic acid amplification reactions and cell lysis protocols. However, the requirement for mains electricity is not compatible with low-resource POC settings in which electricity is either unreliable or unavailable. Recently, several groups have developed novel techniques to deliver consistent power or heat to assays without this requirement.
Fluidic batteries
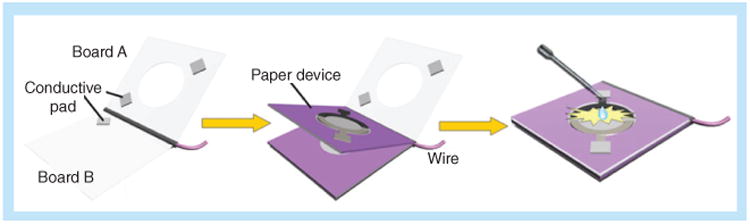
Various groups have developed fluidic or paper-based batteries in order to avoid the expense and hazardous waste associated with traditional lithium ion batteries. These fluidic batteries can be powered by electrochemical reactions and are fully disposable. Hilder et al. have characterized the open-circuit voltage and discharge current – up to 1.2 V and 500 μA, respectively – of screen-printing zinc/carbon–poly(3,4-ethylene-dioxythiophene) (PEDOT)/air batteries on various paper substrates [69]. Liu et al. further developed this method by integrating a paper-battery into an electrochemical sensing platform [70] as shown in Figure 10. Their integrated battery powered an electrochemical reaction and detection system to detect glucose and hydrogen peroxide in artificial urine samples. Thom et al. designed a paper-battery capable of powering a UV light-emitting diode, and demonstrated it in an on-paper fluorescence assay [71]. Their assay detected β-d-galactosidase in a sample in less than 20 min. Furthermore, Zheng et al. reviewed conductive papers and energy storage mechanisms for paper-based devices [21].
Figure 10. Paper battery for the detection of glucose and hydrogen peroxide in artificial urine samples.
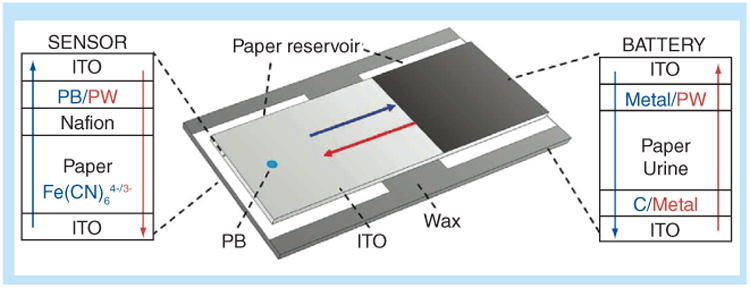
ITO: Indium-doped tin oxide; PB: Prussian blue; PW: Prussian white.
Reproduced with permission from [70] © American Chemical Society (2012).
Smartphones as a power source
To date, the majority of smartphone-based technologies have been used for sensing and detection techniques rather than for powering diagnostic devices [72,73]. The one major exception has been MobiSante's US FDA-approved ultrasound imaging system that is powered by a dedicated smartphone-based reader [102]. Smartphones have the capability to provide reliable power directly at the POC. For example, the iPhone can output 3.3 V using commercially available pinout connectors such as the PodSocket Breakout from Spark Fun Electronics (CO, USA) [103]. This inexpensive (US$15 retail), reusable device plugs directly into the charging port of an iPhone and can easily create a POC power source.
Heaters
To provide consistent heat to a system, there are two well-developed options suitable for low-resource POC settings. The first is an inexpensive, single-use, flexible thin film heater, shown in Figure 11, which has been demonstrated to heat disposable plastic cassettes for nucleic acid amplification reactions for up to 1 h with minimal power requirements by Liu et al. [74]. As an example, a temperature of 40°C requires only 0.15 W of power (∼0.82 V from a thin film heater, Minco Products, Inc., MN, USA). This voltage could easily be supplied with a mobile phone or fluidic battery as described above. The second option eliminates the need for any electrical power by utilizing heat supplied by an exothermic chemical reaction. LaBarre et al. have described the use of exothermic chemical reactions activated by the addition of aqueous buffer as the heat-generating mechanism for a POC device, achieving constant temperature profiles at 38°C, 55°C and 63°C (±1°C). Critical to achieving a robust and stable heating system is coupling the heat-generating reaction to a phase-change material, as shown in Figure 12. They demonstrated the use of their heating mechanism to power a nucleic acid isothermal amplification reaction (Loop-mediated isothermal amplification) in a tube. This reaction ran at 63 ± 1°C for 38 min with detectable signal down to one genome copy per microliter [75].
Figure 11. Thin-film heater used to power nucleic acid amplification reactions for up to 1 h.
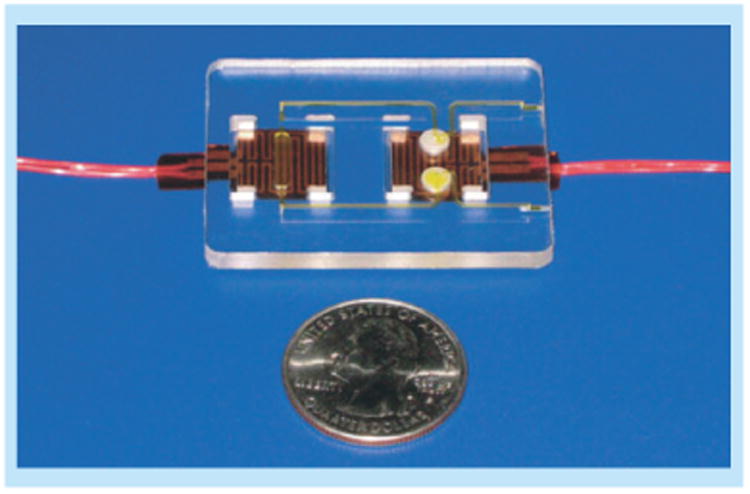
Reproduced with permission from [74] © Springer Science + Business Media (2011).
Figure 12. Temperature versus time of multiple runs (n = 10) measured at the exothermic reaction (red), interface with the phase change material (green), and at the nucleic acid amplification reaction (blue).
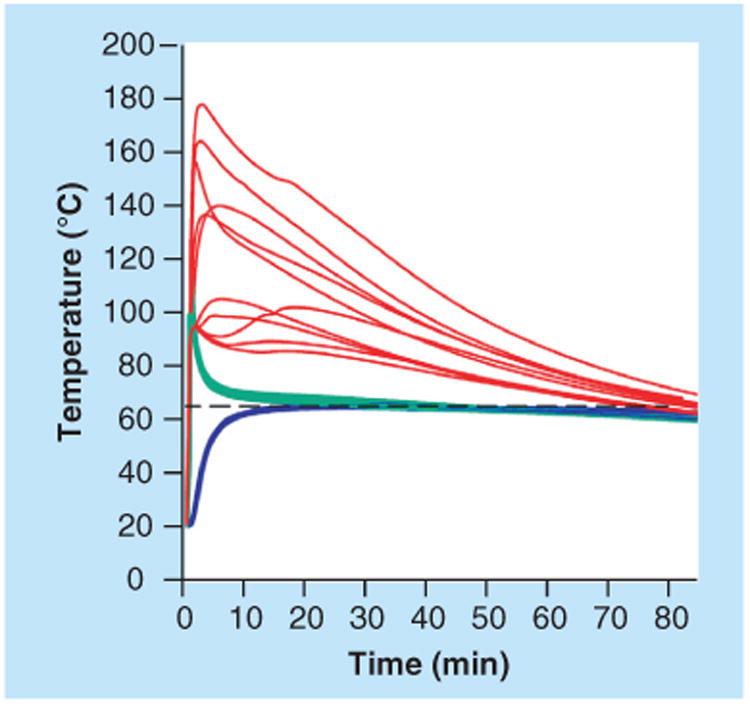
Reproduced from [75].
Please see colour figure at www.Futuremedicine.com/doi/suppl/10.4155/Bio.13.243
Selected applications for low-resource POC settings
Using several of the above-described tools, multiple groups have developed paper-based devices for low-resource POC applications. Devices have been developed to perform multistep sample processing for sample preparation, amplification and high-sensitivity detection in a package suitable for use at the POC.
Sample preparation
One of the most challenging aspects of device development for the POC is sample preparation. Govindarajan et al. demonstrated the extraction of bacterial DNA using multiple folding steps in a paper origami device [76]. This device utilized dried lysis buffer that was rehydrated upon assay activation. Osborn et al. demonstrated multiple mechanisms for paper-based dilution, mixing and sample separation based on the diffusion of particles through nitrocellulose membranes [77]. Most recently, Abbas et al. have used a combination of polyelectrolyte coatings and the shape of the paper substrate for analyte separation and concentration [78]. Separations were achieved, using devices such as shown in Figure 13, via differential electrostatic interactions of the species of interest in the sample with the charged paper substrate. Transport of the analyte into the very small diameter tip, approximately 20 μm, of a star geometry was accomplished through capillary flow and evaporation at the tip, producing a reported concentration factor of many orders of magnitude [78].
Figure 13. Device that uses polyelectrolyte coatings and the shape of the paper for analyte separation and concentration.
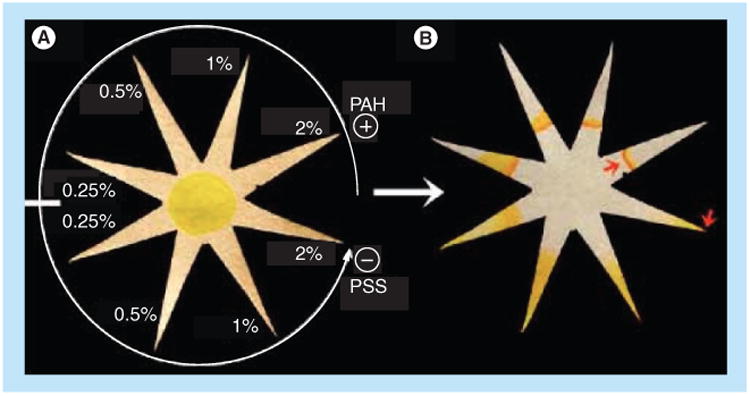
The surface charge in a given prong of the star, controlled via the concentration of polyelectrolyes as in the example in (A), affects the transport of model analyte fluorescein into that prong and can be tuned to produce highly concentrated fluorescein in a very small diameter tip, as shown by the rightmost arrow in (B).
PAH: Poly(allylamine hydrochloride); PSS: Poly(styrene sulfonate).
Reproduced with permission from [78] © American Chemical Society (2013).
Multistep high-sensitivity assays
There is a need for assays with improved limits of detection in a package suitable for use at the POC. Fu et al. have developed a signal-amplified 2DPN folding card assay for human chorionic gonadotropin detection [29] that relied on a single time-critical user step. In an extension of this work, they eliminated the time-critical user step by fully automating the sequential delivery of reagents in a signal amplified 2DPN for the detection of the malaria protein Pf HRP2 [30]. The assay achieved a fourfold improvement in the limit of detection compared with the assay without the signal amplification and rinse steps. In this case, a commercially available gold-enhancement reagent was used; further gains in sensitivity should be possible using alternate signal-amplification methods such as enzyme-based systems. Lewis et al. have developed a novel signal amplification method in a time measurement-based paper assay [79]. Their method for the detection of hydrogen peroxide uses the reaction between hydrogen peroxide and an initially water insoluble oligomer to produce a water-soluble oligomer and allows the flow of sample through the device [79]. The transport time for the sample decreases with increasing concentration of analyte [79]. A second approach that can deliver high sensitivity is nucleic acid amplification. Rohrman et al. have published results demonstrating isothermal amplification (recombinase polymerase amplification) in glass fiber at ten copy sensitivity using lateral flow detection [80]. Nucleic acid amplification in a porous matrix coupled with the advances described above in equipment-free heating have the potential to bring high sensitivity nucleic acid amplification assays to low-resource settings.
A third approach to achieve high-sensitivity is to use noncolorimetric detection methods in paper-based assays. Ge et al. have developed an origami-based paper immunoassay with chemiluminescence detection [81]. The multistep assay was implemented through a sequence of appropriate user folds. Using this system, they demonstrated detection of cancer markers from whole blood with comparable performance to a commercial assay [81]. In a complementary demonstration, Li et al. demonstrated a paper origami device based on electrochemiluminescence detection [82]. Wan g et al. extended this work for the detection of a cancer marker in clinical samples; their device is shown schematically in Figure 14 [83].
Figure 14. Schematic of a paper-based origami device to detect cancer markers in clinical samples from Wang et al.
Reproduced with permission from [83] © Elsevier (2013).
Challenges
Moving forward, a big challenge to the creation of paper-based diagnostic devices for use at the POC is integration to create standalone automated sample-in to result-out devices. As discussed earlier in this article, there has been much activity and progress to date on creating tools for flow control, power and heating methods compatible with low-resource settings, extended readout capabilities with minimal instrumentation, and discrete modules for specific analytical processes. A fully integrated device will include all processes that are required to achieve the performance specifications of the intended application: sample transfer, sample preparation, capture and labeling of the target analyte, detection and transmission of results. The integration issues relevant to the creation of paper-based diagnostic devices are analogous to the issues in conventional microfluidics-based diagnostic device development. Successful device integration can be achieved by a two-part approach composed of a system-level view of the whole device and individual module development [84].
This approach enables balancing issues of connectivity of the modules and the cost and ease of overall device manufacturing, with potential trade-offs in the performance of the integrated modules, compared with the optimized individual modules; all with the goal of meeting the performance specifications of the intended application and the design constraints of the intended setting.
For example, issues relevant to device integration need to be considered when making a choice of final device material(s). The best performance for the individual modules may be produced when utilizing a different material in each module. This is because the individual modules may have different functional requirements that translate to a need for different material characteristics for properties such as flow rate, compatibility with specific surface treatments, and propensity for surface adsorption. However, choosing to include multiple materials in the final integrated device requires that the chosen materials be compatible on several levels. First, the material used in a downstream module must be compatible with the upstream processes (e.g., resistant to a solvent used in an upstream process that then flows downstream). Second, the materials need to be compatible with respect to the creation of robust fluidic connections between the materials in different modules. Third, the disparate materials must be compatible in terms of the existence of a straightforward fabrication process that has the potential to be scaled up. Additionally, the added cost to device manufacturing when using disparate materials should be considered and determined to be reasonable for the intended application, if the device is to have a chance at translation to a commercial product [85]. Down-selection to one material may result in a decrease in performance in one or more modules, but this may be acceptable, if performance specifications for the intended application are still met. Thus, there are multiple trade-offs involved in the final material(s) choice. A thorough understanding of the cost constraints and performance requirements of the end-use application will be needed to optimally balance the issues involved in creating a fully integrated device.
A second big challenge is to fulfill the promise of nondedicated mobile phone use in a POC diagnostic system. Recently there has been much discussion of the expanded use of mobile phones in POC diagnostics; multiple potential functions include: directing test operation, analyzing test results, interpreting test results and transmitting test results to a healthcare provider and instructions back to the patient. A critical requirement for realizing the full potential of mobile phone use in POC diagnostics is infrastructure to interface with the existing healthcare system. For example, protocols for the mode of patient interaction with the healthcare provider need to be developed. Specifically, protocols for the use of synchronous or asynchronous communications, procedures for prioritization of these communications based on the nature of patient test results, and mechanisms for ensuring appropriately timely communications between the patient and healthcare provider after the transmission of test results must be developed, tested and implemented. A further requirement will be to gain acceptance of these within existing medical practice. Future development of POC diagnostics to be compatible with nondedicated mobile phones will require that additional technological and regulatory issues be addressed. For example, given the numerous mobile phones available to the consumer, defining the subset of mobile phones that adhere to a common standard and can be used with a given diagnostic test will be required. A significant issue for the nondediated mobile phone reader model is to implement a mechanism for keeping abreast of mobile phone manufacturer updates to relevant phone models for retesting of compatibility with the diagnostic test. Issues associated with secure transmission of patient information [86] will also have to be addressed by the diagnostic device companies.
Future perspective
The overall challenge in POC diagnostics development continues to be to create high-performance assays that are appropriate for the various settings relevant for global health applications. For the lower-resource settings, the requirements for high performance with a rapid, maintenance-free, easy-to-use, and very low cost device brings specific design and implementation challenges. Paper-based microfluidics is especially well suited to addressing these challenges. The development of precise and robust fluidic controls coupled with advances to develop electrical power-free methods and readout with minimal instrumentation underlie the great potential for creating sophisticated assays that are appropriate for low-resource settings.
Executive summary.
Background
Gold-standard diagnostic methods rely on multistep sample processing protocols that require a high level of resources and are not appropriate for use in low-resource point-of-care (POC) settings.
Paper microfluidics is a growing subfield in which capillary pressure is used to automatically drive flow in the porous material of which the device is composed.
Porous network devices, such as conventional lateral flow tests, are disposable, have a rapid time to result and are cost effective to manufacture.
A major challenge, and the focus of this Review, is to implement multistep processes with the robust fluid control required to achieve the necessary sensitivity and specificity of a given application in a user-friendly package that minimizes equipment.
Fluidic controls for automation in paper-based devices
Critical to the development of high-impact paper microfluidic devices is the ability to achieve precise and robust automated fluidic control of the multiple fluid sources in an assay.
The network topology of the paper device, that is, multiple inlets for each outlet, can be used to automate sequential delivery of multiple fluids to a detection region.
Channel geometry can be used to control flow rates in a paper network.
On-switches to delay the downstream arrival of a given fluid for a specific amount of time have been developed. Methods include dissolvable barriers, the use of hydrophobic coatings, absorbent pad delays and user-activated mechanical valves.
Complementary off-switches to automatically meter multiple fluid volumes in the paper network have been developed. Methods include fluidic disconnects and pad-based volume control.
Patterning reagents onto a substrate can be used to control the spatial and temporal concentration profiles of the reagents when rehydrated.
Readout methods compatible with low-resource POC settings
The added cost and requirement for maintenance of the dedicated instrumentation often associated with high-performance tests make these tests unsuitable for many low-resource POC settings.
Methods for quantitative visual readout include the stepwise or continuous generation of signal in the detection region that can be read by the number of bars in which the signal was generated or the distance over which the signal was generated, respectively.
A nondedicated mobile phone reader model is promising for applications in low-resource POC settings that require fully quantitative readout.
The mobile phone reader plus inexpensive adapter approach is promising, directly addressing issues such as variability of ambient lighting conditions and variability of user positioning of the mobile phone.
Power & heating compatible with low-resource POC settings
Paper-based fluidic batteries, powered by electrochemical reactions and fully disposable, have been developed in order to avoid the expense and hazardous waste associated with traditional lithium ion batteries.
Smartphones have the capability to provide reliable power directly at the POC.
Single-use, flexible, thin-film heaters and chemical heating with phase change materials are promising heating methods for use in paper-based devices for low-resource POC settings.
Selected applications for low-resource POC settings
Paper-based devices for sample preparation have been developed to perform nucleic acid extraction and perform the separation and preconcentration of analyte.
An automated signal-amplified assay was demonstrated using network topology and pad-based volume metering.
Nucleic acid amplification in a porous matrix coupled with advances in equipment-free heating, have the potential to bring high-sensitivity nucleic acid amplification assays to low-resource POC settings.
High-sensitivity signal-generation methods have been demonstrated in paper-based assays using origami to manipulate fluids.
Challenges
One main challenge to the creation of paper-based diagnostic devices for use at the POC is integration to create standalone automated sample-in to result-out devices.
A second main challenge is to fulfill the promise of nondedicated mobile phone use in a POC diagnostic system by implementing multiple potential functions that include: directing test operation, analyzing test results, interpreting test results, and transmitting test results to a healthcare provider and instructions back to the patient.
The overall challenge in POC diagnostics development continues to be to create high-performance assays that are appropriate for the various settings relevant for global health applications.
Acknowledgments
The authors thank G Fridley, C Holstein, B Lutz and P Yager for their helpful comments and suggestions on the manuscript.
Research reported in this publication was supported by the National Institute of Allergy and Infectious Disease of the NIH under award number R01AI096184. The content is solely the responsibility of the authors and does not necessarily represent the official views of the NIH.
Key Terms
- Nitrocellulose -
Flammable membrane used often in lateral flow tests
- Cellulose -
Material that is often used to make paper
- Pore diameter -
Increases in this parameter results in decreases in both the viscous resistance and the capillary pressure
- Lucas–Washburn flow -
Flow under which the viscous resistance is proportional to velocity with a coefficient that increases as the fluid column lengthens
- Fully wetted flow -
Flow that is characterized by a quasi-steady velocity
Footnotes
Financial & competing interests disclosure: The authors have no other relevant affiliations or financial involvement with any organization or entity with a financial interest in or financial conflict with the subject matter or materials discussed in the manuscript apart from those disclosed.
No writing assistance was utilized in the production of this manuscript.
References
Papers of special note have been highlighted as:
■ of interest
■■ of considerable interest
- 1.Asiello PJ, Baeumner AJ. Miniaturized isothermal nucleic acid amplification, a review. Lab Chip. 2011;11(8):1420–1430. doi: 10.1039/c0lc00666a. [DOI] [PubMed] [Google Scholar]
- 2.Lin CC, Wang JH, Wu HW, Lee GB. Microfluidic Immunoassays. J Lab Autom. 2010;15(3):253–274. [Google Scholar]
- 3.Martinez AW, Phillips ST, Butte MJ, Whitesides GM. Patterned paper as a platform for inexpensive, low-volume, portable bioassays. Angew Chem Int Ed Engl. 2007;46(8):1318–1320. doi: 10.1002/anie.200603817. [DOI] [PMC free article] [PubMed] [Google Scholar]
- 4.Martinez AW, Phillips ST, Whitesides GM. Three-dimensional microfluidic devices fabricated in layered paper and tape. Proc Natl Acad Sci USA. 2008;105(50):19606–19611. doi: 10.1073/pnas.0810903105. [DOI] [PMC free article] [PubMed] [Google Scholar]
- 5.Martinez AW, Phillips ST, Nie Z, et al. Programmable diagnostic devices made from paper and tape. Lab Chip. 2010;10(19):2499–2504. doi: 10.1039/c0lc00021c. [DOI] [PubMed] [Google Scholar]
- 6.Vella SJ, Beattie P, Cademartiri R, et al. Measuring markers of liver function using a micropatterned paper device designed for blood from a fingerstick. Anal Chem. 2012;84(6):2883–2891. doi: 10.1021/ac203434x. [DOI] [PMC free article] [PubMed] [Google Scholar]
- 7■.Martinez A, Phillips S, Whitesides G, Carrilho E. Diagnostics for the developing world: microfluidic paper-based analytical devices. Anal Chem. 2010;82(1):3–10. doi: 10.1021/ac9013989. Nice review of early work in paper microfluidics with a focus on devices for multi-analyte detection. [DOI] [PubMed] [Google Scholar]
- 8.Pelton R. Bioactive paper provides a low-cost platform for diagnostics. Trends Analyt Chem. 2009;28(8):925–942. doi: 10.1016/j.trac.2009.05.005. [DOI] [PMC free article] [PubMed] [Google Scholar]
- 9■.Fridley GE, Holstein CA, Oza SB, Yager P. The evolution of nitrocellulose as a material for bioassays. MRS Bull. 2013;38(4):326–330. Focused review of the use of nitrocellulose in bioassays. [Google Scholar]
- 10.Ballerini DR, Li X, Shen W. Patterned paper and alternative materials as substrates for low-cost microfluidic diagnostics. Microfluid Nanofluidics. 2012;13(5):769–787. [Google Scholar]
- 11.Li X, Ballerini DR, Shen W. A perspective on paper-based microfluidics: current status and future trends. Biomicrofluidics. 2012;6(1):11301–1130113. doi: 10.1063/1.3687398. [DOI] [PMC free article] [PubMed] [Google Scholar]
- 12.Coltro WKT, de Jesus DP, da Silva JAF, do Lago CL, Carrilho E. Toner and paper-based fabrication techniques for microfluidic applications. Electrophoresis. 2010;31(15):2487–2498. doi: 10.1002/elps.201000063. [DOI] [PubMed] [Google Scholar]
- 13.Nie Z, Nijhuis CA, Gong J, et al. Electrochemical sensing in paper-based microfluidic devices. Lab Chip. 2010;10(4):477–483. doi: 10.1039/b917150a. [DOI] [PMC free article] [PubMed] [Google Scholar]
- 14.Maxwell EJ, Mazzeo AD, Whitesides GM. Paper-based electroanalytical devices for accessible diagnostic testing. MRS Bull. 2013;38(4):309–314. [Google Scholar]
- 15.Liana DD, Raguse B, Gooding JJ, Chow E. Recent advances in paper-based sensors. Sensors (Basel) 2012;12(9):11505–11526. doi: 10.3390/s120911505. [DOI] [PMC free article] [PubMed] [Google Scholar]
- 16.Tobjork D, Osterbacka R. Paper electronics. Adv Mater. 2011;23(17):1935–1961. doi: 10.1002/adma.201004692. [DOI] [PubMed] [Google Scholar]
- 17.Bazin I, Nabais E, Lopez-Ferber M. Rapid visual tests: fast and reliable detection of ochratoxin A. Toxins (Basel) 2010;2(9):2230–2241. doi: 10.3390/toxins2092230. [DOI] [PMC free article] [PubMed] [Google Scholar]
- 18.Shah P, Zhu XN, Li CZ. Development of paper-based analytical kit for point-of-care testing. Expert Rev Mol Diagn. 2013;13(1):83–91. doi: 10.1586/erm.12.130. [DOI] [PubMed] [Google Scholar]
- 19.Kuo JS, Chiu DT. Disposable microfluidic substrates: transitioning from the research laboratory into the clinic. Lab Chip. 2011;11(16):2656–2665. doi: 10.1039/c1lc20125e. [DOI] [PubMed] [Google Scholar]
- 20.Phillips ST, Lewis GG. Advances in materials that enable quantitative point-of-care assays. MRS Bull. 2013;38(4):315–319. [Google Scholar]
- 21.Zheng G, Cui Y, Karabulut E, Wagberg L, Zhu H, Hu L. Nanostructured paper for flexible energy and electronic devices. MRS Bull. 2013;38(4):320–325. [Google Scholar]
- 22.Sicard C, Brennan JD. Bioactive paper: biomolecule immobilization methods and applications in environmental monitoring. MRS Bull. 2013;38(4):331–334. [Google Scholar]
- 23.Rolland JP, Mourey DA. Paper as a novel material platform for devices. MRS Bull. 2013;38(4):299–305. [Google Scholar]
- 24.Yetisen AK, Akram MW, Lowe CR. Paper-based microfluidic point-of-care diagnostic devices. Lab Chip. 2013;13(12):2210–2251. doi: 10.1039/c3lc50169h. [DOI] [PubMed] [Google Scholar]
- 25.Gerlach J, Sequeira M, Alvarado V, et al. Cost analysis of centralized viral load testing for antiretroviral therapy monitoring in Nicaragua, a low-HIV prevalence, low-resource setting. J Int AIDS Soc. 2010;13(1) doi: 10.1186/1758-2652-13-43. [DOI] [PMC free article] [PubMed] [Google Scholar]
- 26.Mabey D, Peeling RW, Ustianowski A, Perkins MD. Diagnostics for the developing world. Nat Rev Microbiol. 2004;2(3):231–240. doi: 10.1038/nrmicro841. [DOI] [PubMed] [Google Scholar]
- 27.Wong R, Tse H. Lateral Flow Immunoassay. Humana Press; NY, USA: 2010. [Google Scholar]
- 28.Fu E, Kauffman P, Lutz B, Yager P. Chemical signal amplification in two-dimensional paper networks. Sens Actuators B Chem. 2010;149(1):325–328. doi: 10.1016/j.snb.2010.06.024. [DOI] [PMC free article] [PubMed] [Google Scholar]
- 29.Fu E, Liang T, Houghtaling J, et al. Enhanced sensitivity of lateral flow tests Using a two-dimensional paper network format. Anal Chem. 2011;83(20):7941–7946. doi: 10.1021/ac201950g. [DOI] [PMC free article] [PubMed] [Google Scholar]
- 30■■.Fu E, Liang T, Spicar-Mihalic P, Houghtaling J, Ramachandran S, Yager P. Two-dimensional paper network format that enables simple multistep assays for use in low-resource settings in the context of malaria antigen detection. Anal Chem. 2012;84(10):4574–4579. doi: 10.1021/ac300689s. Contains an excellent demonstration of the use of paper microfluidics to perform multistep sample processing for high-performance assays. [DOI] [PMC free article] [PubMed] [Google Scholar]
- 31.Fu E, Lutz B, Kauffman P, Yager P. Controlled reagent transport in disposable 2D paper networks. Lab Chip. 2010;10(7):918–920. doi: 10.1039/b919614e. [DOI] [PMC free article] [PubMed] [Google Scholar]
- 32.Dharmaraja S, Lafeur L, Byrnes S, et al. Programming paper networks for point of care diagnostics. Proc SPIE. 2013 [Google Scholar]
- 33.Bell JM, Cameron FK. The flow of liquids through capillary spaces. J Phys Chem. 1906;10(8):658–674. [Google Scholar]
- 34.Lucas R. The time law of the capillary rise of liquids. Colloid Polym Sci. 1918;23(1):15–22. [Google Scholar]
- 35.Washburn EW. The dynamics of capillary flow. Phys Rev. 1921;17(3):273–283. [Google Scholar]
- 36.Alava M, Niskanen K. The physics of paper. Rep Prog Phys. 2006;69(3):669–723. [Google Scholar]
- 37■.Fu E, Ramsey S, Kauffman P, Lutz B, Yager P. Transport in two-dimensional paper networks. Microfluid Nanofluidics. 2011;10(1):29–35. doi: 10.1007/s10404-010-0643-y. Contains a good discussion of simple ways to control flow in 2D paper networks. [DOI] [PMC free article] [PubMed] [Google Scholar]
- 38.Medina A, Perez-Rosales C. Imbibition in pieces of paper with different shapes. Revista Mexicana De Fisica. 2001;47(6):537–541. [Google Scholar]
- 39.Darcy H. Les Fontaines Publiques de la Ville de Dijon. Victor Dalmont; Paris, France: 1856. [Google Scholar]
- 40■■.Mendez S, Fenton EM, Gallegos GR, et al. Imbibition in porous membranes of complex shape: quasi-stationary flow in thin rectangular segments. Langmuir. 2010;26(2):1380–1385. doi: 10.1021/la902470b. Provides an excellent description of flow in porous membranes; the supplementary material is also worth reading closely. [DOI] [PubMed] [Google Scholar]
- 41.Lutz B, Liang T, Fu E, Ramachandran S, Kauffman P, Yager P. Dissolvable fluidic time delays for programming multi-step assays in instrument-free paper diagnostics. Lab Chip. 2013;13(14):2840–2847. doi: 10.1039/c3lc50178g. [DOI] [PMC free article] [PubMed] [Google Scholar]
- 42.Noh N, Phillips ST. Fluidic timers for time-dependent, point-of-care assays on paper. Anal Chem. 2010;82(10):8071–8078. doi: 10.1021/ac1005537. [DOI] [PubMed] [Google Scholar]
- 43.Chen H, Cogswell J, Anagnostopoulos C, Faghri M. A fluidic diode, valves, and a sequential-loading circuit fabricated on layered paper. Lab Chip. 2012;12(16):2909–2913. doi: 10.1039/c2lc20970e. [DOI] [PubMed] [Google Scholar]
- 44.Koo C, He F, Nugen S. An inkjet-printed electrowetting valve for paper-fluidic sensors. Analyst. 2013;138(17):4998–5004. doi: 10.1039/c3an01114c. [DOI] [PubMed] [Google Scholar]
- 45.Li X, Zwanenburg P, Liu X. Magnetic timing valves for fluid control in paper-based microfluidics. Lab Chip. 2013;13(13):2609–2614. doi: 10.1039/c3lc00006k. [DOI] [PubMed] [Google Scholar]
- 46.Li X, Tian JF, Shen W. Progress in patterned paper sizing for fabrication of paper-based microfluidic sensors. Cellulose. 2010;17(3):649–659. [Google Scholar]
- 47.Martinez AW, Phillips ST, Nie ZH, et al. Programmable diagnostic devices made from paper and tape. Lab Chip. 2010;10(19):2499–2504. doi: 10.1039/c0lc00021c. [DOI] [PubMed] [Google Scholar]
- 48.Du WB, Li L, Nichols KP, Ismagilov RF. SlipChip. Lab Chip. 2009;9(16):2286–2292. doi: 10.1039/b908978k. [DOI] [PMC free article] [PubMed] [Google Scholar]
- 49.Liu H, Li X, Crooks RM. Paper-based SlipPAD for high-throughput chemical sensing. Anal Chem. 2013;85(9):4263–4267. doi: 10.1021/ac4008623. [DOI] [PubMed] [Google Scholar]
- 50.Lutz BR, Trinh P, Ball C, Fu E, Yager P. Two-dimensional paper networks: programmable fluidic disconnects for multi-step processes in shaped paper. Lab Chip. 2011;11(24):4274–4278. doi: 10.1039/c1lc20758j. [DOI] [PMC free article] [PubMed] [Google Scholar]
- 51.Fridley GE, Le HQ, Fu E, Yager P. Controlled release of dry reagents in porous media for tunable temporal and spatial distribution upon rehydration. Lab Chip. 2012;12(21):4321–4327. doi: 10.1039/c2lc40785j. [DOI] [PMC free article] [PubMed] [Google Scholar]
- 52.Posthuma-Trumpie G, Korf J, Amerongen v. lateral flow (immuno)assay: its strengths, weaknesses, opportunities and threats. A literature survey. Anal Bioanal Chem. 2009;393(2):569–582. doi: 10.1007/s00216-008-2287-2. [DOI] [PubMed] [Google Scholar]
- 53.Fung KK, Chan CPY, Renneberg R. Development of enzyme-based bar code-style lateral-flow assay for hydrogen peroxide determination. Anal Chim Acta. 2009;634(1):89–95. doi: 10.1016/j.aca.2008.11.064. [DOI] [PubMed] [Google Scholar]
- 54.Lou SC, Patel C, Ching SF, Gordon J. One-step competitive immunochromatographic assay for semiquantitative determination of lipoprotein A in plasma. Clin Chem. 1993;39(4):619–624. [PubMed] [Google Scholar]
- 55.Cho JH, Paek SH. Semiquantitative, bar code version of immunochromatographic assay system for human serum albumin as model analyte. Biotechnol Bioeng. 2001;75(6):725–732. doi: 10.1002/bit.10094. [DOI] [PubMed] [Google Scholar]
- 56.Leung W, Chan CP, Rainer TH, Ip M, Cautherley GWH, Renneberg R. InfectCheck CRP barcode-style lateral flow assay for semi-quantitative detection of C-reactive protein in distinguishing between bacterial and viral infections. J Immunol Methods. 2008;336(1):30–36. doi: 10.1016/j.jim.2008.03.009. [DOI] [PubMed] [Google Scholar]
- 57.Lewis GG, DiTucci MJ, Phillips ST. Quantifying analytes in paper-based microfluidic devices without using external electronic readers. Angew Chem Int Ed Engl. 2012;51(51):12707–12710. doi: 10.1002/anie.201207239. [DOI] [PubMed] [Google Scholar]
- 58.Zuk RF, Ginsberg VK, Houts T, et al. Enzyme immunochromatography - a quantitative immunoassay requiring no instrumentation. Clin Chem. 1985;31(7):1144–1150. [PubMed] [Google Scholar]
- 59.Chen R, Li TM, Merrick H, et al. An internal clock reaction used in a one-step enzyme immunochromatographic assay of theophylline in whole-blood. Clin Chem. 1987;33(9):1521–1525. [PubMed] [Google Scholar]
- 60.Cate DM, Dungchai W, Cunningham JC, Volckens J, Henry CS. Simple, distance-based measurement for paper analytical devices. Lab Chip. 2013;13(12):2397–2404. doi: 10.1039/c3lc50072a. [DOI] [PubMed] [Google Scholar]
- 61.Hampton T. Recent advances in mobile technology benefit global health, research, and care. JAMA. 2012;307(19):2013–2014. doi: 10.1001/jama.2012.4465. [DOI] [PubMed] [Google Scholar]
- 62.Kayingo G. Transforming global health with mobile technologies and social enterprises global health and innovation conference. Yale J Biol Med. 2012;85(3):424–426. [PMC free article] [PubMed] [Google Scholar]
- 63.Martinez AW, Phillips ST, Carrilho E, Thomas SW, Sindi H, Whitesides GM. Simple telemedicine for developing regions: camera phones and paper-based microfluidic devices for real-time, off-site diagnosis. Anal Chem. 2008;80(10):3699–3707. doi: 10.1021/ac800112r. [DOI] [PMC free article] [PubMed] [Google Scholar]
- 64.Stevens D. Development and Optical Analysis of a Microfluidic Point-of-Care Diagnostic Device [PhD thesis] University of Washington; Seattle, DC, USA: 2010. [Google Scholar]
- 65.Dell N, Venkatachalam S, Stevens D, Yager P, Borriello G. Towards a point-of-care diagnostic system: automated analysis of immunoassay test data on a cell phone. Proceedings of the 5th ACM Workshop on Networked Systems for Developing Regions; Washington, DC, USA. 28 June 2011. [Google Scholar]
- 66.Zhu HY, Yaglidere O, Su TW, Tseng D, Ozcan A. Cost-effective and compact wide-field fluorescent imaging on a cell-phone. Lab Chip. 2011;11(2):315–322. doi: 10.1039/c0lc00358a. [DOI] [PMC free article] [PubMed] [Google Scholar]
- 67■■.Mudanyali O, Dimitrov S, Sikora U, Padmanabhan S, Navruz I, Ozcan A. Integrated rapid-diagnostic-test reader platform on a cellphone. Lab Chip. 2012;12(15):2678–2686. doi: 10.1039/c2lc40235a. Contains a good demonstration of the mobile phone reader plus adapter approach to extend the capabilities of assays. [DOI] [PMC free article] [PubMed] [Google Scholar]
- 68.Coskun AF, Wong J, Khodadadi D, Nagi R, Tey A, Ozcan A. A personalized food allergentesting platform on a cellphone. Lab Chip. 2013;13(4):636–640. doi: 10.1039/c2lc41152k. [DOI] [PMC free article] [PubMed] [Google Scholar]
- 69.Hilder M, Winther-Jensen B, Clark NB. Paper-based, printed zinc-air battery. J Power Sources. 2009;194(2):1135–1141. [Google Scholar]
- 70.Liu H, Crooks RM. Paper-based electrochemical sensing platform with integral battery and electrochromic read-out. Anal Chem. 2012;84(5):2528–2532. doi: 10.1021/ac203457h. [DOI] [PubMed] [Google Scholar]
- 71.Thom NK, Yeung K, Pillion MB, Phillips ST. Fluidic batteries in paper-based microfluidic devices. Lab Chip. 2012;12(10):1768–1770. doi: 10.1039/c2lc40126f. [DOI] [PubMed] [Google Scholar]
- 72.Preechaburana P, Gonzalez MC, Suska A, Filippini D. Surface plasmon resonance chemical sensing on cell phones. Angew Chem Int Ed Engl. 2012;51(46):11585–11588. doi: 10.1002/anie.201206804. [DOI] [PubMed] [Google Scholar]
- 73.Preechaburana P, Suska A, Filippini D. Embedded adaptive optics for ubiquitous lab-on-a-chip readout on intact cell phones. Sensors (Basel) 2012;12(7):8586–8600. doi: 10.3390/s120708586. [DOI] [PMC free article] [PubMed] [Google Scholar]
- 74.Liu C, Mauk MG, Bau HH. A disposable, integrated loop-mediated isothermal amplification cassette with thermally actuated valves. Microfluid Nanofluidics. 2011;11(2):209–220. doi: 10.1007/s10404-011-0788-3. [DOI] [PMC free article] [PubMed] [Google Scholar]
- 75■■.LaBarre P, Hawkins KR, Gerlach J, et al. A simple, inexpensive device for nucleic acid amplification without electricity-toward instrument-free molecular diagnostics in low-resource settings. Plos ONE. 2011;6(5):e19738. doi: 10.1371/journal.pone.0019738. Contains an excellent demonstration of a non-instrumented heating method that is appropriate for use in devices for low-resource settings. [DOI] [PMC free article] [PubMed] [Google Scholar]
- 76.Govindarajan AV, Ramachandran S, Vigil GD, Yager P, Boehringer KF. A low cost point-of-care viscous sample preparation device for molecular diagnosis in the developing world; an example of microfluidic origami. Lab Chip. 2012;12(1):174–181. doi: 10.1039/c1lc20622b. [DOI] [PubMed] [Google Scholar]
- 77■.Osborn JL, Lutz B, Fu E, Kauffman P, Stevens DY, Yager P. Microfluidics without pumps: reinventing the T-sensor and H-filter in paper networks. Lab Chip. 2010;10(20):2659–2665. doi: 10.1039/c004821f. Contains interesting demonstrations of using porous materials to create classic microfluidic devices. [DOI] [PMC free article] [PubMed] [Google Scholar]
- 78.Abbas A, Brimer A, Slocik JM, Tian LM, Naik RR, Singamaneni S. Multifunctional analytical platform on a paper strip: separation, preconcentration, and subattomolar detection. Anal Chem. 2013;85(8):3977–3983. doi: 10.1021/ac303567g. [DOI] [PubMed] [Google Scholar]
- 79.Lewis G, Robbins J, Phillips S. Phase-switching depolymerizable poly(carbamate) oligomers for signal amplification in quantitative time-based assays. Macromolecules. 2013;46:5177–5183. [Google Scholar]
- 80.Rohrman BA, Richards-Kortum RR. A paper and plastic device for performing recombinase polymerase amplification of HIV DNA. Lab Chip. 2012;12(17):3082–3088. doi: 10.1039/c2lc40423k. [DOI] [PMC free article] [PubMed] [Google Scholar]
- 81.Ge L, Wang SM, Song XR, Ge SG, Yu JH. 3D origami-based multifunction-integrated immunodevice: low-cost and multiplexed sandwich chemiluminescence immunoassay on microfluidic paper-based analytical device. Lab Chip. 2012;12(17):3150–3158. doi: 10.1039/c2lc40325k. [DOI] [PubMed] [Google Scholar]
- 82.Li W, Li L, Ge S, et al. A 3D origami multiple electrochemiluminescence immunodevice based on a porous silver-paper electrode and multi-labeled nanoporous gold-carbon spheres. Chem Commun (Camb) 2013;49(70):7687–7689. doi: 10.1039/c3cc42662a. [DOI] [PubMed] [Google Scholar]
- 83.Wang S, Ge L, Yan M, et al. 3D microfluidic origami electrochemiluminescence immunodevice for sensitive point-of-care testing of carcinoma antigen 125. Sens Actuators B Chem. 2013;176:1–8. [Google Scholar]
- 84.Becker H. Integrated microfluidic devices in diagnostics. Med Device Technol. 2010;1(4) [Google Scholar]
- 85.Mariella R., Jr Sample preparation: the weak link in microfluidics-based biodetection. Biomed Microdevices. 2008;10(6):777–784. doi: 10.1007/s10544-008-9190-7. [DOI] [PMC free article] [PubMed] [Google Scholar]
- 86.Kaplan WA. Can the ubiquitous power of mobile phones be used to improve health outcomes in developing countries? Global Health. 2006;2(9) doi: 10.1186/1744-8603-2-9. [DOI] [PMC free article] [PubMed] [Google Scholar]
Websites
- 101.Boakye LSN, Smyth C. Mobiles4Dev Report. 2010 www.cto.int/wp_content/themes/solid/_layout/dc/ptojects/UNICEF%20Mobiles4Dev%20Report.pdf.
- 102.MobiSante. Mobile and Accessible Ultrasound Imaging. www.mobisante.com.
- 103.Sparkfun. www.sparkfun.com.