
Figure 8. Ladder-bar readout for a glucose assay.
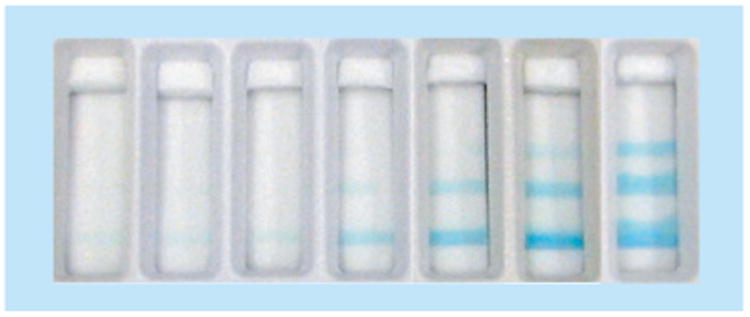
A sample consisting of 0, 1, 5, 25, 50, 100 and 200 μm glucose was added to the strip, from left to right, respectively.
Reproduced with permission from [53] © Elsevier (2009).
Official websites use .gov
A
.gov website belongs to an official
government organization in the United States.
Secure .gov websites use HTTPS
A lock (
) or https:// means you've safely
connected to the .gov website. Share sensitive
information only on official, secure websites.
A sample consisting of 0, 1, 5, 25, 50, 100 and 200 μm glucose was added to the strip, from left to right, respectively.
Reproduced with permission from [53] © Elsevier (2009).