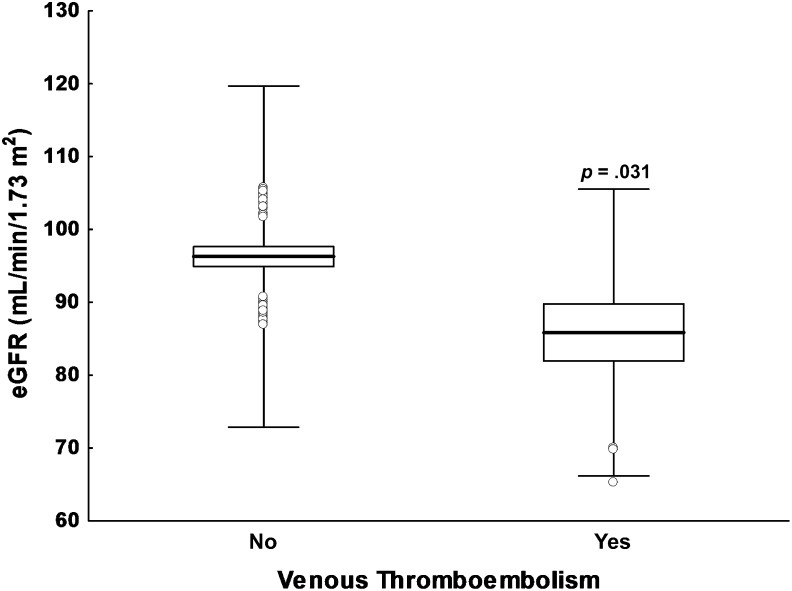
Figure 1.
Box-plot analysis of pretreatment eGFR distribution. Comparison of cancer patients who experienced a first episode of venous thromboembolism during platinum-based chemotherapy and those who did not. Data are presented as mean values (solid lines), standard errors (columns), and standard deviations (whiskers). Open circles indicate outliers.
Abbreviation: eGFR, estimated glomerular filtration rate.

