

Ten percent tumor shrinkage is validated as a reliable early predictor of outcome in metastatic renal cell carcinoma patients receiving vascular endothelial growth factor-targeted therapies. Given the utility of this response indicator in multiple reports, 10% tumor shrinkage may provide a simple and practical aid for therapeutic decision making if used in clinical trials and practice with a prospective evaluation.
Keywords: Renal cell carcinoma, VEGF-targeted therapy, RECIST 1.0, Choi, Tumor shrinkage
Abstract
Background.
Vascular endothelial growth factor (VEGF)-targeted agents are standard therapies for metastatic renal cell carcinoma (mRCC), associated with variable tumor shrinkage. Response Evaluation Criteria in Solid Tumors (RECIST) is of limited utility in this setting, and other imaging changes are sought to reliably predict outcome early. We aim to validate 10% tumor shrinkage as the best early indicator of outcome.
Methods.
In this institutional review board-approved, Health Insurance Portability and Accountability Act-compliant study, 66 mRCC patients with 165 lesions on clinical trials of VEGF-targeted agents underwent thoracic and abdominal computed tomography at baseline and at first follow-up after therapy. Measurements were performed according to RECIST and tumor shrinkage of ≥10% decrease in sum of the longest diameter (−10%SLD). Correlation with time-to-treatment failure (TTF) and overall survival (OS) were compared and stratified by response to the radiologic criteria. Receiver-operating characteristics (ROC) analysis yielded the optimal threshold change in SLD, defining patients with prolonged survival.
Results.
More than −10%SLD significantly differentiated responders from nonresponders (median TTF 8.4 vs. 4.1 months, p = .001), whereas partial response by RECIST did not (median TTF 6.9 vs. 5.5 months in responders vs. nonresponders, p = .34). −10%SLD was also significantly predictive of OS (median OS 35.1 vs. 15.0 months in responders vs. nonresponders, p = .003). ROC curve analysis yielded −9.3% in SLD as the optimal threshold for response/no response.
Conclusion.
Ten percent tumor shrinkage is validated as a reliable early predictor of outcome in mRCC patients receiving VEGF-targeted therapies and may provide a practical measure to guide therapeutic decisions.
Implications for Practice:
Tumor shrinkage of 10% on first follow-up computed tomography after initiation of therapy predicts time-to-treatment failure and overall survival in this validation cohort of metastatic renal cell carcinoma patients treated with antiangiogenic therapies. Given the utility of this response indicator in multiple reports, 10% tumor shrinkage may provide a simple and practical aid for therapeutic decision making if used in clinical trials and practice with a prospective evaluation.
Introduction
Molecular targeted therapies have revolutionized the treatment of metastatic renal cell carcinoma (mRCC), resulting in significant survival benefits in treated patients despite variable amounts of tumor shrinkage [1]. Antiangiogenic therapies are known to decrease tumor vascularization rather than result in direct cytotoxicity and have been associated with lesser degrees of tumor shrinkage than traditional antitumor agents, with typical objective response rates ranging from 10% to 40% [2–6]. Many patients do not achieve 30% tumor shrinkage to indicate partial response in these reports, and it is commonly accepted that response evaluation criteria in solid tumors (RECIST) may be of limited utility in discriminating patients responding to such therapies.
Computed tomography (CT) is a robust, widely available imaging modality routinely used in the assessment of patients’ tumor burden throughout treatment and in monitoring patients for therapy-related toxicities. Several investigators have sought to optimize tumor response assessment via imaging, such that imaging indicators better correlate with clinical benefit and survival outcomes early in the treatment course. Although the shortcomings of the conventional RECIST criteria in this setting are known, there is no consensus as to the preferred response assessment method. Several alternative tumor shrinkage thresholds have been proposed, namely 10% and 20% long axis diameter reductions, either alone [7, 8] or in combination with other CT imaging response criteria, such as attenuation [9–13]. Ten percent tumor shrinkage as an indicator of response has been supported in a study of patients treated with sunitinib in a multicenter phase III trial [7] as well as in another study of multiple imaging indicators of response in patients treated with bevacizumab, sorafenib, and sunitinib [8]. Ten percent reduction in the long axis diameter of target lesions is also a component of response according to Choi criteria [14], recently applied to patients with mRCC [9, 12, 13]. Twenty percent long axis reductions are components of favorable response in the recently developed size and attenuation CT (SACT) and morphology, attenuation, size, and structure (MASS) criteria [10, 11].
In a previous study of 70 mRCC patients treated with first-line sunitinib, sorafenib, or bevacizumab, four criteria of early postimaging changes were compared, including RECIST 1.0, 10% tumor diameter shrinkage, CT attenuation of tumor, and Choi criteria in assessing time-to-treatment failure (TTF) and overall survival (OS) [8]. Ten percent tumor shrinkage at first follow-up was demonstrated statistically significant in predicting TTF and OS, whereas other criteria were not. However, given the retrospective nature of the study, it is necessary to validate the results in an independent cohort and reproduce the association between 10% tumor shrinkage and survival, to propose use in future prospective clinical trials and clinical practice.
The purpose of the present study is to determine whether 10% tumor shrinkage can differentiate responders from nonresponders in an independent validation cohort of mRCC patients enrolled in prospective clinical trials of vascular endothelial growth factor (VEGF) inhibitors. We hypothesize that 10% tumor shrinkage at first follow-up, as demonstrated in our previous report and others [7, 8], represents a more clinically meaningful response assessment than RECIST 1.0. If found reproducible, a 10% tumor shrinkage criterion could be widely applicable to mRCC patients, to identify patients likely to benefit from treatment early after initiation of therapy.
Patients and Methods
Patients and Treatment
The study sample consists of patients with metastatic renal cell carcinoma enrolled in six recent and ongoing multicenter, open-label studies of VEGF-targeted agents (vatalanib, sunitinib, sorafenib, pazopanib, foretinib, and tivozanib) (3, 15–19). Patients were part of approved Institutional Review Board (IRB) protocols for advanced renal cell carcinoma (RCC) at the institution in which baseline and follow-up clinical data were prospectively collected, and this study was approved by the IRB and is Health Insurance Portability and Accountability Act compliant. Patients enrolled in these trials who had been included in a previous study cohort were excluded from this validation cohort [8]. All patients had histologically confirmed stage IV mRCC. Patients were treated at standard doses of study drug according to the assigned protocol until they experienced disease progression, severe or intolerable toxicity, or withdrew consent. Compliance was checked after each cycle with a treatment diary.
Imaging and Image Analysis
Patients eligible for analysis included those with target lesions by RECIST who underwent noncontrast-enhanced or contrast-enhanced CT of the chest, abdomen, and pelvis before and after VEGF-targeted therapy initiation, with pre- and post-therapy scans at the same institution. The routine oncology protocol was used on multidetector CT scanners (64 detector row) using oral contrast in all patients and intravenous contrast in patients with adequate estimated glomerular filtration rate (eGFR) and no known allergy to the contrast. Contrast-enhanced scans were performed after 75–100 cc nonionic contrast administration (Ultravist; Bayer HealthCare, Leverkusen, Germany, http://www.bayer.com; based on eGFR), empirically timed with chest images obtained in the arterial phase (30-second delay) and abdominal images obtained in the portal venous phase (70-second delay). Images were reviewed and measured on a Picture Archiving and Communication System (Centricity; General Electric, Milwaukee, WI, http://www.gehealthcare.com).
Up to three target lesions in each patient were selected on the baseline CT, according to RECIST 1.0 [20], by a single board-certified radiologist with 8 years of experience in cancer imaging, blinded to patient outcomes. At baseline and first follow-up, the longest axial axis of each target was recorded to the nearest millimeter, as described previously [8]. Sum of the longest diameter (SLD) of the targets was recorded at baseline and at first follow-up of all patients.
RECIST response, including partial response (PR) and progressive disease (PD), was recorded at CT follow-up, based on ≥30% decrease in SLD for PR and ≥20% increase in SLD for PD [20]. Patients not meeting either were tabulated as stable disease (SD). Whereas RECIST response according to RECIST 1.0 was studied in this report, the RECIST categorizations are thought to be comparable to those according to the updated RECIST 1.1 criteria, because the definitions of PR, PD, and SD are unchanged [21, 22]. Ten percent decrease in SLD was also examined as an independent predictor of outcome.
Clinical outcome data were gathered by review of medical records, including date of treatment failure (progression as determined by RECIST) and date of death. TTF was defined as time from treatment initiation until failure, including progression and death. Patients who did not progress were censored on the date of last follow-up. OS was defined as the time from treatment initiation until death. Alive patients were censored on the date of last follow-up.
Statistical Analysis
Patients were classified into responders (PR) versus SD or PD, according to RECIST 1.0. The survival distribution for patients in the two groups was estimated according to the Kaplan-Meier method [23]. The difference in the survival distribution between the groups was evaluated using the log-rank test. An analysis of RECIST 1.0 clinical benefit, PR or SD versus PD, was not performed as only one patient had PD at the time of first follow-up, rendering this invalid. To explore any effect modifier among baseline characteristics in the relationships between decrease in SLD and survival outcomes, bivariate analyses were performed using Cox proportional hazard models in an exploratory fashion.
Receiver-operating characteristics (ROC) analysis was used to determine the optimal threshold change in SLD at first CT follow-up to define patients with survival end point (death or censored at the end of the study), similar to Thiam et al. [7]. After confirming validity of the area under the ROC curve (AUC) in an accuracy test using a traditional point-system classification, Youden’s index in the ROC analysis was calculated for the series of Ki-67 values observed in the data. We identified the threshold that minimized the false-positive and false-negative rates for best detecting prolonged survival, selecting patients with treatment benefit.
Results
Patients
Sixty-six patients with 165 target lesions were eligible for the study and evaluated (Table 1). Thirty-nine patients of the cohort had clear cell RCC histology (59%), 22 patients had papillary (33%), 2 patients each had chromophobe and unavailable histologic subtype, and 1 patient had predominant sarcomatoid features in addition to having clear cell histology.
Table 1.
Patient demographic and disease characteristics of the 66 patients
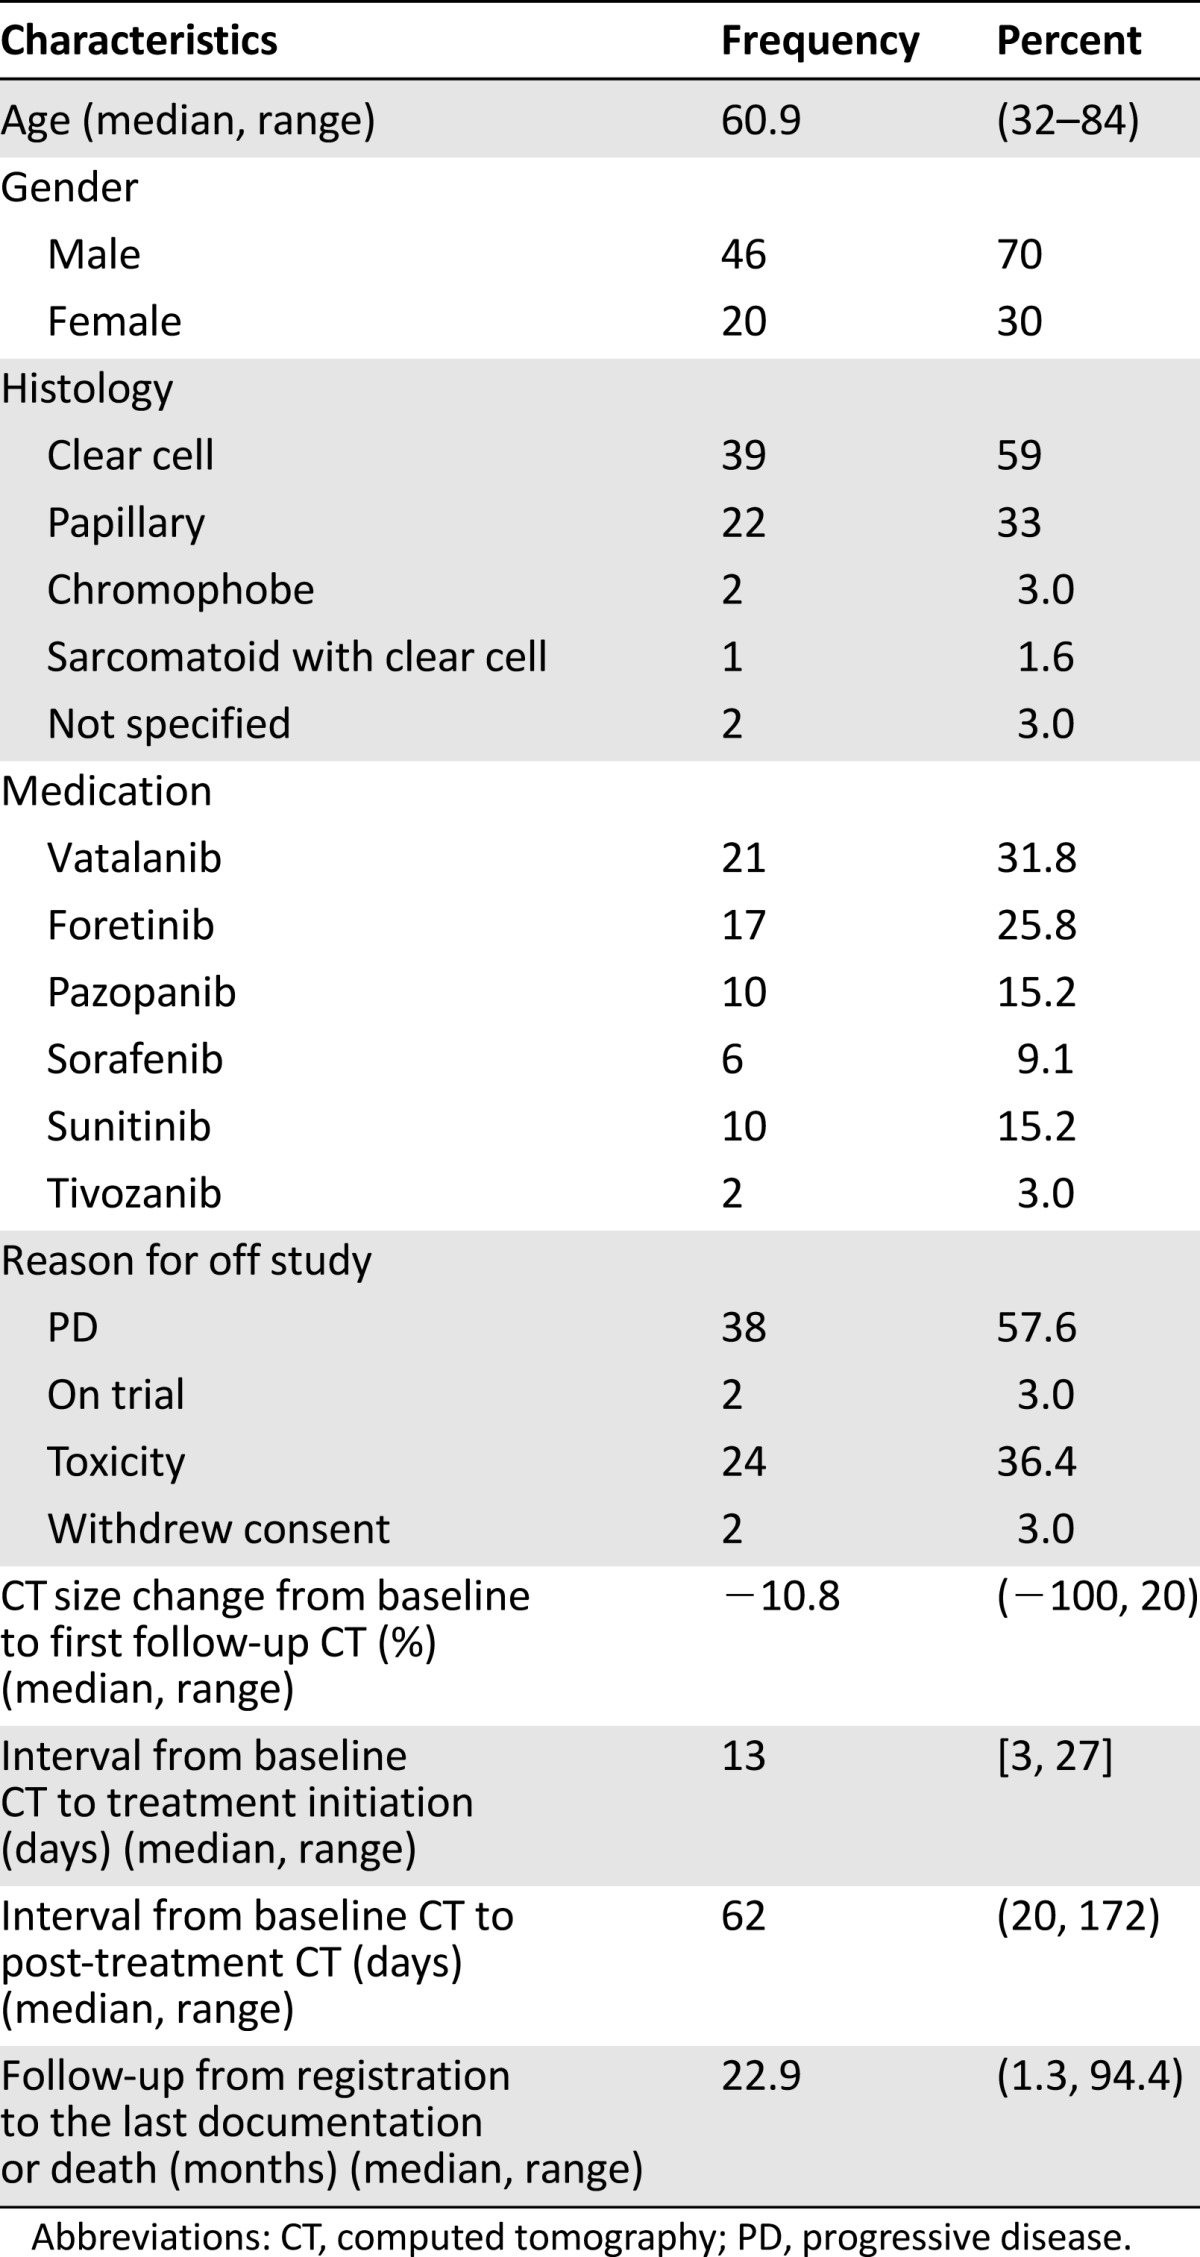
The median age at targeted therapy initiation was 60.9 years. Twenty-one patients (32%) were treated with vatalanib, 17 patients (26%) with foretinib, 10 patients (15%) each with pazopanib and sunitinib, 6 patients (9%) with sorafenib, and 2 patients (3%) with tivozanib. Median time from baseline CT to drug initiation was 13 days, and median time from baseline to first post-treatment CT was 62 days (range 20–172 days). The observed outlier of 172 days in time from baseline to first post-treatment CT lay in 7 times the interquartile range (52 to 67 days) above the third quartile among all samples. All 66 patients were evaluated according to RECIST 1.0 and 10% tumor shrinkage thresholds.
Using the selected target lesions for this study, most patients (59 patients, 89%) were SD according to RECIST 1.0 at first post-treatment CT, whereas 6 were PR (9%) and 1 was PD (2%). Using 10% tumor shrinkage to indicate response, 33 patients achieved 10% tumor shrinkage and were considered responders (50%; Fig. 1), whereas 33 patients achieved less than 10% tumor shrinkage, deemed nonresponders. Proportional changes of SLD in reference to baseline in all but one of the study patients at the time of first follow-up CT ranged from 52% decrease in SLD to 20% increase in the SLD of target lesions (Fig. 2). One patient with a single measurable target lesion in the peritoneum at baseline experienced significant tumor shrinkage such that the target lesion was no longer measurable at first follow-up CT, although nontarget ascites fluid remained present, rendering the patient a PR according to RECIST.
Figure 1.

A 73-year-old man with metastatic renal cell carcinoma treated with foretinib. Axial contrast-enhanced computed tomography (CT) images at baseline (A and B) demonstrate target right adrenal and retroperitoneal metastases (black measurement lines), measuring 31 mm and 58 mm in long axis, respectively. Axial contrast-enhanced CT at first follow-up after treatment initiation (C and D) demonstrates approximately 10% decrease in the sum of the longest diameter of the targets (black measurement lines), measuring 28 mm and 52 mm, respectively.
Figure 2.

Range of change in the sum long axis diameter of target lesions at first follow-up computed tomography (CT). Responder patients with 10% tumor shrinkage at the time of the first follow-up CT (blue bars) had median time-to-treatment failure (TTF) and overall survival (OS) of 8.4 and 35.1 months, respectively, whereas nonresponder patients who did not achieve at least 10% tumor shrinkage (red bars) had median TTF and OS of 4.1 and 15.0 months (p = .0014 and .0032, respectively).
No patient who achieved 10% tumor shrinkage at first follow-up on retrospective assessment developed a new lesion or was deemed as having progressive disease at the time of the original response assessment.
Association Between Early Post-Therapy Imaging Changes and Clinical Outcome
The TTF for patients with PR (median 6.9 months) was not significantly different from patients with SD or PD (median 5.5 months, p = .34; Fig. 3A). Similarly, the OS for patients with PR (median not reached, NR) was not significantly different from patients with SD or PD (median 25.5 months, p = .72; Fig. 3B).
Figure 3.

Time to treatment failure (TTF) and overall survival (OS) stratified by RECIST response at first follow-up computed tomography. (A): TTF stratified by RECIST response (PR) versus no response (SD + PD). TTF was not significantly different between RECIST responders and nonresponders (6.9 vs. 5.5 months, p = .3418). Partial response occurred in 6 patients at first follow-up, 6 events; 60 patients were nonresponders (SD + PD; 57 events and 3 censored). (B): OS stratified by RECIST response (PR) versus no response (SD + PD). OS was not significantly different between RECIST responders and nonresponders (not reached vs. 25.5 months, p = .7185). Partial response occurred in 6 patients at first follow-up, with 3 patients deceased and 3 censored; 60 patients were nonresponders (SD + PD; 43 deceased and 17 censored).
Abbreviations: PD, progressive disease; PR, partial response; RECIST, Response Evaluation Criteria In Solid Tumors; SD, stable disease.
Tumor shrinkage of ≥10% decrease in SLD significantly differentiated responders (n = 33, median TTF 8.4 months) from nonresponders (n = 33, median TTF 4.1 months, p = .001; Fig. 4A). Ten percent decrease in SLD was also significantly predictive of overall survival (with responders OS of 35.1 months vs. nonresponders OS of 15.0 months, p = .003; Fig. 4B). Bivariate Cox proportional hazards models showed that 10% decrease in SLD was a significantly robust predictor of TTF (p = .001) and OS (p = .01), respectively, after controlling for either baseline age, gender, drug, histology, or Memorial Sloan-Kettering Cancer Center risk (low/intermediate vs. high), whereas none of the controlled factors was significant.
Figure 4.

Time-to-treatment failure (TTF) and overall survival (OS) stratified by first follow-up computed tomography response according to >10% decrease in size versus no response. (A): TTF stratified by response according to ≥10% decrease in size versus no response (<10% decrease in size). TTF was significantly different between responders who achieved 10% decrease in size and nonresponders who did not (8.4 vs. 4.1 months, p = .0014). The ≥10% tumor shrinkage occurred in 33 patients at first follow-up, with 30 events and 3 censored; 33 patients were nonresponders (33 events). (B): OS stratified by response according to ≥10% decrease in size versus no response (<10% decrease in size). OS was significantly different between responders who achieved 10% decrease in size and nonresponders who did not (35.1 vs. 15.0 months, p = .0032). The ≥10% tumor shrinkage occurred in 33 patients at first follow-up, with 18 patients deceased and 15 censored; 33 patients were nonresponders, with 28 patients deceased and 5 censored.
Abbreviation: SLD, sum of the longest diameter.
Threshold Evaluation by ROC Analysis
For tumor shrinkage threshold evaluation, ROC curve analysis yielded −9.3% in SLD (maximum Youden index score 0.28) as the optimal threshold for response/no response with respect to OS.
Discussion
We evaluated RECIST response and tumor shrinkage as practical and reproducible imaging predictors of benefit from various VEGF-targeted therapies in mRCC patients treated in recent and ongoing clinical trials. In our study of 66 patients, a sizable cohort with respect to similar literature, a 10% decrease in target SLD was a reliable predictor of TTF and OS outcomes on first follow-up CT. This finding lends further support to the 10% tumor shrinkage threshold as an indicator of response in this setting, as previously advocated in the literature [7, 8]. Such early changes in post-therapy imaging enable us to distinguish responder patients and aid in patient management in three ways: (a) permitting patients who achieve this degree of tumor shrinkage to continue treatment with greater confidence, (b) limiting unnecessary toxicities to patients without evidence of treatment benefit, and (c) enabling these patients to consider other therapies.
The 10% tumor shrinkage threshold as an indicator of response to VEGF-targeted therapies in mRCC patients has been supported by analysis of a prior phase III study of sunitinib in which 10% tumor shrinkage was the best predictor of survival in 334 treated patients, including ROC analysis of various other shrinkage thresholds [7]. The advocated −10% threshold in this study and the −30% threshold for PR according to RECIST were reached after the first cycle of therapy in 73% and 19% of cases, respectively [7]. Ten percent tumor shrinkage was also a significant predictor of TTF and OS, whereas RECIST and Choi criteria were not predictive in another study of patients treated with bevacizumab, sunitinib, and sorafenib [8]. The current study lends further support to the applicability and utility of 10% tumor shrinkage as an early indicator of response in mRCC patients treated with a variety of VEGF-targeted therapies, as class-specific tumor response criteria rather than drug-specific.
Choi criteria have been applied to mRCC patients treated with VEGF-targeted therapies, with differing conclusions on the applicability of these criteria in different reports. Choi criteria similarly incorporate 10% tumor shrinkage into “response,” or 15% decrease in mean tumor CT attenuation. In one such report by van der Veldt et al. [9], Choi criteria better delineated responders and nonresponders to therapy compared with RECIST, but did not indicate early progression. Thereafter, Choi criteria were found to early discriminate patients benefiting from treatment in at least one other report [12], although they did not significantly correlate with survival outcomes in others [8, 13, 24]. In each of these studies, Choi criteria were more likely to characterize patients as responders than other criteria in general, regardless of outcome. Technical CT parameters, contrast, CT attenuation measurement variability, and patient variables most likely contribute to the differences in results observed. In addition, no singular attenuation change threshold has been found to correlate with survival [8], raising questions regarding the applicability of the 15% decreased attenuation component of this response schema in the mRCC population.
Similarly, the SACT and subsequent MASS criteria were developed to delineate response in mRCC patients treated with sunitinib and sorafenib. These criteria include 20% tumor shrinkage, marked central necrosis, or marked decreased attenuation as components of favorable response, whereas 20% increase in size, new lesions, marked central fill-in, or new enhancement are features of unfavorable response [10, 11]. Pretherapy schema have been recently combined with the MASS criteria to improve accuracy [24], offering a unique clinical and imaging response model. However, drawbacks of these criteria include arbitrary correlation with progression-free survival >250 days, exclusion of lung lesions, and volumetric measurements necessitating another workstation in SACT. In contrast to these methods, the 10% tumor shrinkage assessment method described in this work may be advantageous because of the simplicity of single long axis diameter measurements of only three target lesions, which can be performed on a routine clinical basis without added time or a separate additional workstation, as is needed in volumetric measurements.
The unmet clinical need and utility of more generalized tumor response criteria are emphasized by various criteria evaluated in recent literature. A tumor response criterion that is generalizable as well as indicative of treatment benefit, such as one based on a tumor shrinkage threshold, is preferred and sought in this population. CT scanning is widely available and serves multiple purposes in the care of patients with widespread metastatic renal cell carcinoma. It is commonly used to assess the following: (a) patients’ overall tumor burden in terms of growth patterns and distribution; (b) individual sites of metastatic disease to anticipate and limit troublesome disease-related complications via alternative, focused treatments (such as surgery or radiation to spinal metastases that may result in cord compression); and (c) evidence of treatment-related toxicities, potentially before the patient develops symptoms (such as pneumatosis intestinalis and/or hemorrhage in VEGF-targeted treatments) (25, 26). A simple, reliable measurement schema that has a better correlation with survival than RECIST can easily be incorporated into routine clinical practice at any center, regardless of scan protocol. Furthermore, single kidney patients with elevated eGFR or those with allergy may be assessed accordingly using the 10% tumor shrinkage, without the necessity of intravenous contrast.
There are several limitations to this study. For instance, the imaging review was performed retrospectively, by a single oncoradiologist, and patients were treated at a single institution. Given the small number of patients and the retrospective nature of the study, comparison of the 10% tumor shrinkage threshold with the RECIST criteria is limited and should not be overinterpreted. In fact, in this study, we applied the RECIST definitions of partial response, stable disease, and progressive disease to the time of first follow-up CT rather than assess RECIST response at all study time points. Of note, most RECIST responses do happen within 2 months (60 days median). According to Thiam et al. [7], 64% of partial responses were achieved within two cycles of sunitinib treatment. Therefore, it is likely that we captured most patients who achieved partial response for the best response during their treatment course, as a result of the timing of the first follow-up CTs.
Our purpose was to evaluate early changes in tumor burden on first CT follow-up and correlate these imaging changes with survival. Although nadir tumor burden or “best overall response” is important, this information is not available until a patient has finished therapy. Early tumor shrinkage is useful because it can be assessed prospectively in all patients. Our results show that early tumor shrinkage is informative, although the results of our study should be interpreted in the context of the study design. Another persistent limitation in this validation cohort is that it may be difficult to place patients close to the threshold (9% decrease) in the appropriate response category, but this would be true for any criteria using a threshold.
Measurement reproducibility in this cohort was separately evaluated [27]. In this study, we found 10% tumor shrinkage was a reproducible radiologic response indicator when baseline and follow-up studies were measured by a single radiologist. However, 10% tumor shrinkage was within the range of interobserver measurement variability. The validation study findings must be considered in this context. Some of the benefits of the patient cohort in this study include fairly homogeneous timing of the baseline and follow-up scans. Patients in this study were on clinical trials of various VEGF-targeted agents, whereas patients in a previous study were not treated on trials [8]. Second, data and conclusions from this study may be applicable to mRCC patients treated with VEGF-targeted therapies in general.
Conclusion
The 10% tumor shrinkage threshold is predictive of survival in this validation cohort of mRCC patients treated with VEGF-targeted therapies. ROC analysis identified 9.3% decrease in SLD at first follow-up as the best size predictor of time-to-treatment failure. Thus, a reduction of 10% in the sum long axis diameter of targets is validated as a reliable, early predictor of outcome in this setting. Given the utility of this response indicator in multiple reports, the 10% tumor shrinkage may provide a simple and practical aid for therapeutic decision making if used in clinical trials and practice with a prospective evaluation.
Footnotes
Editor's Note: See the related commentary by Helen X. Chen et al. on page 439.
Author Contributions
Conception/Design: Katherine M. Krajewski, Nikhil Ramaiya, Toni K. Choueiri
Provision of study material or patients: Toni K. Choueiri
Collection and/or assembly of data: Katherine M. Krajewski, Mizuki Nishino, André P. Fay, Toni K. Choueiri
Data analysis and interpretation: Katherine M. Krajewski, Yoko Franchetti, Mizuki Nishino, André P. Fay, Nikhil Ramaiya, Annick D. Van den Abbeele, Toni K. Choueiri
Manuscript writing: Katherine M. Krajewski, Yoko Franchetti, Mizuki Nishino, Nikhil Ramaiya, Annick D. Van den Abbeele, Toni K. Choueiri
Final approval of manuscript: Katherine M. Krajewski, Yoko Franchetti, Mizuki Nishino, André P. Fay, Nikhil Ramaiya, Annick D. Van den Abbeele
Disclosures
Katherine M. Krajewski: General Electric (RF); Toni K. Choueiri: Pfizer, Aveo, Exilixis, Novartis (C/A). The other authors indicated no financial relationships.
(C/A) Consulting/advisory relationship; (RF) Research funding; (E) Employment; (ET) Expert testimony; (H) Honoraria received; (OI) Ownership interests; (IP) Intellectual property rights/inventor/patent holder; (SAB) Scientific advisory board
References
- 1.Heng DY, Xie W, Regan MM, et al. External validation and comparison with other models of the International Metastatic Renal Cell Carcinoma Database Consortium prognostic model: A population based study. Lancet Oncol. 2013;14:141–148. doi: 10.1016/S1470-2045(12)70559-4. [DOI] [PMC free article] [PubMed] [Google Scholar]
- 2.Yang JC, Haworth L, Sherry RM, et al. A randomized trial of bevacizumab, an anti-vascular endothelial growth factor antibody, for metastatic renal cancer. N Engl J Med. 2003;349:427–434. doi: 10.1056/NEJMoa021491. [DOI] [PMC free article] [PubMed] [Google Scholar]
- 3.Motzer RJ, Michaelson MD, Redman BG, et al. Activity of SU11248, a multitargeted inhibitor of vascular endothelial growth factor receptor and platelet-derived growth factor receptor, in patients with metastatic renal cell carcinoma. J Clin Oncol. 2006;24:16–24. doi: 10.1200/JCO.2005.02.2574. [DOI] [PubMed] [Google Scholar]
- 4.Motzer RJ, Hutson TE, Tomczak P, et al. Sunitinib versus interferon alfa in metastatic renal-cell carcinoma. N Engl J Med. 2007;356:115–124. doi: 10.1056/NEJMoa065044. [DOI] [PubMed] [Google Scholar]
- 5.Escudier B, Eisen T, Stadler WM, et al. TARGET Study Group Sorafenib in advanced clear-cell renal-cell carcinoma. N Engl J Med. 2007;356:125–134. doi: 10.1056/NEJMoa060655. [DOI] [PubMed] [Google Scholar]
- 6.Motzer RJ, Michaelson MD, Rosenberg J, et al. Sunitinib efficacy against advanced renal cell carcinoma. J Urol. 2007;178:1883–1887. doi: 10.1016/j.juro.2007.07.030. [DOI] [PubMed] [Google Scholar]
- 7.Thiam R, Fournier LS, Trinquart L, et al. Optimizing the size variation threshold for the CT evaluation of response in metastatic renal cell carcinoma treated with sunitinib. Ann Oncol. 2010;21:936–941. doi: 10.1093/annonc/mdp466. [DOI] [PubMed] [Google Scholar]
- 8.Krajewski KM, Guo M, Van den Abbeele AD, et al. Comparison of four early posttherapy imaging changes (EPTIC; RECIST 1.0, tumor shrinkage, computed tomography tumor density, Choi criteria) in assessing outcome to vascular endothelial growth factor-targeted therapy in patients with advanced renal cell carcinoma. Eur Urol. 2011;59:856–862. doi: 10.1016/j.eururo.2011.01.038. [DOI] [PubMed] [Google Scholar]
- 9.van der Veldt AA, Meijerink MR, van den Eertwegh AJ, et al. Choi response criteria for early prediction of clinical outcome in patients with metastatic renal cell cancer treated with sunitinib. Br J Cancer. 2010;102:803–809. doi: 10.1038/sj.bjc.6605567. [DOI] [PMC free article] [PubMed] [Google Scholar]
- 10.Smith AD, Lieber ML, Shah SN. Assessing tumor response and detecting recurrence in metastatic renal cell carcinoma on targeted therapy: Importance of size and attenuation on contrast-enhanced CT. AJR Am J Roentgenol. 2010;194:157–165. doi: 10.2214/AJR.09.2941. [DOI] [PubMed] [Google Scholar]
- 11.Smith AD, Shah SN, Rini BI, et al. Morphology, attenuation, size, and structure (MASS) criteria: Assessing response and predicting clinical outcome in metastatic renal cell carcinoma on antiangiogenic targeted therapy. AJR Am J Roentgenol. 2010;194:1470–1478. doi: 10.2214/AJR.09.3456. [DOI] [PubMed] [Google Scholar]
- 12.Schmidt N, Hess V, Zumbrunn T, et al. Choi response criteria for prediction of survival in patients with metastatic renal cell carcinoma treated with anti-angiogenic therapies. Eur Radiol. 2013;23:632–639. doi: 10.1007/s00330-012-2640-x. [DOI] [PubMed] [Google Scholar]
- 13.Hittinger M, Staehler M, Schramm N, et al. Course of size and density of metastatic renal cell carcinoma lesions in the early follow-up of molecular targeted therapy. Urol Oncol. 2012;30:695–703. doi: 10.1016/j.urolonc.2010.10.011. [DOI] [PubMed] [Google Scholar]
- 14.Choi H, Charnsangavej C, Faria SC, et al. Correlation of computed tomography and positron emission tomography in patients with metastatic gastrointestinal stromal tumor treated at a single institution with imatinib mesylate: Proposal of new computed tomography response criteria. J Clin Oncol. 2007;25:1753–1759. doi: 10.1200/JCO.2006.07.3049. [DOI] [PubMed] [Google Scholar]
- 15.George D, Michaelson D, Oh WK, et al. Phase I study of PTK787/ZK 222584 (PTK/ZK) in metastatic renal cell carcinoma. Proc Am Soc Clin Oncol. 2003;22 abstract 1548. [Google Scholar]
- 16.Stadler WM, Figlin RA, McDermott DF, et al. ARCCS Study Investigators Safety and efficacy results of the advanced renal cell carcinoma sorafenib expanded access program in North America. Cancer. 2010;116:1272–1280. doi: 10.1002/cncr.24864. [DOI] [PubMed] [Google Scholar]
- 17.Motzer RJ, Hutson TE, Reeves J et al. Randomized open-label phase III trial of pazopanib versus sunitinib in first-line treatment of patients with metastatic renal cell carcinoma (MRCC): Results of the COMPARZ trial. Paper presented at: 2012 ESMO Congress; October 1, 2012, Abstract LBA8; Vienna, Austria. [Google Scholar]
- 18.Choueiri TK, Vaishampayan U, Rosenberg JE, et al. Phase II and biomarker study of the dual MET/VEGFR2 inhibitor foretinib in patients with papillary renal cell carcinoma. J Clin Oncol. 2013;31:181–186. doi: 10.1200/JCO.2012.43.3383. [DOI] [PMC free article] [PubMed] [Google Scholar]
- 19.Hutson TE, Rathmell K, Hudes GR, et al. A phase II biomarker assessment of tivozanib in oncology (BATON) trial in patients (pts) with advanced renal cell carcinoma (RCC) J Clin Oncol. 2012 30(suppl):abstract TPS4686. [Google Scholar]
- 20.Therasse P, Arbuck SG, Eisenhauer EA, et al. New guidelines to evaluate the response to treatment in solid tumors. European Organization for Research and Treatment of Cancer, National Cancer Institute of the United States, National Cancer Institute of Canada. J Natl Cancer Inst. 2000;92:205–216. doi: 10.1093/jnci/92.3.205. [DOI] [PubMed] [Google Scholar]
- 21.Eisenhauer EA, Therasse P, Bogaerts J, et al. New response evaluation criteria in solid tumours: Revised RECIST guideline (version 1.1) Eur J Cancer. 2009;45:228–247. doi: 10.1016/j.ejca.2008.10.026. [DOI] [PubMed] [Google Scholar]
- 22.Nishino M, Jagannathan JP, Ramaiya NH, et al. Revised RECIST guideline version 1.1: What oncologists want to know and what radiologists need to know. AJR Am J Roentgenol. 2010;195:281–289. doi: 10.2214/AJR.09.4110. [DOI] [PubMed] [Google Scholar]
- 23.Kaplan EL, Meier P. Nonparametric estimation from incomplete observations. J Am Stat Assoc. 1958;53:457–481. [Google Scholar]
- 24.Smith AD, Shah SN, Rini BI, et al. Utilizing pre-therapy clinical schema and initial CT changes to predict progression-free survival in patients with metastatic renal cell carcinoma on VEGF-targeted therapy: A preliminary analysis. Urol Oncol. 2013;31:1283–1291. doi: 10.1016/j.urolonc.2011.08.010. [DOI] [PubMed] [Google Scholar]
- 25.Coriat R, Ropert S, Mir O, et al. Pneumatosis intestinalis associated with treatment of cancer patients with the vascular growth factor receptor tyrosine kinase inhibitors sorafenib and sunitinib. Invest New Drugs. 2011;29:1090–1093. doi: 10.1007/s10637-010-9458-7. [DOI] [PubMed] [Google Scholar]
- 26.Sonpavde G, Bellmunt J, Schutz F, et al. The double edged sword of bleeding and clotting from VEGF inhibition in renal cancer patients. Curr Oncol Rep. 2012;14:295–306. doi: 10.1007/s11912-012-0237-9. [DOI] [PubMed] [Google Scholar]
- 27.Krajewski KM, Nishino M, Franchetti Y, et al. Intraobserver and interobserver variability in computed tomography size and attenuation measurements in patients with renal cell carcinoma receiving antiangiogenic therapy: Implications for alternative response criteria. Cancer. 2014;120:711–721. doi: 10.1002/cncr.28493. [DOI] [PMC free article] [PubMed] [Google Scholar]