

Abstract
Previous studies have shown that near-IR reflectance and transillumination imaging can be used to acquire high contrast images of early caries lesions and composite restorative materials. The aim of the study was to determine the optimum near-IR wavelengths for imaging demineralized areas under dental sealants. Fifteen natural human premolars and molars with occlusal lesions were used in this in vitro study. Images before and after application of sealants were acquired using near-IR reflectance and near-IR transillumination at wavelengths of 1300 nm, 1460 nm, and 1500 – 1700 nm. Images were also acquired using polarization sensitive optical coherence tomography for comparison. The highest contrast for near-IR reflectance was at 1460 nm and 1500 – 1700 nm. These near-IR wavelengths are coincident with higher water absorption. The clear Delton sealant investigated was not visible in either co-polarization or cross-polarization OCT images. The wavelength region between 1500-1700-nm yielded the highest contrast of lesions under sealants for near-IR reflectance measurements.
Keywords: Near-IR imaging, optical coherence tomography, dental caries, dental sealants
1. INTRODUCTION
Near-IR reflectance and transillumination and optical coherence tomography (OCT) are new imaging techniques operating in the wavelength region from 1300-1700-nm which are capable of imaging caries lesions with high contrast [1–7]. We have found that 1300-nm yields the highest contrast for transillumination while wavelengths with higher water absorption 1450-nm and 1500-1700-nm yield the highest contrast for near-IR reflectance. Several studies have demonstrated the utility of optical coherence tomography for measuring defects in composite restorations and sealants, the marginal adaptation of sealants and the presence of secondary or residual caries [8–12]. Recent studies have shown that near-IR reflectance and transillumination can be used to enhance the contrast of composite restorations and detect secondary caries (see paper #8929-26 in this proceedings) [13]. The contrast of composites and sealants is enhanced since they do not contain as much water as enamel and dentin. The purpose of this paper was to determine the influence of a clear sealant on the contrast of small natural caries lesions in the pits and fissures of tooth occlusal surfaces measured using near-IR reflectance and transillumination. Polarization sensitive optical coherence tomography (PS-OCT) was employed to confirm the severity of the occlusal lesion.
It is recommended that preventive resin sealants be placed on the occlusal surfaces of posterior teeth on patients with deep fissures or a history of caries. Resin sealants prevent decay by acting as a physical barrier to acidogenic bacteria. However, sealants are not always successful in preventing the development of lesions. Sealants are typically sold with opaque or clear shades. The opaque shades contain an optical opacifier, titanium dioxide, which strongly attenuates near-IR light. The opaque sealant is preferred by many clinicians since it is more visible on the tooth.
Jones et al. [9] demonstrated that decay under sealants can be quantified with PS-OCT and there have been other subsequent studies showing the utility of OCT for imaging caries lesion under sealants.
In the previous study of Jones et al. [9], it was discovered that the composites/sealants did not scramble (depolarize) the incident polarized light nor were they birefringent. Therefore it appeared most advantageous to analyze the lesion severity under sealants using the cross-polarization images. This was a significant advantage of using the CP-OCT image in addition to the reduction of strong reflections at the air/tooth and tooth composite interfaces. The co-polarization images can also be used to detect the lesions under the sealant however there are distinct disadvantages. However, there have been studies utilizing conventional OCT systems to image sealants [14]. Holtzman et al. used a conventional OCT system to detect sealants placed over natural lesions [11].
Near-IR reflectance measurements yield high contrast for both artificial and natural caries lesions without interference from stains and color variations since none of the known chromophores absorb light in the near-IR beyond 1300-nm. More recent near-IR imaging studies suggest that near-IR wavelengths coincident with areas of higher water absorption are well suited for the detection of early demineralization on tooth surfaces. We hypothesize that higher water absorption in the underlying dentin and enamel reduces the reflectivity in sound areas and this in turn results in higher contrast between sound and demineralized enamel. Hyperspectral reflectance measurements by Zakian show that the tooth appears darker with increasing wavelength [7]. A recent study by Chung et al. [13] of natural occlusal lesions indicated that other near-IR wavelengths where water absorbs provided significantly higher contrast than at 1310-nm and the visible.
2. MATERIALS AND METHODS
2.1 Sample Preparation
Fifteen human teeth with suspected lesion in the occlusal surfaces were collected (CHR approved) and sterilized with gamma radiation. Teeth were visually examined and those that scored ICDAS 1 or 2 were selected. Teeth were mounted in black orthodontic acrylic blocks. Samples were stored in a moist environment of 0.1% thymol to maintain tissue hydration and prevent bacterial growth. The outlines of 5×5 mm windows approximately 50-μm deep were cut on the occlusal surface of each tooth using a CO2 laser (Impact 2500, GSI Lumonics Rugby, UK) around the suspected lesion area. The channels cut by the laser serve as reference points for serial sectioning and are sufficiently narrow that they do not interfere with calculations of the image contrast.
A clear sealant (without an optical opacifier), DELTON® FS+ Pit and Fissure Sealant (Dentsply, York, PA) was applied to the suspect fissure area according to the manufacturers instructions before and after images were acquired of the occlusal surface. A Diamond suspension (3000 mesh- 6 μm) from Crystalite Co. Lewis Center, OH was sprayed onto the tooth surface to show the surface of the sealant for PS-OCT imaging in order to determine the sealant thickness.
2.2 Digital Microscopy
Images of the tooth occlusal surfaces were examined using a digital microscopy/3D surface profilometry system, the VHX-1000 from Keyence (Elmwood, NJ) with the VH-Z25 lens with a magnification from 25 to 175×. Images were acquired by scanning the image plane of the microscope and reconstructing a depth composition image with all points at optimum focus displayed in a 2D image.
2.3 Near-IR Cross Polarization Reflectance Images
In order to acquire reflected light images, NIR light was directed towards the occlusal surface through a broadband fused silica beamsplitter (1200-1600-nm) Model BSW12 (Thorlabs, Newton, NJ) and the reflected light from the tooth was transmitted by the beamsplitter to the imaging camera. Crossed polarizers were placed after the light source and before the detector and used to remove specular reflection (glare) that interferes with measurements of the lesion contrast. The NIR reflectance images were captured using a 320 × 240 element InGaAs area camera SU320-KTSX (Wakefield, MA) from Sensors Unlimited (Princeton, NJ) with a 25-μm pixel pitch. Reflectance measurements were taken for three spectral bands using two bandpass filters and a longpass filter. The band pass filters were BP1300-90 and BP1460-85 from Spectrogon (Parsippany, NJ) and the 1500-nm long-pass filter was the FEL 1500 from Thorlabs (Newton, NJ).
2.4 Near-IR Transillumination Images
A 150-W fiber-optic illuminator FOI-1 E Licht Company (Denver, CO) with a low profile fiber optic with dual line lights, Model P39-987 (Edmund Scientific, Barrington, NJ) was used with each light line directed at the cementoenamel junction (CEJ) beneath the crown on the buccal and lingual sides of each tooth. Light leaving the occlusal surface was directed by a right angle prism to the SU320 InGaAs camera equipped with a Navitar (Rochester, NY) SWIR-35 lens, a 75-mm plano-convex lens LA1608-C Thorlabs (Newton, NJ) and a 90-nm wide bandpass filter centered at 1300-nm, BP1300-90 Spectrogon, (Parsippany, NJ).
2.5 PS-OCT System
An all fiber-based Optical Coherence Domain Reflectometry (OCDR) system with polarization maintaining (PM) optical fiber, high speed piezoelectric fiber-stretchers and two balanced InGaAs receivers that was designed and fabricated by Optiphase, Inc., Van Nuys, CA was used to acquire the images. This two-channel system was integrated with a broadband superluminescent diode (SLD) Denselight (Jessup, MD) and a high-speed XY-scanning system (ESP 300 controller & 850G-HS stages, National Instruments, Austin, TX) for in vitro optical tomography. This system is based on a polarization-sensitive Michelson white light interferometer. The high power (15-mW) polarized SLD source operated at a center wavelength of 1317 nm with a spectral bandwidth FWHM of 84 nm provided an axial resolution of 9-μm in air and 6-μm in enamel (refractive index = 1.6). This light was aligned with the slow axis of the PM fiber of the source arm of the interferometer. The sample arm was coupled to an AR coated fiber-collimator to produce a 6-mm in diameter, collimated beam. That beam was focused onto the sample surface using a 20-mm focal length AR coated plano-convex lens. This configuration provided axial resolution of 9-μm and a lateral resolution of approximately 20 μm with a signal to noise ratio of greater than 40–50 dB. Both orthogonal polarization states of the light scattered from the tissue are coupled into the slow and fast axes of the pm- fiber of the sample arm. A quarter wave plate set at 22.5° to horizontal in the reference arm rotated the polarization of the light by 45° upon reflection. After being reflected from the reference mirror and the sample, the reference beams were recombined by the pm fiber-coupler. A polarizing cube splits the recombined beam into its horizontal and vertical polarization components or “slow” and “fast” axis components, which were then coupled by single mode fiber optics into two detectors. The light from the reference arm was polarized at 45° and therefore split evenly between the two detectors. Readings of the electronically demodulated signal from each receiver channel represent the intensity for each orthogonal polarization of the backscattered light. Neutral density filters are added to the reference arm to reduce the intensity noise for shot limited detection. The all-fiber OCDR system is described in reference [15]. The PS-OCT system is completely controlled using Labview™ software (National Instruments, Austin, TX). Acquired scans are compiled into b-scan files. Image processing was carried out using Igor Pro™, data analysis software (Wavemetrics Inc, Lake Oswego, Oregon).
2.6 Image Analysis and Statistics
Line profiles were extracted at the same position from the most severe area of each image across each 5 × 5 mm window and lesion or image contrast was calculated using the equation (IS-IL)/IS; where IS is the mean intensity of the sound enamel outside the window area, and IL is the mean intensity of the lesion inside the window for fluorescence measurements. Reflectance and visible measurements (IL-IS)/IL have the reverse contrast, i.e., the intensity in lesion areas is higher than for the sound enamel. The image contrast varies from 0–1 with 1 being very high contrast and 0 no contrast. All image analysis was carried out using Igor pro software (Wavemetrics, Lake Oswego, OR). A one-way analysis of variance (ANOVA) followed by the Tukey-Kramer post-hoc multiple comparison test was used to compare groups for each type of lesion employing Prism software (GraphPad, San Diego, CA).
3. RESULTS AND DISCUSSION
Figure 1 shows PS-OCT b-scans taken of the occlusal surface of one of the teeth before and after application of the sealant. The sealant is not visible in either the cross polarization or the co-polarization images. This was not anticipated since in our previous study using another clear sealant Aeliteflo (Bisco, Schaumburg, Illinois) we found that the sealant was clearly visible in the co-polarization image but was not visible in the cross polarization image [9]. This indicated that the sealant neither scrambled the polarization (due to increased scattering) or rotated the polarization axis (birefringence). Therefore, the scattering in the Delton sealant is very low. We anticipated that the reflectance at the sealant surface would be much higher allowing easy measurement of the sealant thickness. However, it was very difficult to resolve the surface reflection for either polarization state. This was quite unexpected; if a drop of water is placed in the fissure the surface of the water droplet can be clearly resolved in the OCT images. The sealant does have a higher refractive index ~ 1.5 vs. 1.3 for water which would reduce the magnitude of the reflection. It is also likely that the cured and solidified surface of the sealant is not perfectly smooth like a liquid resulting in less specular reflection.
Fig. 1.

PS-OCT scans (∥ & ⊥) of an occlusal fissure before application of the sealant (A,D) after application of the sealant(B,E) and with the diamond suspension added (C,F) to view the sealant surface.
It was necessary to view the sealant in the OCT images and measure the thickness. In order to do this we sprayed a 6-μm diamond powder suspension onto the tooth surface which rendered the sealant surface clearly visible without greatly reducing the OCT imaging depth.
Figure 2 shows near-IR reflectance measurements of a tooth before and after sealant placement for three wavelength regions 1300-nm, 1450-nm and 1500-1700-nm. The highest lesion contrast for the samples was at 1450-nm and 1500-1700-nm before application of the sealant. After application of the sealant the greatest % reduction in contrast occurred at 1450-nm and 1500-1650-nm. After application of the sealant the highest contrast was for 1500-1700-nm. This can be easily explained by water absorption in the sealant and in the tooth. Without the sealant the highest contrast is measured at wavelengths with high water absorption since the reflectivity of the sound regions of enamel and dentin are greatly reduced. However there is also water absorption by the sealant and it is sufficiently strong at 1450-nm to reduce the contrast. The magnitude of water absorption is lower at 1500-1650-nm, therefore the influence of water absorption in the sealant is not as significant. These results suggest that the wavelength range of 1500-1700-nm is best suited for near-IR reflectance measurements.
Fig. 2.

Near-IR reflectance images before application of the sealant at 1300, 1450, and 1500-1700-nm (A,C,E) and after application of the sealant at 1300, 1450, and 1500-1700-nm (B,D,F).
Figure 3 shows near-IR transillumination images at 1300-nm of a tooth before and after placement of the sealant. Previous studies have shown that 1300-nm performs best for transillumination of the occlusal surfaces. The other wavelengths 1450-nm and 1500-1700-nm failed to yield high contrast due to the high water content of the underlying dentin. Moreover, near-IR transillumination yields poor contrast for shallow lesions on tooth surfaces [16].
Fig. 3.
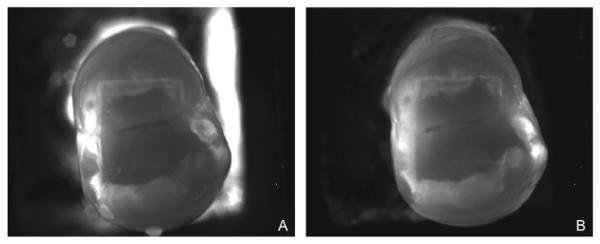
Near-IR transillumination images acquired at 1300-nm before (A) and after (B) application of the sealant.
In our previous study [9], the clear sealant (Aeliteflo) was only visible in the co-polarization state and we did not anticipate that the clear Delton sealant would not be visible in both polarization states [9]. This suggests that the scattering coefficient is lower for the Delton sealant. This is certainly advantageous for conventional OCT systems where it will be easier to measure the demineralization under sealants.
Even though the clear sealant was invisible in OCT images it did reduce the contrast in both near-IR reflectance and transillumination. Attenuation was greater in the sealant for wavelengths with higher water absorption, namely 1450-nm and from 1500-1700-nm and greatly reduced the lesion contrast. It appeared that the wavelength range from 1500-1700-nm was best suited for imaging demineralization under the sealants since the contrast remained high even after the reduction caused by water absorption in the sealant.
ACKNOWLEDGEMENTS
The authors acknowledge the support of NIH grants R01-DE14698 and R01-DE17869. The authors would like to thank Michal Staninec and Jacob Simon for their help with this study.
5. REFERENCES
- 1.Bühler CM, Ngaotheppitak P, Fried D. Imaging of occlusal dental caries (decay) with near-IR light at 1310-nm. Optics Express. 2005;13(2):573–582. doi: 10.1364/opex.13.000573. [DOI] [PubMed] [Google Scholar]
- 2.Jones R, Huynh G, Jones G, Fried D. Near-infrared transillumination at 1310-nm for the imaging of early dental decay. Optics Express. 2003;11(18):2259–2265. doi: 10.1364/oe.11.002259. [DOI] [PubMed] [Google Scholar]
- 3.Fried D, Featherstone JDB, Darling CL, Jones RS, Ngaotheppitak P, Buehler CM. Early Caries Imaging and Monitoring with Near-IR Light. W. B Saunders Company; Philadelphia: 2005. [DOI] [PubMed] [Google Scholar]
- 4.Fried D, Buhler CM, Ngaotheppitak P, Darling CL. Near-IR imaging of interproximal lesions from occlusal surfaces and the influence of stains and plaque. SPIE Proceeding. 2006;6137:61370N. [Google Scholar]
- 5.Staninec M, Douglas SM, Darling CL, Chan K, Kang H, Lee RC, Fried D. Nondestructive Clinical Assessment of Occlusal Caries Lesions using Near-IR Imaging Methods. Lasers in Surgery and Medicine. 2011;43(10):951–959. doi: 10.1002/lsm.21139. [DOI] [PMC free article] [PubMed] [Google Scholar]
- 6.Staninec M, Lee C, Darling CL, Fried D. In vivo near-IR imaging of approximal dental decay at 1,310 nm. Lasers in Surgery and Medicine. 2010;42(4):292–298. doi: 10.1002/lsm.20913. [DOI] [PMC free article] [PubMed] [Google Scholar]
- 7.Zakian C, Pretty I, Ellwood R. Near-infrared hyperspectral imaging of teeth for dental caries detection. Journal of Biomedical Optics. 2009;14(6):064047. doi: 10.1117/1.3275480. [DOI] [PubMed] [Google Scholar]
- 8.Otis LL, al-Sadhan RI, Meiers J, Redford-Badwal D. Identification of occlusal sealants using optical coherence tomography. J Clin Dent. 2003;14(1):7–10. [PubMed] [Google Scholar]
- 9.Jones RS, Staninec M, Fried D. Imaging artificial caries under composite sealants and restorations. Journal of Biomedical Optics. 2004;9(6):1297–1304. doi: 10.1117/1.1805562. [DOI] [PubMed] [Google Scholar]
- 10.Makishi P, Shimada Y, Sadr A, Tagami J, Sumi Y. Non-destructive 3D imaging of composite restorations using optical coherence tomography: marginal adaptation of self-etch adhesives. Journal of Dentistry. 2011;39(4):316–325. doi: 10.1016/j.jdent.2011.01.011. [DOI] [PubMed] [Google Scholar]
- 11.Holtzman JS, Osann K, Pharar J, Lee K, Ahn YC, Tucker T, Sabet S, Chen Z, Gukasyan R, Wilder-Smith P. Ability of optical coherence tomography to detect caries beneath commonly used dental sealants. Lasers in Surgery and Medicine. 2010;42(8):752–759. doi: 10.1002/lsm.20963. [DOI] [PMC free article] [PubMed] [Google Scholar]
- 12.Stahl J, Kang H, Fried D. Imaging simulated secondary caries lesions with cross polarization OCT. SPIE Proceeding. 2010;7549:754905. doi: 10.1117/12.849332. [DOI] [PMC free article] [PubMed] [Google Scholar]
- 13.Chung S, Fried D, Staninec M, Darling CL. Multispectral near-IR reflectance and transillumination imaging of teeth. Biomed. Opt. Express. 2011;2(10):2804–2814. doi: 10.1364/BOE.2.002804. [DOI] [PMC free article] [PubMed] [Google Scholar]
- 14.Otis LL, Al-Sadhan RI, Meiers J, Redford-Badwal D. Identification of Occlusal Sealants using Optical Coherence Tomography. J. Clin. Dent. 2000;14(1):7–10. [PubMed] [Google Scholar]
- 15.Bush J, Davis P, Marcus MA. All-Fiber Optic Coherence Domain Interferometric Techniques. SPIE Proceeding. 2000;4204:71–80. [Google Scholar]
- 16.Wu J, Fried D. High contrast near-infrared polarized reflectance images of demineralization on tooth buccal and occlusal surfaces at λ= 1310-nm. Lasers in Surgery and Medicine. 2009;41(3):208–213. doi: 10.1002/lsm.20746. [DOI] [PMC free article] [PubMed] [Google Scholar]