Abstract
A frequency-modulated fluorescence encoding method was used as a means to increase the number of fluorophores monitored during infrared-mediated polymerase chain reaction. Laser lines at 488-nm and 561-nm were modulated at 73- and 137-Hz, respectively, exciting fluorescence from the dsDNA intercalating dye, EvaGreen, and the temperature insensitive dye, ROX. Emission was collected in a color-blind manner using a single photomultiplier tube for detection and demodulated by frequency analysis. The resulting frequency domain signal resolved the contribution from the two fluorophores as well as the background from the IR lamp. The detection method was successfully used to measure amplification of DNA samples containing 104 – 107 starting copies of template producing an amplification efficiency of 96%. The utility of this methodology was further demonstrated by simultaneous amplification of two genes from human genomic DNA using different color TaqMan probes. This method of multiplexing fluorescence detection with IR-qPCR is ideally suited as it allowed isolation of the signals of interest from the background in the frequency domain and is expected to further reduce the complexity of multiplexed microfluidic IR-qPCR instrumentation.
Keywords: color-blind, microfluidic, lab-on-a-chip, DNA, amplification
INTRODUCTION
Amplification of DNA by the polymerase chain reaction (PCR) has transformed a range of scientific fields, from molecular biology to forensics. In the decades since its inception, many improvements have been made to the process of PCR, such as the use of thermally stable polymerases,1 overall reduction in reagent and sample requirements,2 and the ability to quantify the PCR products during analysis (qPCR).3 The use of microfluidic devices continues to improve the process of PCR by not only reducing sample and reagent requirements, but also integrating up- and down-stream sample preparation processes leading to highly multiplexed systems.4–6
Thermal cycling was originally achieved in microfluidic devices by external heaters7, but more recent efforts have incorporated heaters into the device itself.4,5,8,9 In addition to these contact-based heating methods, other non-contact methods have been developed, which have consisted of thermal convection,10 microwave radiation,11 and IR radiation.6,12 The use of non-contact heating methods have several advantages including rapid heating rates and straightforward fabrication procedures for the microfluidic device because the heating source is built off-device, increasing the potential for them to be used in a disposable manner. IR-mediated heating, in particular, has been widely used as a means for performing PCR in glass capillaries12 as well as plastic13,14 and glass microfluidic devices.15,16 Recently, IR-mediated quantitative PCR (IR-qPCR) was realized by integrating fluorescence monitoring simultaneously with IR-mediated thermal cycling.17
qPCR allows the calibration of starting copies in unknown solutions and has been utilized in microfluidic systems using both non-contact17 and contact heating methods.18 Multi-color detection in qPCR enables numerous experiments to be performed, including addition of corrective dyes19, SNP analysis20, or amplification of multiple genes of interest21. However, little work has been described integrating multi-color fluorescence into microfluidic-based qPCR.
Most methods for multi-color fluorescence detection in microfluidic devices rely on an equivalent number of detection channels as excitation wavelengths. Color-blind methods can also be used to reduce the number of optics and detectors required for multi-color fluorescence detection. The reduction of the optical components allows for more simple and inexpensive detection systems, which when combined with the use of microfluidic devices, would be ideal for point-of-care systems.
Some methods that have been used to perform color-blind detection in microfluidic systems include pulsed multiline excitation,22 discrimination by fluorescence lifetimes,23 dual point excitation,24 and frequency encoding.25,26 In frequency encoding, the fluorescence from individual dyes are encoded by pulsing multiple lasers at non-harmonic frequencies of one another and collecting all fluorescence emission onto a single detector. The signals from the individual fluorophores are then extracted by demodulating the total signal using a Fourier transform. This removes the need for additional dichroic mirrors, band pass filters, and detectors for each fluorescence channel. The result is an increase in the S/N due to fewer optics and a built-in filtering from the frequency analysis.25,26
Frequency encoding multi-color detection should be advantageous when coupled with IR-PCR because the IR lamp is pulsed to control the temperature during thermal cycling. We expected that the method would allow us to isolate the fluorescence signals of interest from the background signal of the lamp in a straightforward manner. In this report, we demonstrate that this method of multi-color detection for IR-qPCR enables detection of at least two fluorophores during thermal cycling and that the method is general enough to be extended to more if desired.
MATERIALS AND METHODS
Chemical and Reagents
Ammonium hydroxide, sodium hydroxide, hydrochloric acid, nitric acid and hydrofluoric acid were purchased from EMD Chemicals (Philadelphia, PA). DNA primers and probes were purchased from IDT (Carlsbad, CA). SsoFast EvaGreen Supermix, SsoFast Probes Supermix, and ROX were purchased from Bio-Rad (Hercules, CA). The sequences of all primers and probes are given in the Electronic Supplementary Information. Light mineral oil was purchased from Mallinckrodt Chemicals (St. Louis, MO). Sulfuric acid was purchased from VWR (Arlington Height, IL). SigmaCote was purchased from Sigma Aldrich. Male human genomic DNA was purchased from Zyagen (San Diego, CA). pUC19 plasmid was donated by the Department of Biological Sciences, Florida State University.
Temperature Control System
The microfluidic device design was the same as previously described.17 Briefly, wet etching was used to produce two identical 2-cm channels with a 0.75 × 3 mm ellipse in the center of each channel. Access holes were drilled with a diamond-tipped drill and the etched glass was thermally bonded to another piece of glass creating the sealed channels. One of the channels was used for PCR amplification while a thermocouple (Physitemp, Clifton, NJ) was placed in the other and used as a dummy chamber. All experiments were performed with the device on the stage of a Nikon Eclipse TS100F microscope (Melville, NY). The infrared light was delivered from above by a 50 W Ushio tungsten lamp (Cypress, CA) and focused onto both of the ellipses. A 780-nm long pass filter (Thorlabs, Inc., Newton, NJ) was placed between the lamp and microfluidic device to limit the amount of UV and visible wavelengths impinging on the device. The signal from the thermocouple was passed through a TAC80B-T thermocouple-to-analog converter (Omega Engineering, Stanford, CT) and amplified 70-fold by an in-house built circuit. The thermocouple was calibrated using a six-point calibration curve from 25 – 100 °C in deionized water.
Cooling during PCR was performed by opening a TTL-modulated solenoid valve (Parker Hannifin Corp., Cleveland, OH) to flow compressed air across the microfluidic device. Pulse width modulation (PWM) was used to control the lamp intensity via a TTL-modulated relay (Crydom Co., San Diego, CA) connected in-line with the 8-V lamp power supply. PWM was performed by delivering a 1000-Hz square wave to the TTL input and the duty cycle of the square wave was modulated to control the lamp intensity. During heating, the duty cycle of the square wave was 1.00 and the solenoid valve was closed to prevent cooling. During cooling, the solenoid valve was opened and the duty cycle of the square wave was set to 0.00. For holding stages, the solenoid valve was closed and the lamp power was regulated using a proportional-integral-derivative feedback control mechanism that adjusted the duty cycle to maintain the desired temperature.
Fluorescence system
Directly below the microfluidic device was a hot mirror (FM01, Thorlabs, Inc.) to limit excess IR light. Excitation light was provided by a 488-nm Ar+ laser (ModuLaser, Centerville, UT) and a 561-nm DPSS laser (Laserglow Technologies, Toronto, ON). The lasers were focused near the edge of the focal spot of the IR lamp. The pulse rate of the 561-nm laser was controlled by TTL modulation. The 488-nm laser was modulated using a chopper (Boston Electrics Corp., Brookline, MA). Chopper frequency was controlled by an input voltage and monitored by an infrared sensor. The two laser lines were made incident on a triple band mirror (XF2054, Omega Optical, Inc., Brattleboro, VT) and focused through the hot mirror into the elliptical PCR chamber via a 10X, 0.25 NA objective. The same objective collected the emission and passed it back through the triple band mirror, a 650-nm short pass filter (Thorlabs, Inc.), and a spatial filter before it was made incident on a photomultiplier tube (PMT) with a 0.5-ms time constant (R1527P, Hamamatsu Photonics, Middlesex, NJ). A photometer (Photon Technologies International, Birmingham, NJ) housed the PMT, short pass filter, and spatial filter. The PCR program, PMT acquisition, TTL modulation of the 561-nm laser, and chopper frequency were all interfaced to a computer via an NI-PCIe 6321 data acquisition card and controlled with a LabView program written in-house, both from National Instruments (Austin, TX). The fluorescence was collected at an acquisition rate of 1000-Hz.
PCR
Sterile water, ROX, primers and DNA template were mixed in a PCR tube and the SsoFast EvaGreen Supermix was added according to the manufacturer's instructions to make the PCR solution. The final concentrations of primer and ROX were 300 nM and 600 nM, respectively. Prior to performing PCR, the channels on the device were rinsed sequentially with 1 M NaOH, 1 M HCl, and sterile deionized water for 10-min. The channels were then silanized using Sigmacote following the manufacturer's instructions. After allowing the remaining Sigmacote to evaporate, 10 μL of the PCR solution was added to the PCR channel and the access holes were covered with Microseal B Adhesive Sealer (Bio-Rad, Hercules, CA). The thermocouple was then inserted into a parallel channel filled with PCR solution without DNA template. One access hole was covered by microseal adhesive and the access hole through which the thermocouple was threaded was coved by ~5 μL of mineral oil.
A 304-bp segment of the pUC19 plasmid was amplified using starting copy numbers of 104, 105, 106, and 107. The thermal cycle included 60-s initial denaturation at 95 °C followed by 40 cycles of thermal cycling and 10-s of final extension at 72 °C. The thermal cycling protocol consisted of 5-s at 95 °C, 5-s at 55 °C, and 10-s at 72 °C.
For genomic DNA amplification using TaqMan probes, the primers, probes and DNA template were mixed with the SsoFast Probes Supermix as per manufacturer's instructions. The final concentrations of primer and probes were both 300 nM and the starting copy number of the genomic DNA was 106. The temperature protocol was the same as that used for amplification of PUC19 with the exception of a 120-s initial denaturation. Although we report starting true starting copy number, the volume of the thermocycled PCR chamber is only ~2 μL (20% of the total volume).
Data analysis
To examine the frequency response of the entire thermal cycling trace, a fast Fourier transform (FFT) with a Hanning window was taken using Origin8 (OriginLab Corp., Northampton, MA). A spectrogram was produced with MATLAB (MathWorks, Natick, MA) using a 2048-point Hanning window with a 500-point overlap to visualize the frequency of all components as a function of time. To determine how the signals at 73-and 137-Hz evolved as a function of time, a series of FFT were performed on sequential 512-ms segments and the magnitudes of the two frequencies were plotted as a function of the average time when the FFT was taken. To produce DNA amplification curves, 2500 data points corresponding to the initial 0.5 – 2-s during each extension phase from the 73-Hz signal were averaged and normalized by the average from the 137-Hz signal during the same time, and plotted as a function of thermal cycle number. The runs at each starting copy were averaged and baseline subtracted. The threshold fluorescence value was calculated as the average fluorescence from the first 5 cycles plus 5 times the standard deviation. These threshold cycles were then plotted for each starting copy and a linear regression was used to determine the PCR efficiency.26 The melting curve was constructed by plotting the derivative of the 73-Hz signal with respect to temperature as a function of temperature during the ramping to denature step, 72 °C to 95 °C, from the 35th thermal cycle.
RESULTS AND DISCUSSION
Frequency-encoded fluorescence detection has been previously used as a means for multiplexing fluorescence detection for DNA sequencing in capillary electrophoresis instruments and simultaneous determination of two color ligation-dependent probe amplification DNA fragments on a microfluidic device.25,26 We believed that this detection method could be a beneficial approach for multi-color detection in IR-qPCR as it would allow for filtering of the lamp background as well as reduce the amount of optics and detectors required to increase the applicability of this approach for point-of-care systems.
Fluorescence and heating system
The heating system for the IR-mediated PCR was identical to other reports.7,15,17 The fluorescence system was similar to our previously reported design for a single wavelength IR-qPCR17 but now included two excitation sources, a 488-nm Ar+ laser and a 561-nm DPSS laser (Figure 1). We found it necessary to incorporate a 650-nm short pass filter prior to the PMT to reduce the total photon flux from the lamp, ROX, and EvaGreen. Without the filter, the PMT signal was saturated even at low gain hindering quantitation of the signals.
Figure 1. Schematic of instrumentation for frequency-encoded fluorescence detection during IR-qPCR.

Thermal cycling was performed using a tungsten lamp and compressed air for heating and cooling, respectively. An Ar+ laser and DPSS laser were controlled and modulated by a chopper and TTL signal, respectively. The laser pulses were focused into the microfluidic device and the emission retained the same frequency as the lasers. A single PMT was used to collect all photons and was demodulated via spectral analysis to determine the contribution from each component.
Initial tests of the system were performed by adding ROX to a DNA-laden amplification solution containing the dsDNA intercalating dye, EvaGreen, and using the IR-lamp to vary the temperature of the system. As seen in Figure 2, an FFT of the resulting PMT signal showed major peaks at frequencies of 73- and 137-Hz, corresponding to the laser frequencies, and many peaks below 60-Hz. The FFT of a blank PCR solution with the temperature held at 55 °C using a data collection rate of 5000-Hz showed only the low frequency signals, indicating that these were due to the pulsing of the IR lamp. It is likely that the tungsten filament in the lamp did not have adequate response time to pulse at the 1000-Hz rate.
Figure 2. Fast Fourier transform of DNA amplification.
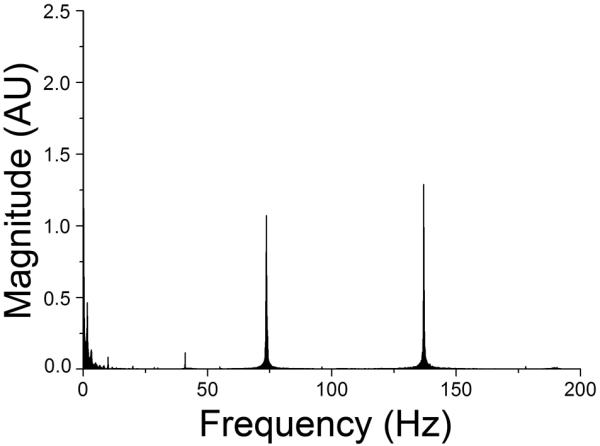
The resulting FFT from amplification of DNA shows major peaks at 73- and 137-Hz corresponding to the modulation frequencies of the 488- and 561-nm lasers, respectively. The low frequency peaks were from the pulsing of the tungsten lamp.
The modulation frequencies of the lasers were selected to avoid odd order frequencies of each other because both the chopper and TTL modulation produced square wave light pulses that are recreated in the frequency domain as a continuous function of a sine wave with the same frequency as the square wave and the sum of odd-ordered harmonics in an infinites series. Initially, laser frequencies of 53- and 71-Hz were used until it was found that the low frequency pulsing of the IR light contaminated these lower frequency signals. Increasing the laser modulation to 73- and 137-Hz allowed the noise from the lamp to be digitally excluded in post processing. Increasing the modulation frequency also produced larger gaps between harmonics, improving the signal-to-noise of each fluorophore. These larger gaps should also allow for additional excitation frequencies to be added with greater ease in the future.
Frequency-modulated fluorescence detection
DNA amplification via PCR was then performed and the detection system was used for simultaneous measurement of DNA production using EvaGreen and ROX. ROX is traditionally used in multi-well qPCR systems to correct for spatial differences in excitation and emission sensitivities as well as differences in intra-plate well volumes.19 In our single well microfluidic device, it was used to correct for differences in optical paths between devices resulting from variability in both device fabrication and location of the microfluidic chamber with respect to the excitation path.
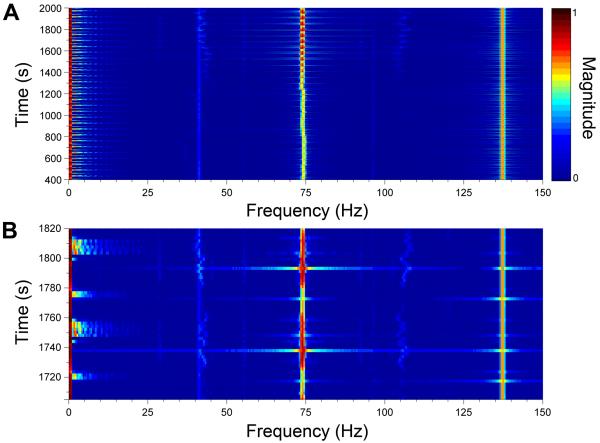
The magnitude of all frequencies as a function of time is shown in the spectrogram in Figure 3A, with the magnitude of the intensities ranging from blue to dark red as shown by the scale bar. There is a small amount of drift in the frequency of the 73-Hz signal, which is attributed to drift in the frequency of the chopper used to modulate the 488-nm laser. The frequency of the 561-nm laser was more stable at 137-Hz because of the TTL-modulated control. The magnitude of the 73-Hz signal can be seen increasing throughout the run as more DNA was amplified. The strong pulses of intensity occur during the annealing stages where most dsDNA is present. Figure 3B shows a zoomed-in view from 1705 – 1820-s corresponding to two thermal cycles. At ~1720-s, a hold at 95 °C occurred that produced an increase in the magnitude of frequencies < 60-Hz because of the lamp pulsing. Also noticeable was the relatively small signal at 73-Hz as most DNA was single stranded at this temperature. Following the hold at 95 °C, the temperature was reduced to 55 °C for annealing with a concomitant attenuation in the signal at low frequencies and an increase in the 73-Hz signal as dsDNA was produced. Ramping to extension occurred quickly and at ~1745-s, a 10-s hold at 72 °C began, where the low frequency component from the lamp pulsing can again be observed with an intermediate magnitude of the signal at 73-Hz. An increase in temperature to 95 °C for denaturation then occurred where the very low frequency component was high due to the lamp being on at full power; however the lamp was not pulsing, resulting in the smaller range of low frequencies in comparison to the temperature holding stages. In the spectrograms shown in Figure 3A and 3B, the isolation of the fluorescence signals from the low frequency signals can be seen. A more conventional view of the traces is shown in Figure 4. The magnitude of the extracted signal at 73-Hz is shown in green and from 137-Hz shown in orange with both plotted on the left y-axis while the temperature is shown in red and plotted on the right y-axis. The traces from 73- and 137-Hz correlate well with expected trends for EvaGreen and ROX, respectively.
Figure 3. Spectrogram of two-color DNA amplification.
A. The spectrogram from the entire PCR over 40 thermal cycles is shown. The two frequencies at 73- and 137-Hz corresponding to the frequencies of the 488- and 561-nm lasers, respectively, can be seen in addition to the low frequency signals associated with the lamp. B. A zoomed-in view of two thermal cycles is shown with the times corresponding to the stages of PCR shown on the right y-axis. The scale bar at the top of the figure shows the relative magnitudes of all frequencies.
Figure 4. Extracted fluorescence signals plotted with temperature.
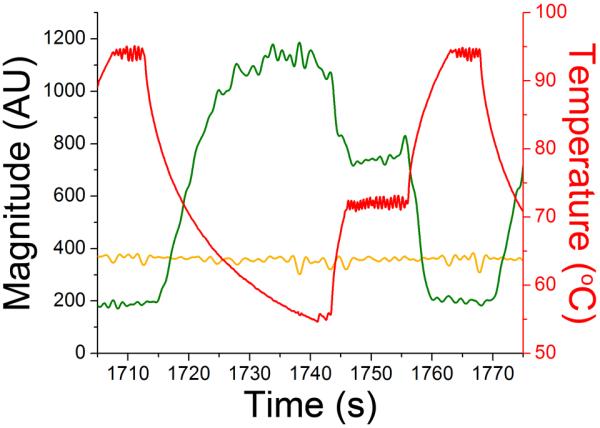
The magnitude of the extracted signals from 73-(green) and 137-Hz (orange) are plotted on the left y-axis and shown as a function of time. Temperature is shown in red and plotted on the right y-axis.
DNA quantitation
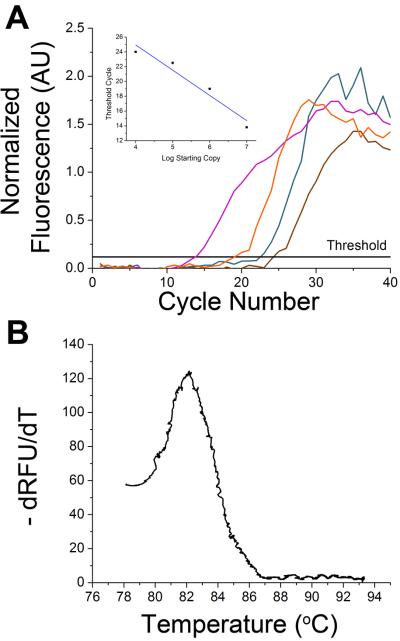
To demonstrate DNA quantitation, the baseline-corrected and normalized data during the extension phase for each thermal cycle was plotted versus cycle number (Figure 5) from samples containing different amounts of starting template copies (purple, 104; orange, 105; dark cyan, 106; brown, 107). Similar to the use of ROX in multiwell plates to correct for well-to-well differences in fluorescence sensitivies, the use of ROX in this system was used to account for variances in fluorescence sensitivies due to chip-to-chip and run-to-run differences in chip fabrication and laser placement, respectively. These curves gave the expected trend of an initial low fluorescence followed by an exponential increase in the signal at a particular threshold cycle with a plateau occurring at later cycles. The inset of Figure 5A indicates that the fluorescence at the threshold cycle was linear as a function of the log of staring copies (Y = −3.41× + 38.58) and produced an efficiency of 96%. A melt curve (Figure 5B) was used to confirm the specificity of the amplified product and showed a peak at 82 °C which agreed with the melt temperature found using a conventional thermal cycler.
Figure 5. Quantification of DNA.
A. The average normalized fluorescence from 104, 105, 106, and 107 starting copies (purple, orange, dark cyan, and brown, respectively) are plotted as a function of cycle number. The horizontal line indicates the threshold fluorescence value. The inset shows threshold cycle as a function of log starting copy number with the linear regression used to find the amplification efficiency included. B. A melting curve from the 35th cycle was obtained using data from the 73-Hz signal from 72 – 95 °C and showed a peak at 82 °C corresponding to the melting temperature obtained from a commercial instrument.
Dual-color TaqMan amplification
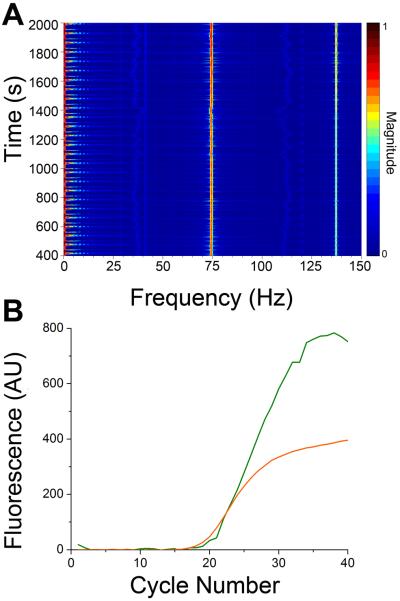
To further demonstrate the utility of the method, two housekeeping genes, ACTB and RN18S1 in human genomic DNA were simultaneously amplified using TaqMan probes. The fluorophores chosen for the probes were FAM and TAMRA which have similar excitation profiles as EvaGreen and ROX used in the pUC19 experiments. The spectrogram (Figure 6A) of the resulting amplification shows the magnitude of the frequencies corresponding to FAM (73 Hz) and TAMRA (137 Hz) fluorescence increasing as the run progressed. Figure 6B shows a more classical view of the two fluorescence traces plotted as a function of cycle number. The green trace represents FAM, while the yellow trace represents TAMRA. This successful amplification further indicates the functionality of this method, which should be expandable to more fluorophores.
Figure 6. Multiplexed TaqMan probe amplification.
A. A spectrogram detailing all frequencies detected as a function of time during amplification of ACTB and RN18S1. The frequencies of signals from the ACTB and RN18S1 probes, 73 Hz and 137 Hz respectively, increase in magnitude as the amplification progresses. B. The fluorescence of the FAM (green) and TAMRA (yellow) as a function of cycle number is shown. These signals were obtained by extracting the magnitude of the 73 and 137 Hz frequencies during the annealing stage of each thermal cycle.
CONCLUSIONS
In this study, frequency-encoded fluorescence detection was used to detect multiple fluorophores during IR-qPCR. This detection method is ideally suited for IR-qPCR because of its inherent ability to remove lamp background and it can reduce the complexity of the fluorescence detection system potentially leading to inexpensive, multiplexed point-of-care systems. The total number of fluorophores that can be incorporated continues to be limited by overlap of excitation spectra and the dynamic range of the detection system, but it is anticipated that the ability to detect multiple fluorophores will allow for increased throughput and more reproducible IR-qPCR analyses.
Supplementary Material
ACKNOWLEDGEMENTS
This work was supported in part by a grant from the National Institutes of Health (R01 DK080714). We thank Kevin Kiley and Keith Collins in the Machine Shop of the Department of Chemistry and Biochemistry at Florida State University for help in machining custom pieces for the set-up.
REFERENCES
- 1.Saiki RK, Gelfand DH, Stoffel S, Scharf SJ, Higuchi R, Horn GT, Mullis KB, Erlish HA. Science. 1988;239:487–491. doi: 10.1126/science.2448875. [DOI] [PubMed] [Google Scholar]
- 2.Khandurina J, McKnight TE, Jacobson SC, Waters LC, Foote RS, Ramsey MJ. Anal. Chem. 2000;72:2995–3000. doi: 10.1021/ac991471a. [DOI] [PubMed] [Google Scholar]
- 3.Heid CA, Stevens J, Livak KJ, Williams PM. Genome Res. 1996;6:986–994. doi: 10.1101/gr.6.10.986. [DOI] [PubMed] [Google Scholar]
- 4.Burns MA, Johnson BN, Brahmasandra SN, Handique K, Webster JR, Krishnan M, Sammarco TS, Man PM, Jones D, Heldsinger D, Mastrangelo CH, Burk DT. Science. 1998;282:484–487. doi: 10.1126/science.282.5388.484. [DOI] [PubMed] [Google Scholar]
- 5.Woolley AT, Hadley D, Landre P, deMello AJ, Mathies RA, Northrup MA. Anal. Chem. 1996;68:4081–4086. doi: 10.1021/ac960718q. [DOI] [PubMed] [Google Scholar]
- 6.Easley CJ, Karlinsey JM, Bienvenue JM, Legendre LA, Roper MG, Feldman SH, Hughes MA, Hewlett EL, Merkel TJ, Ferrance JP, Landers JP. Proc. Natl. Acad. Sci. U.S.A. 2006;103:19272–19277. doi: 10.1073/pnas.0604663103. [DOI] [PMC free article] [PubMed] [Google Scholar]
- 7.Kopp MU, de Mello AJ, Manz A. Science. 1998;280:1046–1048. doi: 10.1126/science.280.5366.1046. [DOI] [PubMed] [Google Scholar]
- 8.Oblath EA, Henley WH, Alarie JP, Ramsey MJ. Lab Chip. 2013;13:1325–1333. doi: 10.1039/c3lc40961a. [DOI] [PMC free article] [PubMed] [Google Scholar]
- 9.Chen D, Mauk M, Qui X, Liu C, Kim J, Ramprasad S, Ongagna S, Abrams WR, Malamud D, Corstjen PLAM, Bau HH. Biomed. Microdevices. 2010;12:705–719. doi: 10.1007/s10544-010-9423-4. [DOI] [PMC free article] [PubMed] [Google Scholar]
- 10.Wittwer CT, Fillmore GC, Hillyard DR. Nucleic Acids Res. 1989;11:4353–4357. doi: 10.1093/nar/17.11.4353. [DOI] [PMC free article] [PubMed] [Google Scholar]
- 11.Marchiarullo DJ, Sklavounos AH, Oh K, Poe BL, Barker NS, Landers JP. Lab Chip. 2013;13:3417–3425. doi: 10.1039/c3lc50461a. [DOI] [PubMed] [Google Scholar]
- 12.Hühmer AFR, Landers JP. Anal. Chem. 2000;72:5507–5512. doi: 10.1021/ac000423j. [DOI] [PubMed] [Google Scholar]
- 13.Giordano BC, Ferrance J, Sweedberg S, Huhmer AFR, Landers JP. Anal. Biochem. 2001;291:124–132. doi: 10.1006/abio.2000.4974. [DOI] [PubMed] [Google Scholar]
- 14.Lounsbury JA, Karlsson A, Miranian DC, Cronk SM, Nelson DA, Li J, Haverstick DM, Kinnon P, Saul DJ, Landers JP. Lab Chip. 2013;13:1384–1393. doi: 10.1039/c3lc41326h. [DOI] [PubMed] [Google Scholar]
- 15.Easley CJ, Karlinsey JM, Landers JP. Lab Chip. 2006;6:601– 610. doi: 10.1039/b600039h. [DOI] [PubMed] [Google Scholar]
- 16.Roper MG, Easley CJ, Legendre LA, Humphrey JAC, Landers JP. Anal. Chem. 2007;79:1284–1300. doi: 10.1021/ac0613277. [DOI] [PubMed] [Google Scholar]
- 17.Yu Y, Baker CA, Zang Z, Roper MG. Anal. Chem. 2012;84:2825–2829. doi: 10.1021/ac203307h. [DOI] [PMC free article] [PubMed] [Google Scholar]
- 18.Liu J, Enzelberger M, Quake S. Electrophoresis. 2002;23:1531–1536. doi: 10.1002/1522-2683(200205)23:10<1531::AID-ELPS1531>3.0.CO;2-D. [DOI] [PubMed] [Google Scholar]
- 19.Wang G, Becker E, Mesa C. Can. J. Microbiol. 2007;53:391–397. doi: 10.1139/W06-145. [DOI] [PubMed] [Google Scholar]
- 20.Landegren U, Nilsson M, Kwok P. Genome Res. 1998;8:769–776. doi: 10.1101/gr.8.8.769. [DOI] [PubMed] [Google Scholar]
- 21.Whitcombe D, Theaker J, Guy SP, Brown T, Little S. Nat. Biotechnol. 1999;17:804– 807. doi: 10.1038/11751. [DOI] [PubMed] [Google Scholar]
- 22.Lewis EK, Haaland WC, Nguyen F, Heller DA, Allen MJ, MacGregor RR, Berger CS, Willingham B, Burns LA, Scott GBI, Kittrell C, Johnson BR, Curl RF, Metzker ML. Proc. Natl. Acad. Sci. U.S.A. 2005;102:5346–5351. doi: 10.1073/pnas.0501606102. [DOI] [PMC free article] [PubMed] [Google Scholar]
- 23.Nunnally BK, He H, Li LC, Tucker SA, McGown LB. Anal. Chem. 1997;69:2392–2397. doi: 10.1021/ac961281p. [DOI] [PubMed] [Google Scholar]
- 24.Dongre C, van Weerd J, Bellini N, Osellame R, Cerullo G, van Weeghel R, Hoekstra HJWM, Pollnau M, M. Biomed. Opt. Express. 2010;1:729–735. doi: 10.1364/BOE.1.000729. [DOI] [PMC free article] [PubMed] [Google Scholar]
- 25.Alaverdian L, Alaverdian S, Bilenko O, Bogdanov I, Filippova E, Gavrilov D, Gorbovitski B, Gouzman M, Gudkov G, Domratchev S, Kosobokova O, Lifshitz N, Luryi S, Ruskovoloshin V, Stepoukhovitch A, Tcherevishnick M, Tyshko G, Gorfinkel V. Electrophoresis. 2002;23:2804–2817. doi: 10.1002/1522-2683(200208)23:16<2804::AID-ELPS2804>3.0.CO;2-9. [DOI] [PubMed] [Google Scholar]
- 26.Dongre C, van Weerd J, Besselink GAJ, Vazquez RM, Osellame R, Cerullo G, van Weeghel R, van den Vlekkert HH, Hoekstra HJWM, Pollnau M. Lab Chip. 2011;11:679–683. doi: 10.1039/c0lc00449a. [DOI] [PubMed] [Google Scholar]
Associated Data
This section collects any data citations, data availability statements, or supplementary materials included in this article.


