

Abstract
When extracellular action potentials (spikes) from cultured neurons are recorded using microelectrode arrays in open wells, their amplitudes are usually quite small (often below the noise level) despite the extracellular currents originating from the relatively large surface area of neural cell somata. In this paper rat cortical neurons were seeded into one well of a two well system separated by 3×10 μm microtunnels and then 7 days later into the second well forming a feed-forward network between two small neuronal assemblies. In contrast to measurements in the open well spikes recorded from axons within the restricted volumes imposed by the microtunnels are often several orders of magnitude larger than in the open well, with high signal to noise ratio, despite the currents originating in the much smaller surface area of the axon. Average signal amplitudes exceeding 250 μV are typical, with some signals as large as 4.5 mV (signal-to-noise ratio up to 450), twenty times greater than the maximum recorded from electrodes in adjacent but open wells. We confirm the dependence of signal amplitude on the impedance of the microtunnel and discuss possible reasons for the phenomenon.
Keywords: Axons, Microtunnels, Large spikes, MEA
I. INTRODUCTION
Extracellular action potentials recorded by MEAs from cultured neurons in open volumes of conducting media are rarely greater than 200 μV and more typically range from 10 to 100 μV [1]. Most investigators assume the recordable signals originate from the large somata, which must be located close to the electrodes (perhaps 20 μm) for signals to be large enough to be detectable [2], [3]. It is also assumed that the recording arrangement misses detection of many events whose signal amplitudes are in the noise range (less than 20 μV). Most extracellularly recorded signals are effectively a sampling of the potential field due to membrane currents, with the result that signal amplitude declines with cell-electrode separation and inversely with cell surface area and the rates of de- and re-polarization of the cell. Hence MEAs sample only a fraction of the signals from neurons in these cultures.
However, the signals may be significantly enhanced if the signal source is confined to a very small volume in direct proximity to an electrode. In the late 60's Clark and Plonsey [4] indicated that the magnitude of an extracellular potential from a nerve fiber within a nerve trunk could be 20 times greater than in an infinite medium. Although microtunnel-like devices for neural applications were originally developed in the late 70's [5], it is only recently that the microtunnel technology has become popular for neuroscience research in general [6]–[13]. In these devices a typical tunnel is designed with dimensions near or below 10 um, (e.g. 3 μm ×x10 μm in cross-section), which is too small for migration of cell bodies but permits axonal growth. A fortunate side effect of the spatial limitation is that it also results in microtunnels that have enhanced extracellular signals. In 2009, Dworak and Wheeler [8] analyzed the relationship between signal amplitudes and electrode impedances and suggested that signals in microtunnels could be as large as 2.4 mV as measured between an electrode placed within the tunnel and a distant reference electrode that is bathed in media electrically coupled to the wells on either side of the tunnels. The Claverol-Tinturé lab reported large signals (up to 8 mV for a 2 × 6 μm tunnel) recorded differentially from two otherwise isolated wells connected by a tunnel within which axons grew and propagated signals [14], [15]. This group further reported signals from electrodes within the tunnel (referenced to a well) of up to 1.5 mV. Hence, it is well established that signal amplification from axons can be obtained in a microtunnel configuration.
Here we expand upon the range of potential tunnel dimensions where this effect can be seen with conventionally sized microtunnels (3 μm × 10 μm, most commonly reported and commercially available) and commercially available microelectrode arrays (most commonly with 30 um diameter electrodes), beyond the specially fabricated electrodes designed to intersect the wells reported previously [8], [14], [15]. Further, we report amplitudes (as large as 4.5 mV) that often exceed what has been previously reported for electrodes in tunnels, with correspondingly large signal to noise ratios (up to 450). We speculate that amplitude in this range may be large enough to modulate activity on immediately adjacent axons within the tunnels, suggesting that microtunnels could be used to investigate ephaptic effects. We correlate signal amplitude with tunnel resistance. Further we note that these tunnels are long enough (400 μm) to exclude a complete traversal by dendrites [6].
II. METHODS
A. Microtunnel device fabrication
The fabrication method has been described in our previous paper [13]. First a mold made of photoresist SU-8 was fabricated on a silicon wafer in two major steps. The first part of the mold was made for the microtunnel structure. Briefly SU-8 2002 (Microchem, Inc.) was spun on a 4-inch silicon wafer at a nominal thickness of 3 μm, baked, exposed with the first mask, baked again and developed. The second part of the mold was made for the well structure. SU-8 2050 (Microchem, Inc.) was spun on at a nominal thickness of 120 μm and then baked. The second mask was aligned to marks on the first SU-8 film and then the second SU-8 film was exposed, baked again and developed. The mold was dried and made ready for casting of PDMS, which was mixed and poured slowly, spreading over the entire wafer, following by curing on a hotplate (two hours at 70 °C). The cured PDMS layer was peeled off the wafer for use. Two wells for culture and another smaller circular well for reference electrode were formed with a punch. Finally, a circular PDMS ring was placed around the entire device to form a chamber for holding cell culture media, as shown in Fig. 1(a).
Fig. 1.
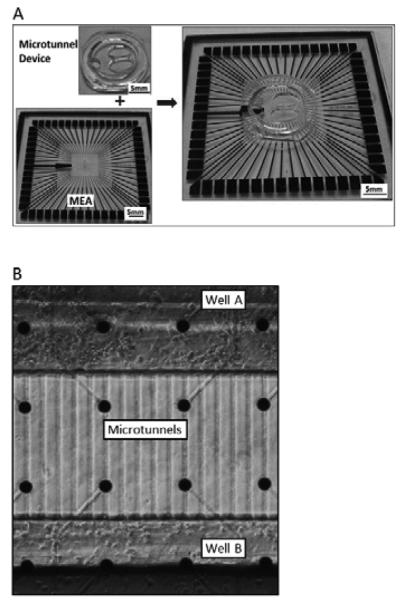
(A) Microtunnel device and MEA. The left two panels show the device and MEA separately. Note the two elliptical wells for seeding cells and the small circular hole for exposing the reference electrode. The right panel shows how it looks like when the microtunnel device is aligned and attached on MEA. (B) Neuronal cultures in wells. Cells were plated in well A first and then were plated in well B seven days later.
As shown in Fig. 1(b), two rows of electrodes were covered by the microtunnel area. The electrode diameter was 30 μm and microtunnels were 10 μm wide, which means that only a 10 μm wide stripe area on each electrode was exposed in the extremely limited space in microtunnels.
B. Cell culture
Before cell culture, each device was aligned with an MEA by using a customized aligner (XYZ plus three angular rotations) in such a way that two rows of electrodes were positioned underneath the microtunnels and each well contained three rows of electrodes. Light pressure was applied to the PDMS device to create a seal between the PDMS device and the MEA that would hold the device in place. The surfaces of MEAs were coated overnight with poly-D-lysine (PDL) solution (100 μg/ml, diluted in borate buffer at pH of 8.5). The next day the MEAs with microtunnel devices were rinsed three times by sterilized deionized water and then dried. Twenty μl of NeurobasalTM/B27/GlutaMAXTM (Invitrogen, Inc.) media was add in each culture well of a device. The MEAs with devices were kept in an incubator at 5% CO2 and 37 °C for several hours before cell plating.
Embryonic E18 rat cortical tissue was purchased from BrainBits, Inc. (Springfield, Illinois, USA) and dissociated according to the vendor’s protocol. An MEA with microtunnel device was taken out of the incubator and the media was removed from the first well, which we name Well A. Twenty μl of cell suspension (2000 cells/mm2) was added to Well A. Then the media in the other well, Well B, was removed by vacuum suction, which caused a flow in Well A and helped many cells to be located close to the tunnel openings. Next the MEAs were placed in the incubator for 10 minutes, permitting the cells to attach to the surface. Then 300 μl media was added into the media chamber of each device, providing a reservoir large enough to withstand evaporation losses without significant changes in osmolarity. Then the MEA with devices were kept in an incubator at 5% CO2 and 37 °C. Half of the media was changed every two days. Seven days later, the media was removed from Well B (without disturbing Well A), and immediately after, cells were plated in Well B with the same density as Well A. Since it was not possible to apply a vacuum to Well A, the cells in Well B could not be guided to be very close to the tunnel openings, but rather were more uniformly distributed throughout Well B. Ten minutes later 300 μl of media was added into each media chamber and all the devices were returned to the incubator [Fig. 1(b)]. The ages of the cultures (days in vitro or DIV) in this report are all referred to the date of the initial plating in Well A. Recordings were made during DIV 15 to 30.
C. MEAs and Recording
Microtunnels in each PDMS tunnel device were aligned to the two center rows of the MEAs (60MEA200/30-Ti, Multi Channel Systems, Inc.) using the aligner such that the majority of electrodes were exposed within tunnels. Recording were conducted using to a commercial multichannel signal amplifier (MEA 1060, Multi Channel Systems, Inc.) with a gain of 1200. Signals were sampled at a rate of 25 kHz using MC_Rack v3.9.1 software from Multi Channel Systems. The signal voltage range of the amplifier was set to the maximum available configuration with this A/D hardware, −3.4133 mV to +3.4133 mV.
D. Measuring Signal and Noise Amplitude
Noise amplitude was measured in both the wells and in the microtunnels for six electrodes each. The rms average was computed during non-spiking, quiet recordings. Detected spikes were those whose peak amplitudes exceeded a threshold of five times the noise.
Despite using the maximal conversion range (and minimum amplifier gain setting), action potentials were occasionally clipped to the limits (±3.4133 mV) of the settings for the A/D converter (Fig. 2). To get an estimate of the peak amplitude of such waveforms we performed limited post processing to reconstruct the partially clipped peaks of waveforms that exceeded this limit.
Fig. 2.
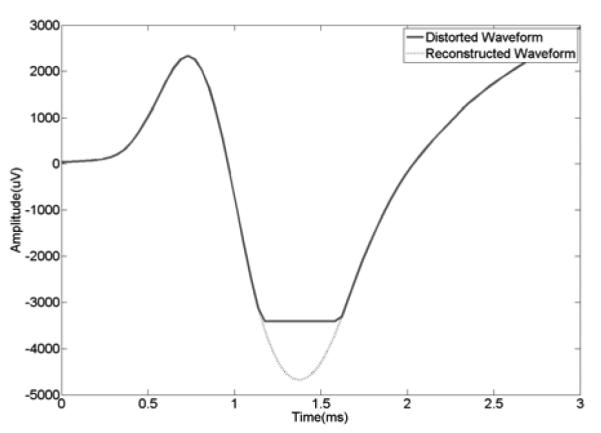
Example of reconstruction of distorted waveforms. The negative phase of the wave is clipped at −3.4133 mV. A simple cubic spline interpolation is applied to restore the clipped part. The negative peak value of the reconstructed waveform is approximately −4.7 mV.
Before doing the reconstruction, we tested two different approaches, simple cubic spline interpolation algorithm and straight line algorithm. In each test, we artificially clipped complete waveforms to use as surrogates and applied and compared the reconstructions produced by each algorithm to its original waveform. We found that the cubic spline method more faithfully reconstructed the amplitude of the negative going waveforms (see Fig. 2) and the straight line approach was better for the positive going waveforms (which comprised 25% of the clipped waveforms).
E. Measuring electrode impedances
A Precision LCR Meter (Hewlett Packard, 4284A) was used to measure impedance. An AC signal (10 mV @ 1 kHz) was applied between individual MEA recording electrodes and the MEA reference electrode with a microtunnel device attached containing 300 μl of NeurobasalTM/B27/GlutaMAXTM (Invitrogen, Inc.) media. Impedances of electrodes under microtunnels on two MEAs with cells and another two control MEAs without seeding cells were measured on different days. Impedance measurements were conducted on the first day for all MEAs without cells to serve as baseline for comparison with the following days of recording.
III. RESULTS
A. Huge spikes of axons in microtunnels
Perhaps the most noticeable feature of recording from electrodes located within microtunnels is the exceptionally large amplitude of many of the putative spikes produced by axonal propagation compared to signals from the open wells and illustrated in Fig 3. Commonly they are greater than 1 mV, and occasionally as high as 4 mV, saturating the amplifier as shown in the first row of Fig. 3. As noted, Fig. 2 shows how we estimated the actual negative peak of one signal to exceed 4.5 mV. Signals in the ranges of 2-3 mV, 1-2 mV and 0-1 mV were also frequently seen (Fig. 3).
Fig. 3.

Sample waveforms. All the waveforms in rows 1 to 4 were recorded in microtunnels. In each row, each waveform was picked up by a different electrode. The absolute value of the bigger peak of a waveform was measured and considered as the particular waveform’s amplitude. All the waveforms in the same row are in the same amplitude range, >3 mV in the 1st row, 2-3 mV in the 2nd, 1-2 mV in the 3rd and 0-1 mV in the 4th. The 5th row presents sample waveforms recorded in open wells. The scale bar is applied for all the panels.
B. A comparison of signal and noise amplitudes at the electrode-tunnel interface
The noise level in the tunnel was around 10 μV rms [Fig. 4 (a)], whereas the noise level in the wells was 2.5 μV rms [Fig. 4 (b)]. These noise levels imply signal to noise ratios of up to 450 in the microtunnels, whereas in the wells the maximum was approximately 80.
Fig. 4.

Noise level and spike amplitude distributions. (A) A raw data trace in a microtunnel. The upper panel shows a whole picture of a large spike’s waveform and noise level. The lower panel is the enlarged view of dash- lined area of the upper panel. (B) A raw data trace in a well. (C) Comparison of distributions of amplitudes between spikes in microtunnels and those in wells.
The distribution of amplitudes for wells and for microtunnels is shown in Fig. 4 (c). Most signals recorded in wells have amplitudes lower than 50 μV, which is indicated by the single high peak in the range between 0 and 50 μV. For signals recorded in microtunnels, the distribution we recorded extends to much greater amplitudes. Some peaks in the distribution reflect multiple instances of large amplitude action potentials from single neural units. The small peak around 3.4 mV results from clipped signals, whose waveforms (and peak amplitudes) were not reconstructed for this graph. Fig. 5 (a) shows the maximal peak amplitude for each tunnel electrode (x axis) over the six arrays. in this test, confirming the preponderance of large amplitude signals in the microtunnels. In this figure all the clipped waveforms were reconstructed before amplitudes were estimated. Out of the largest waveforms on the 90 electrodes in microtunnels for this test, approximately 10% were larger than 3 mV, and four were larger than 4 mV, with the largest at 4.7 mV. Even the smallest (of the set of maximum amplitudes) are greater than 0.3 mV. However, for the electrodes in wells, most were smaller than 0.2 mV [Fig. 5 (b)].
Fig. 5.

Analysis of the largest amplitudes. In five-minute recordings, the largest amplitude among all the signals recorded by each electrode was measured. Each symbol represents an electrode. (A) The largest amplitudes obtained by electrodes in microtunnels. The inset shows the percentages of different amplitude ranges. (B) The largest amplitudes obtained by electrodes in wells. The inset shows the percentages of different amplitude ranges.
C. Analysis of the impedance
To better understand the cause of the large signal amplitudes the impedances of electrodes under the microtunnels were measured from day zero to day 49 on an array both with cells and without (control). First we analyzed whether or not the large amplitudes were correlated with tunnel impedance, as shown in Fig. 6(a). The monotonic trend line indicates that higher impedance leads to larger amplitude recorded spikes.
Fig. 6.

Analysis of impedances of electrodes under microtunnels. (A) Electrode impedances vs. the largest amplitude recorded by the electrodes. The trendline (slope= 0.4 μV/kΩ, r=0.475) indicates the monotonic relationship between amplitudes and impedances. (B) Variation of impedances of electrodes under microtunnels from day zero to day 49 and the largest amplitudes picked by the electrodes from day 14 to day 35. Black trace with square data points represents the mean impedances of the electrodes in microtunnels with cells and the grey trace represents the mean impedances of electrodes in microtunnels without cells. The black triangles represent the mean values of the largest amplitudes of the signals recorded by the electrodes. Note that impedances on day zero of the non-control MEA were measured before cells were seeded.
Next we analyzed whether changes in impedance over time would correlate with amplitude. Clearly there is a change in impedance (from 1.5-2 MΩ to nearly 3 MΩ as shown in Fig. 6(b) with the maturing of the culture and growth of axons through the tunnels, a plateau phase from day 14 to day 28, and a slow decline over several weeks as the culture became less healthy. The control MEA showed no change in impedance with time. During the first two weeks the cultures are maturing and relatively inactive, and after five weeks the culture activity declines. Between days 14 and 35 amplitudes remained statistically the same while impedance declined slightly.
IV. DISCUSSION
A. The nature of the total impedance within a tunnel?
The amplitude of an extracellularly recorded signal depends not only on the size of the neuronal currents, but also on the resistivity of the surrounding media. The resistance along a microtunnel is particularly high. For sake of discussion, one can approximate the resistance seen by the axon at the electrode by the resistance from the electrode to the bath ground. For well electrodes, there is an interfacial complex impedance and a very small series bath resistance. For tunnel electrodes, the same interfacial impedance is coupled to a pair of longitudinal resistances, one to each end of the tunnel. A schematic illustrates the impedance components [Fig. 7(a), (b)].
Fig. 7.
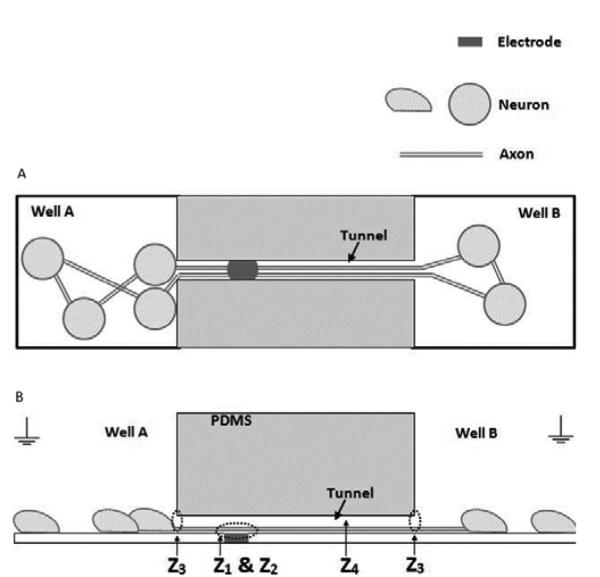
Top view (A) and cross sectional view (B) of the structure of a microtunnel device with neuronal culture, showing where the impedance Ztotal comes from.
We have measured the open bath well electrode impedance as Z1=0.2 MΩ, mostly capacitive. The tunnel resistance can be computed as R = σL(W × H), where σ is the resistance of Neurobasal medium (90 Ω cm) [16], the height H=3 μm, the width W=10 μm, and the distances from electrodes to the tunnel ends are either 100 μm or 300 μm. This yields a parallel impedance (dominantly resistive) of Z4 =2.25 MΩ. Our measured value of 1.7 MΩ is lower, presumably due to the finite width of the electrodes, which reduces the distances to tunnel ends, small variations in tunnel width, and inadvertent leakage at the PDMS – MEA glass interface. The conclusion is that the tunnel resistance is quite high and the electrode impedance only moderately influences the measurement of that tunnel resistance.
Cell growth adds a series impedance Z2 (mostly resistive) to the electrode interfacial impedance as the electrode comes to be covered by cells and adsorbs protein. At 14 days in culture we measured this as 0.270 MΩ, or an impedance increase Z2 = 0.07 MΩ. The tunnel electrode impedance increases due to the same covering of the electrode, but, more importantly the filling of the tunnel with axons and often the blocking of tunnel openings by somata (Z3). We measured the increase in tunnel resistance at over 1 MΩ to a total impedance of 3 MΩ. This reaffirms that the largest component of the total resistance, perhaps Z4=2.7 MΩ, is not due to the measuring electrode and is also seen by the axonally generated currents, leading to the large amplitude signals.
The model of the extracellular potential is one of a patch of neural membrane acting as a current source with a remote current sink, setting up a potential field. The electrode, coupled in series with a high impedance amplifier, samples the field at its location but otherwise has no significant effect on the circuit. In an open hemispherical bath a 10 um radius soma sees a resistance of 7 k ohms (σ/4πr), much less than the axon in the tunnel. Recorded extracellular action potentials occasionally exceed 50 μV, but the potential falls rapidly with distance from the cell. Inside the tunnel the impedance is perhaps 500 times greater and the recorded potential falls only linearly proportionately with distance toward the end of the tunnel. (E.g., for our dimensions a 10 μm distance from a 15 μm radius cell electrode reduces the size of the AP recorded from the well by 50%, but, within the tunnel, where the nearest well is 100 μm, the signals lose only 10% in amplitude.) Of course, the biophysics is more complex, with distribution of current source/sink along the axon membrane and finite dimensional effects and leakage in the construction of the tunnel device. More complex and accurate models are likely to show the same net effects – large amplitude signals in the tunnels and less sensitivity to exact electrode/neuron separation. The experimental question will remain: how large can these signals be? Here we have shown remarkably large signals from fairly ordinary components.
B. Could large amplitude extracellular signals affect adjacent axons?
This report presents the recording of signals ranging to over 4.5 mV in an extremely limited space, where axon fibers are very likely to be in close contact to each other. It is tempting to think that this preparation might be used as an in vitro model of unmyelinated axons within a whole nerve. An intriguing question is whether the large extracellular signals could depolarize adjacent axons. While theoretically possible, it seems more likely that the depolarization would be subthreshold for action potential initiation. Might such potentials help depolarization of other oncoming action potentials, increasing their velocity? Or, depending on phase, hyperpolarize the cells slowing down a propagating potential? In vivo experiments have shown that subthreshold interactions could alter the excitability of neighboring axons and have suggested it could enhance synchronization of adjacent axons, which would enhance the effectiveness of the temporal summation of axons within a nerve [17]–[20]. Perhaps a volley of spikes on adjacent axons would become more (or less) synchronized by such a mechanism. It seems conceivable that this microtunnel construct could provide data to test such hypotheses. How to construct an experiment where this effect can be shown is a challenge.
V. CONCLUSION
We have recorded exceptionally large extracellular spikes from axons in microtunnels, sometimes greater than 4.5 mV or 20 times greater than the largest signals in open wells. The measurements of impedances of electrodes in microtunnels show how the impedances changed with the maturation of the culture and that there was a monotonic relationship of impedance with amplitude. Theoretical calculations are consistent with these results. Overall, the technique shows considerable promise for continuing investigation of propagation of signals in axons.
VI. ACKNOWLEDGMENT
This work was supported in part by the National Institutes of Health research, grant NS 052233.
Biographies

Liangbin Pan is a Research Assistant Scientist at J. Crayton Pruitt Family Department of Biomedical Engineering at University of Florida. He received the B.S. degree in Physiology and Biophysics from Peking University and the Ph.D. degree in Biology from Tsinghua University, Beijing, China, in 2001 and 2008, respectively.
His research interests are in vitro neural engineering, mechanisms underlying neural activity and microfluidics.

Sankaraleengam Alagapan (M’13) received BE in Electrical and Electronics Engineering from Anna University, Chennai, India in 2007 and MS in Biomedical Engineering from University of Florida, Gainesville, FL, USA in 2008. He is currently pursuing PhD in Biomedical Engineering at University of Florida, Gainesville.
His research interest includes biological signal processing, information processing and connectivity in engineered in vitro neuronal networks.

Eric Franca was born in Tampa, FL in 1986. In 2008, he received a BSE with honors in Biomedical Engineering from Tulane University with a focus in three-dimensional hydrogel scaffolds for neural tissue guidance. He is currently pursuing his Ph.D. in Biomedical Engineering at the University of Florida. His current research focuses on how the topography of carbon nanomaterials affects the adhesion strength, outgrowth and electrophysiology of neural networks.

Thomas DeMarse received his Masters (1992) and PhD (1997) in Learning and Memory at Purdue University. From 1997 to 1999 he worked as a postdoctoral researcher in the Behavioral/Cognitive Systems Group at Arizona State University. From 1999 to 2003 he worked as research fellow in the Department of Biology at the California Institute of Technology and the Biomedical Engineering Department at Georgia Tech. He is currently a Research Scientist in Neural Engineering area within the Department of Biomedical Engineering at the University of Florida. His primary research interests employ in vitro multichannel microelectrode array technology (MEA) to study neural computation, neural interface technology including noninvasive brain stimulation, and plasticity, learning and memory in living neural systems with application to neural disorders such as epilepsy and stroke.

Greg J. Brewer is newly appointed to the Department of Biomedical Engineering at the University of California Irvine and the Institute for Memory Impairments and Neurodegenerative Disorders (MIND). He also holds the Kenneth Stark Endowed Chair in Alzheimer’s Research and is Professor of Neurology and Medical Microbiology, Immunology and Cell Biology at Southern Illinois University School of Medicine where he has been for 32 years. He received the B.S. degree from Caltech and the Ph.D. in Biology from the University of California San Diego.
Prof. Brewer’s research interests lie in the application of engineering and biochemical principles to live neural networks. He also has projects on the neuroscience of aging and is founder and President of BrainBits LLC, which supplies live brain tissue to neuroscientists.

Bruce C. Wheeler (M’74-SM’?-F-’08) received SB degrees in Physical Science and History from MIT (1971), and the MS and PhD in Electrical Engineering from Cornell University (1977, 1981). He is currently Professor of Biomedical Engineering, J. Crayton Pruitt Family Department of Biomedical Engineering, University of Florida.
He moved to the University of Florida in 2008 after 28 years at the University of Illinois, mostly in the ECE Dept. He founded the Bioengineering Department at Illinois and served as Acting Department Chair at both Illinois and Florida. Previously he served as Illinois Chair of Neuroscience and Associate Head of Electrical and Computer Engineering, including being Chief Academic Advisor to 1600 undergraduate students. He has had an active teaching career with many BS, MS, PhD and postdoctoral students.
He currently serves as President of the IEEE Engineering in Medicine and Biology Society, the world’s largest bioengineering society. He has served as Editor in Chief of the IEEE Transactions on Biomedical Engineering. He is a Fellow of the IEEE, AIMBE and BMES.
Prof. Wheeler’s research interests lie in the application of electrical engineering methodologies to neuroscience. His work influenced the development of neural spike sorting technologies, demonstrated that microelectrode array recording from brain slices was possible and productive, and has been a leader in the development of lithography to control cells, especially neurons, in culture. This work aims at basic science understanding of the behavior of small populations of neurons, in hopes of creating better insight into the functioning of the brain.
REFERENCES
- 1.Potter SM. Distributed processing in cultured neuronal networks. Progress in Brain Research. 2001;130:49–62. doi: 10.1016/s0079-6123(01)30005-5. [DOI] [PubMed] [Google Scholar]
- 2.Nam Y, Chang JC, Khatami D, Brewer GJ, Wheeler BC. Patterning to enhance activity of cultured neuronal networks. IEE Proc. Nanobiotechnology. 2004 Jun;151(3):109–115. doi: 10.1049/ip-nbt:20040706. [DOI] [PubMed] [Google Scholar]
- 3.Nam Y, Wheeler BC. In vitro microelectrode array technology and neural recordings. Critical Reviews in Biomedical Engineering. 2011;39(1):45–62. doi: 10.1615/critrevbiomedeng.v39.i1.40. [DOI] [PubMed] [Google Scholar]
- 4.Clark J, Plonsey R. The extracellular potential field of the single active nerve fiber in a volume conductor. Biophysical J. 1968 Jul;8:842–864. doi: 10.1016/S0006-3495(68)86524-5. [DOI] [PMC free article] [PubMed] [Google Scholar]
- 5.Campenot RB. Local control of neurite development by nerve growth-factor. Proc. Natl Acad. Sci. USA. 1977 Oct;4:4516–4519. doi: 10.1073/pnas.74.10.4516. [DOI] [PMC free article] [PubMed] [Google Scholar]
- 6.Taylor AM, Blurton-Jones M, Rhee SW, CribbsH DH, Cotman CW, Jeon NL. A microfluidic culture platform for CNS axonal injury, regeneration and transport. Nat. Methods. 2005 Aug;2:599–605. doi: 10.1038/nmeth777. [DOI] [PMC free article] [PubMed] [Google Scholar]
- 7.Taylor AM, Berchtold NC, Perreau VM, Tu CH, Jeon NL, Cotman CW. Axonal mRNA in uninjured and regenerating cortical mammalian axons. J. Neurosci. 2009 Apr;29:4697–4707. doi: 10.1523/JNEUROSCI.6130-08.2009. [DOI] [PMC free article] [PubMed] [Google Scholar]
- 8.Dworak BJ, Wheeler BC. Novel MEA platform with PDMS microtunnels enables the detection of action potential propagation from isolated axons in culture. Lab Chip. 2009 Feb;9:404–410. doi: 10.1039/b806689b. [DOI] [PMC free article] [PubMed] [Google Scholar]
- 9.Park J, Koito H, Li JR, Han A. Microfluidic compartmentalized co-culture platform for CNS axon myelination research Biomed. Microdevices. 2009 Dec;11:1145–1153. doi: 10.1007/s10544-009-9331-7. [DOI] [PMC free article] [PubMed] [Google Scholar]
- 10.Yang Y, Gozen O, Watkins A, Lorenzini I, Lepore A, Gao Y, Vidensky S, Brennan J, Poulsen D, Park JW, Jeon NL, Robinson MB, Rothstein JD. Presynaptic regulation of astroglial excitatory neurotransmitter transporter GLT1. Neuron. 2009 Mar;61(6):880–894. doi: 10.1016/j.neuron.2009.02.010. [DOI] [PMC free article] [PubMed] [Google Scholar]
- 11.Berdichevsky Y, Staley KJ, Yarmush ML. Building and manipulating neural pathways with microfluidics. Lab Chip. 2010 Apr;10:999–1004. doi: 10.1039/b922365g. [DOI] [PMC free article] [PubMed] [Google Scholar]
- 12.Shi P, Nedelec S, Wichterle H, Kam LC. Combined microfluidics/protein patterning platform for pharmacological interrogation of axon pathfinding. Lab Chip. 2010 Apr;10:1005–1010. doi: 10.1039/b922143c. [DOI] [PMC free article] [PubMed] [Google Scholar]
- 13.Pan L, Alagapan S, Franca E, Brewer GJ, Wheeler BC. Propagation of action potential activity in a predefined microtunnel neural network. J. Neural Eng. 2011 Aug;8:046031. doi: 10.1088/1741-2560/8/4/046031. [DOI] [PMC free article] [PubMed] [Google Scholar]
- 14.Morales R, Riss M, Wang L, Gavin R, Rio JAD, Alcubilla R, Claverol-Tinture E. Integrating multi-unit electrophysiology and plastic culture dishes for network neuroscience. Lab Chip. 2008 Nov;8:1896–1905. doi: 10.1039/b802165a. [DOI] [PubMed] [Google Scholar]
- 15.Wang L, Riss M, Buitrago JO, Claverol-Tinture E. Biophysics of microchannel-enabled neuron-electrode interfaces. J. Neural Eng. 2012 Apr;9:026010. doi: 10.1088/1741-2560/9/2/026010. [DOI] [PubMed] [Google Scholar]
- 16.Yu Z, Xiang G, Pan L, Huang L, Yu Z, Xing W, Cheng J. Negative dielectrophoretic force assisted construction of ordered neuronal networks on cell positioning bioelectronic chips. Biomed. Microdevices. 2004 Dec;6(4):311–324. doi: 10.1023/B:BMMD.0000048563.58129.76. [DOI] [PubMed] [Google Scholar]
- 17.Clark JW, Plonsey R. A mathematical study of nerve fiber interaction. Biophys. J. 1970 Oct;10:937–957. doi: 10.1016/S0006-3495(70)86344-5. [DOI] [PMC free article] [PubMed] [Google Scholar]
- 18.Merill EG, Wall PD, Yaksh TL. Properties of two unmyelinated fibre tracts of the central nervous system: lateral Lissauer tract and parallel fibres of the cerebellum. J. Phyisol. (Lond.) 1978 Nov;284:127–145. doi: 10.1113/jphysiol.1978.sp012531. [DOI] [PMC free article] [PubMed] [Google Scholar]
- 19.Kocsis JD, Malenka RC, Waxman SG. Effects of extracellular potassium concentration on the excitability of the parallel fibers of the rat cerebellum. J. Physiol. (Lond.) 1983 Jan;334:225–244. doi: 10.1113/jphysiol.1983.sp014491. [DOI] [PMC free article] [PubMed] [Google Scholar]
- 20.Schmied A, Fetz EE. Activity-related changes in electrical thresholds of pyramidal tract axons in the behaving monkey. Exp. Brain Res. 1987;65(2):352–360. doi: 10.1007/BF00236308. [DOI] [PubMed] [Google Scholar]