

Abstract
Micropapillary carcinoma (MPC) is a rare histological special type of breast cancer, characterized by an aggressive clinical behaviour and a pattern of copy number aberrations (CNAs) distinct from that of grade- and oestrogen receptor (ER)-matched invasive carcinomas of no special type (IC-NSTs). The aims of this study were to determine whether MPCs are underpinned by a recurrent fusion gene(s) or mutations in 273 genes recurrently mutated in breast cancer. Sixteen MPCs were subjected to microarray-based comparative genomic hybridization (aCGH) analysis and Sequenom OncoCarta mutation analysis. Eight and five MPCs were subjected to targeted capture and RNA sequencing, respectively. aCGH analysis confirmed our previous observations about the repertoire of CNAs of MPCs. Sequencing analysis revealed a spectrum of mutations similar to those of luminal B IC-NSTs, and recurrent mutations affecting mitogen-activated protein kinase family genes and NBPF10. RNA-sequencing analysis identified 17 high-confidence fusion genes, eight of which were validated and two of which were in-frame. No recurrent fusions were identified in an independent series of MPCs and IC-NSTs. Forced expression of in-frame fusion genes (SLC2A1–FAF1 and BCAS4–AURKA) resulted in increased viability of breast cancer cells. In addition, genomic disruption of CDK12 caused by out-of-frame rearrangements was found in one MPC and in 13% of HER2-positive breast cancers, identified through a re-analysis of publicly available massively parallel sequencing data. In vitro analyses revealed that CDK12 gene disruption results in sensitivity to PARP inhibition, and forced expression of wild-type CDK12 in a CDK12-null cell line model resulted in relative resistance to PARP inhibition. Our findings demonstrate that MPCs are neither defined by highly recurrent mutations in the 273 genes tested, nor underpinned by a recurrent fusion gene. Although seemingly private genetic events, some of the fusion transcripts found in MPCs may play a role in maintenance of a malignant phenotype and potentially offer therapeutic opportunities.
Keywords: breast cancer, micropapillary, RNA sequencing, fusion transcripts, somatic mutation profiling, CDK12, PARP inhibitors
Introduction
Micropapillary carcinomas (MPCs) are a histological special type of breast cancer accounting for up to 7% of all invasive breast carcinomas 1. These tumours display a unique growth pattern featuring clusters of tumour cells displaying inverted polarity immersed in a spongy stroma, and often display extensive vascular invasion 1. Microarray-based comparative genomic hybridization (aCGH) analysis carried out by our group has revealed that pure and mixed MPCs are remarkably similar at the genetic level 2 and harbour a constellation of genetic aberrations that is distinct from that of grade- and oestrogen receptor (ER)-matched invasive carcinomas of no special type (IC-NSTs, also known as invasive ductal carcinomas of no special type) 2,3. Our genomic analysis, however, did not identify any specific genomic aberration that may explain the distinctive morphology and clinical behaviour of MPCs.
Some histological special types of breast cancer have been shown to be underpinned by highly recurrent fusion genes or somatic mutations (reviewed in refs 4 and 5). For instance, adenoid cystic carcinomas and secretory carcinomas of the breast have been shown to be characterized by recurrent specific chromosomal translocations that lead to the formation of the recurrent fusion genes MYB–NFIB 6 and ETV6–NTRK3 7, respectively, while lobular carcinomas are underpinned by E-cadherin loss of function 4,8,9.
Massively parallel sequencing studies are providing a comprehensive characterization of the repertoire of mutations and fusion genes in different types of cancer 10–16. In breast cancer, RNA-sequencing studies have identified a panoply of expressed fusion genes 12–14,17, although the majority of these appear to exist at very low prevalence or represent private events (ie identified only in the index case) 12,17,18. It is currently believed that most of these fusion genes may be mere passenger events 12,19. Recently, however, RNA sequencing has identified two classes of recurrent gene rearrangements in IC-NSTs, involving genes encoding microtubule-associated serine-threonine kinase (MAST) and members of the Notch family 17. Furthermore, the presence of a chromosomal rearrangement resulting in the formation of a potentially functionally relevant MAGI3–AKT3 chimeric protein has been described in a subset of breast cancers 15.
Given the previous identification of pathognomonic fusion genes and somatic mutations in histological special types of breast cancer and the recent identification of recurrent expressed fusion genes in breast cancer, the aims of this study were to determine (i) if MPCs harbour recurrent mutations affecting 273 genes, either recurrently mutated in breast cancer or DNA repair-related, or (ii) if MPCs are underpinned by highly-recurrent expressed fusion genes. Furthermore, we sought to determine the biological significance of selected fusion genes identified in MPCs in vitro.
Materials and methods
Tumour samples
The study design is illustrated in Supplementary Figure 1 and power calculations are described in the Supplementary methods. In brief, two cohorts of MPCs were analysed: 16 formalin-fixed, paraffin-embedded (FFPE) MPCs (Table1), five of which had matched frozen material, and 14 additional FFPE MPCs, employed as a validation cohort. In addition, control groups of 16 IC-NSTs and 14 IC-NSTs grade- and ER-matched to the two series of MPCs were employed. Finally, an additional 48 grade 3 IC-NSTs were retrieved from the authors' institutions and surveyed for the presence of specific fusion transcripts (Supplementary methods and Supplementary Table 1). This study was approved by the authors' local research ethics committees.
Figure 1.

Microarray-based comparative genomic hybridization frequency plots and RNA-sequencing circos plots of micropapillary carcinomas of the breast. (A) Frequency plot of copy number gains and losses in 16 micropapillary carcinomas of the breast. The proportion of tumours in which each bacterial artificial chromosome (BAC) clone is gained (green bars) or lost (red bars) is plotted (y-axis) for each BAC clone according to its genomic position (x-axis). (B) Frequency plot of amplifications in 16 micropapillary carcinomas of the breast. The proportion of tumours in which each BAC clone is amplified (green bars) is plotted (y-axis) for each BAC clone according to its genomic position (x-axis). The red dashed line indicates the threshold for recurrent events. (C) High-confidence validated expressed fusion genes are plotted in purple and high-confidence non-validated fusions in grey, linking the genomic locus of each partner of the fusion genes. Genome plots, based on the 32K aCGH data, are plotted in the inner circle (green, copy number gains; red, copy number losses; black, no copy number changes). MPC, micropapillary carcinoma of the breast.
Table 1.
Main cohort of 16 microdissected MPCs subjected to microarray-based comparative genomic hybridization and Sequenom MassARRAY OncoCarta analysis. Five of the cases were subjected to RNA massively parallel sequencing due to the availability of a frozen specimen
| Sample | Pure/mixed | Specimen type | Grade | ER | PR | HER2 | RNA-seq | Mutation* |
|---|---|---|---|---|---|---|---|---|
| MPC10 | Pure | Frozen | 3 | Positive | Positive | Negative | Y | None |
| MPC08 | Pure | Frozen | 2 | Positive | Positive | Negative | Y | None |
| MPC70 | Pure | Frozen | 2 | Positive | Positive | Negative | Y | None |
| MPC72 | Pure | Frozen | 3 | Positive | Negative | Negative | Y | None |
| MPC71 | Pure | Frozen | 3 | Positive | Positive | Positive | Y | None |
| MPC37 | Mixed | Frozen | 3 | Positive | Positive | Negative | NP | None |
| MPC06 | Pure | FFPE | 2 | Positive | Positive | Negative | NP | None |
| MPC11 | Pure | FFPE | 2 | Positive | Positive | Negative | NP | None |
| MPC02 | Pure | FFPE | 2 | Positive | Positive | Negative | NP | None |
| MPC04 | Pure | FFPE | 3 | Positive | Negative | Negative | NP | None |
| MPC01 | Pure | FFPE | 2 | Positive | Positive | Negative | NP | None |
| MPC23 | Pure | FFPE | 3 | Positive | Negative | Negative | NP | None |
| MPC25 | Mixed | FFPE | 2 | Positive | Positive | Negative | NP | PIK3CA H1047R |
| MPC45 | Mixed | FFPE | 3 | Positive | Positive | Positive | NP | None |
| MPC38 | Mixed | FFPE | 3 | Positive | Positive | Negative | NP | None |
| MPC53 | Mixed | FFPE | 3 | Negative | Negative | Positive | NP | None |
ER, oestrogen receptor; FFPE, formalin-fixed, paraffin-embedded; NP, not performed; PR, progesterone receptor; RNA-seq, paired-end massively parallel mRNA sequencing; Y, yes.
Mutations in the hotspot regions of 19 genes assessed by the Sequenom OncoCarta v1.0.
Immunohistochemistry
Representative sections of each case were subjected to immunohistochemical assessment using antibodies against epithelial membrane antigen, ER, progesterone receptor (PR), and HER2 as previously described 2,3 and were reviewed by at least two pathologists (CM, AS, and/or JSR-F), using previously defined scoring systems and cut-offs 2,3,20 (Supplementary methods and Supplementary Table 2).
Microdissection, DNA extraction, and RNA extraction
Representative 8-µm-thick sections of the MPCs and IC-NSTs were subjected to microdissection with a sterile needle under a stereomicroscope (Olympus SZ61, Tokyo, Japan) to ensure a percentage of tumour cells greater than 90%, as previously described 3,21. DNA extraction, quantification, and quality control assessment were performed as previously described 3,21 (Supplementary methods). From eight of the 16 MPCs microdissected, adjacent normal breast tissue was successfully microdissected.
Microarray comparative genomic hybridization (aCGH)
Sixteen MPCs and 16 grade-, ER-, and HER2-matched IC-NSTs were subjected to aCGH analysis using a platform that comprised ∼32 000 BAC clones tiled across the genome 22. This platform has been shown to be as robust as, and to have comparable resolution to high-density oligonucleotide arrays 23–25. DNA labelling, array hybridization, image acquisition, and data analysis were performed as previously described 3,22,26,27 (Supplementary methods). Data, the analysis history, script, and code are available at http://rock.icr.ac.uk/collaborations/Mackay/Micropapillary.
Mutation screening and validation
Sixteen MPCs and 16 grade-, ER-, and HER2-matched IC-NSTs were subjected to hotspot mutation screening of 19 known cancer genes using the OncoCarta Panel v 1.0 (Sequenom, San Diego, CA, USA) and validated using Sanger sequencing as previously described 22,27. For eight of these cases, sufficient DNA from tumour and normal breast was available for targeted capture massively parallel sequencing analysis using a bait library targeting 273 genes either recurrently mutated in breast cancer or DNA repair-related genes as previously described 2,28–35 (Supplementary methods and Supplementary Table 3).
Paired-end massively parallel RNA sequencing
Five pure frozen MPCs were subjected to mRNA massively parallel sequencing, which was performed according to the standard Illumina mRNA paired-end library protocol (Illumina Inc, San Diego, CA, USA) as previously described 36. Paired-end sequencing was performed using 2 × 54 bp cycles on the Genome Analyser IIx (Illumina; Supplementary methods). Data were aligned to the genome and transcriptome using Bowtie 37. Mate-pairs supporting novel chimeric transcripts were identified using ChimeraScan version 4.0.3.0 as previously described 17,37. High-confidence chimeric transcripts were nominated subsequent to further filtering to remove multi-mapping reads and to exclude false-positive nominations 37.
Reverse-transcription PCR (RT-PCR), PCR, and Sanger sequencing validation
Nominated fusion genes were validated in five index cases by RT-PCR and Sanger sequencing as previously described 18 (Supplementary methods). Validated in-frame and out-of-frame fusion genes with recurrent partners found in independent datasets 12,15–17 were screened at the cDNA level in an independent cohort of MPCs (n = 14), grade- and ER-matched IC-NSTs (n = 14), and grade 3 IC-NSTs (n = 48) using RT-PCR or quantitative real-time PCR (qRT-PCR; Supplementary methods).
Constructs for functional analyses
The SLC2A1–FAF1 and BCAS4–AURKA fusion open reading frames (ORFs) were PCR-amplified from the index tumour (MPC10) and cloned into a mammalian expression vector pCMVentry, with a C-terminal DDK tag (OriGene, Rockville, MD, USA). Full-length expression constructs of FAF1, AURKA, and RAE1 with DDK tags were obtained from OriGene. Expression of the fusion and wild-type protein constructs was detected with the anti-DDK monoclonal antibody 4C5 (Origene) by western blotting of 20 µg of whole cell protein lysate as previously described 38. Sequences of the ORFs are available at http://rock.icr.ac.uk/collaborations/Mackay/Micropapillary.
Cell line models
The ER-positive breast cancer cell lines, MCF7, BT474, T47D, and ZR75.1, whose phenotypic characteristics and patterns of copy number aberrations are consistent with those of the MPCs (Supplementary Table 4), and 12 HER2-amplified cell lines (JIMT1, UACC812, UACC893, VP229, SKBR3, ZR75.30, HCC1569, HCC1954, MDA-MB-453, MDA-MB-361, SUM225, and SUM190) were included in this study. The sources, growth conditions, and authentication methods are described in the Supplementary methods.
Functional assessment of in-frame fusion genes
Cloned SLC2A1-FAF1 and BCAS4-AURKA fusions, full-length 3′ partner gene constructs or empty vectors were transfected into four ER-positive breast cancer cell lines (MCF7, BT474, T47D, and ZR75.1) using Lipofectamine 2000 (Invitrogen, Carlsbad, CA, USA). Antibiotic selection was performed as previously described 38, and cell populations were assessed every 24 h, for 9 days, using the CellTiter-Glo® cell viability assay (Promega, Madison, WI, USA) 38, with each reading normalized to day 1 to determine the fold change (Supplementary methods).
Functional assessment of out-of-frame fusion genes
Short-interfering RNA (siRNA) silencing of CDK12 was performed as previously described 38,39. Briefly, MCF7, T47D, and SUM149 breast cancer cells were transfected with siGENOME SMARTpools (each containing four distinct siRNAs targeting each gene), a non-targeting negative control siRNA (siCON), and a positive control siRNA targeting PLK1 (siCDK12: M-004031-03; siControl: D-001206-14; siPLK1: M-003290-01; Fermentas, Germany). Transfection mixes contained 50 nm siRNA in a final volume of 100 µl, together with Lipofectamine RNAiMAX reagent (Invitrogen). CDK12 silencing was confirmed at the protein level by western blotting using an anti-CDK12 antibody (ab37914; Abcam, Cambridge, MA, USA).
Long-term survival assay
Long-term 14-day survival assays were performed using six-well plates in triplicate as previously described 38,39. The sulforhodamine B (SRB) (Sigma) assay was employed as readout as described previously 38,39 (Supplementary methods). The PARP inhibitor BMN673 was a kind gift from BioMarin Pharmaceuticals (San Rafael, CA, USA), and olaparib (AZD2281/KU0058948) was obtained from SelleckBio (Munich, Germany).
Analysis of RAD51 foci formation
Nuclear RAD51 and phospho-γ-H2AX foci were visualized and quantified as previously described 38,39 and used as surrogate markers for induction of DNA double-strand breaks (DSBs) and competent homologous recombination (HR) DNA repair, respectively (Supplementary methods).
Statistical analyses
The statistical analysis methods employed are described in the Supplementary methods.
Results
The landscape of gene copy number aberrations and somatic mutations in MPCs
Genome-wide aCGH profiling of 16 MPCs revealed extensive changes in the genome, ranging from 10.4% to 54.3% of BACs showing either gains or losses (mean: 28.5%; median: 28.9%). Consistent with the results of our previous studies 2,3,40, the most frequent recurrent changes included gains of 1q, 8q, 17q, and 20q, and losses of 1p 8p, 13q, 16q, and 22q (Figure 1 and Supplementary Table 5). The majority of MPCs (10/16 cases; 62.5%) showed high-level gain of the whole arm of chromosome 8q, regardless of histological grade, as previously reported 3. Recurrent (n > 1) focal (< 2 Mb) amplifications containing known genes were identified on chromosomes 1p34.3–p34.2, 8p12–p11.21, 17q11.1–q21.2, and 20q13.13–q13.2 (Supplementary Table 5).
To determine whether MPCs would be underpinned by a pathognomonic somatic mutation, eight samples were subjected to targeted massively parallel sequencing comprising 273 genes, and 16 samples were subjected to Sequenom mutation profiling using the OncoCarta panel 22,27. We identified recurrent mutations affecting genes of the mitogen-activated protein kinase family (MAP3K1 in three cases, and MAP2K6 and MAP3K4 in one case each) and recurrent splice-site mutations of NBPF10 (n = 2) (Table2). A significant enrichment in genes mutated in luminal B breast cancers was observed in the constellation of mutations found in MPCs; out of the 119 genes most frequently mutated (ie ≥ 4 cases – 3.5%) in luminal B IC-NSTs from The Cancer Genome Atlas (TCGA) study 16, TP53 (W53*), PIK3CA (H1047R), CSMD2 (R3608S), MAP3K1 (insertions and deletions in three cases), ATRX (P667T), HMCN1 (A537G), MLL2 (A946E), SPEN (ESS2280A), and ZFHX4 (A2896S) were mutated in MPC samples (representation factor = 2.3; hypergeometric test p value < 0.01; Table2). Sequenom analysis confirmed the results of the massively parallel sequencing analysis; of the hotspot mutations included in the OncoCarta panel, the PIK3CA H1047R mutation was identified in the MPC reported to have this mutation by massively parallel sequencing (MPC25). This mutation was also validated by Sanger sequencing (Supplementary Figure 2). In addition, MAP3K1, MAP3K4, PIK3CA, NBPF10, CECR2, and CSMD2, which were mutated in the MPCs analysed here, were also shown to be mutated in at least one of the four cases of pure and mixed MPC included in the TCGA study (http://www.cbioportal.org/public-portal/study.do?cancer_study_id=brca_tcga_pub, assessed on 3 December 2013). Taken together, our results suggest that MPCs are not driven by a pathognomonic mutation affecting any of the 273 genes included in our targeted capture massively parallel sequencing panel, and that genes mutated in luminal B IC-NSTs are also mutated in MPCs.
Table 2.
Somatic mutations identified by massively parallel sequencing in eight micropapillary carcinomas of the breast
| Gene | Mutation | Mutation type | MAF | Depth | Tumour sample |
|---|---|---|---|---|---|
| AGFG2 | A443T | Non-synonymous coding | 35.70% | 366 | MPC02T |
| AKT1 | E17K | Non-synonymous coding | 31.70% | 253 | MPC06T |
| APC | R2714L | Non-synonymous coding | 4.80% | 156 | MPC25T |
| ATRX | P667T | Non-synonymous coding | 9.43% | 156 | MPC37T |
| CDC25B | R137W | Non-synonymous coding | 18.49% | 799 | MPC53T |
| CHD4 | N789I | Non-synonymous coding | 6.90% | 284 | MPC06T |
| CSMD2 | R3608S | Non-synonymous coding | 5.81% | 149 | MPC25T |
| CUBN | N3576K | Non-synonymous coding | 7.46% | 204 | MPC37T |
| DCHS2 | R434S | Non-synonymous coding | 10.42% | 147 | MPC37T |
| DOCK11 | H833D | Non-synonymous coding | 30.80% | 132 | MPC08T |
| DST | P5601Q | Non-synonymous coding | 7.81% | 130 | MPC10T |
| FBN1 | P83S | Non-synonymous coding | 16.00% | 273 | MPC53T |
| FOXA1 | Y259D | Non-synonymous coding | 23.80% | 179 | MPC06T |
| FOXA1 | P248S | Non-synonymous coding | 10.30% | 246 | MPC06T |
| GPR98 | L3724F | Non-synonymous coding | 23.74% | 330 | MPC53T |
| HMCN1 | A537G | Non-synonymous coding | 13.60% | 76 | MPC10T |
| MAP1A | S604* | Stop gained | 38.70% | 47 | MPC10T |
| MAP2K6 | S35P | Non-synonymous coding | 18.40% | 273 | MPC53T |
| MAP3K4 | G743R | Non-synonymous coding | 29.90% | 459 | MPC53T |
| MLL2 | A946E | Non-synonymous coding | 6.10% | 207 | MPC08T |
| MST1L | W378G | Non-synonymous coding | 23.28% | 354 | MPC25T |
| PIK3CA | H1047R | Non-synonymous coding | 64.80% | 111 | MPC25T |
| RBBP8 | R805L | Non-synonymous coding | 4.40% | 216 | MPC08T |
| NBPF10 | – | Splice site donor | 37.50% | 43 | MPC02T |
| NBPF10 | – | Splice site donor | 28.10% | 50 | MPC25T |
| SHROOM4 | P769S | Non-synonymous coding | 21.05% | 398 | MPC53T |
| SRCAP | V2835M | Non-synonymous coding | 20.59% | 137 | MPC37T |
| TP53 | W53* | Stop gained | 55.30% | 647 | MPC53T |
| ZFHX4 | A2896S | Non-synonymous coding | 6.20% | 237 | MPC08T |
| MAP3K1 | R271fs | Indel – frameshift – exon | 31.58% | 312 | MPC02T |
| MAP3K1 | K1037fs | Indel – frameshift | 40.00% | 168 | MPC02T |
| L1491LQP | Indel – codon insertion | 32.14% | 263 | MPC06T | |
| ATN1 | Q488QQ | Indel – codon insertion | 26.67% | 88 | MPC10T |
| SPEN | ESS2280A | Indel – codon change and deletion | 34.62% | 91 | MPC11T |
| MAP3K1 | T918fs | Indel – frameshift | 26.21% | 183 | MPC25T |
| MAP3K1 | F884fs | Indel – frameshift | 37.50% | 147 | MPC25T |
MAF, mutant allelic frequency; –, splice site.
Identification of expressed fusion transcripts in MPCs
RNA sequencing of five frozen MPCs resulted in a total amount of sequencing per sample of 1.33–1.92 Gb per lane, median 1.37 Gb per lane (Supplementary Table 6). Fusion transcript detection using ChimeraScan 37 identified 18 high-confidence chimeric transcripts in four MPCs (MPC10, MPC08, MPC71, and MPC72; Figure 1 and Table3). In MPCs harbouring expressed fusion genes, the number of nominated high-confidence chimeras ranged from 11 in MPC10 to one in MPC72. MPC70 had no nominated high-confidence chimeric transcripts; no differences in the total number of aligned reads were found between cases that expressed fusion genes and those that did not (data not shown). Nominated chimeric transcripts were subsequently validated in each index case by RT-PCR and Sanger sequencing (Figure 2), of which eight of the 17 fusions were validated (Table3). qRT-PCR was used to confirm expression of in-frame fusion genes (Supplementary Figure 3). One or both of the partner genes involved in seven of the eight fusion genes were amplified as defined by aCGH analysis (Figure 1 and Table3). Of the eight validated fusions, two were predicted to be in-frame (SLC2A1–FAF1 and BCAS4–AURKA) and were both present in a single tumour (ie MPC10; Figure 2 and Supplementary Figure 3). Both of these fusions were found to map to breakpoints of amplification (Table3).
Table 3.
Identification of expressed chimeric transcripts in five micropapillary breast carcinomas
| Sample ID | Gene 5′ | Gene 3′ | Mapping 5′ | Mapping 3′ | Total reads | Spanning reads | In frame | Validated | Copy number 5′ | Copy number 3′ |
|---|---|---|---|---|---|---|---|---|---|---|
| MPC10 | ELMO2 | RAE1 | chr20:45014762 | chr20:55943760 | 25 | 14 | No | Y | Gain | Amp |
| MPC10 | BCAS4 | AURKA | chr20:49411466 | chr20:54944444 | 24 | 1 | Yes | Y | Gain | Amp |
| MPC10 | SLC2A1 | FAF1 | chr1:43424304 | chr1:50906934 | 12 | 5 | Yes | Y | Amp | Gain |
| MPC10 | TSEN54 | UNC84A | chr17:73512608 | chr7:934970 | 7 | 0 | No | N | Gain | Gain |
| MPC10 | CD46 | USH2A | chr1:207925401 | chr1:215796235 | 6 | 1 | No | Y | Amp | Gain |
| MPC71 | LASP1 | CDK12 | chr17:37026111 | chr17:37646809 | 5 | 4 | No | Y | Amp | Amp |
| MPC10 | DENND1C | SURF1 | chr19:6470305 | chr9:136218665 | 4 | 0 | Yes | N | No change | No change |
| MPC10 | UBE2V1 | SULF2 | chr20:48713208 | chr20:46286150 | 4 | 1 | No | Y | Amp | Amp |
| MPC08 | BC018860 | CDK5RAP3 | chr1:566461 | chr17:46052524 | 3 | 1 | No | N | No change | No change |
| MPC10 | LRRC6 | HPRG1 | chr8:133584447 | chr8:133572744 | 3 | 0 | No | N | Amp | Amp |
| MPC08 | PDLIM5 | TCEB1 | chr4:95373037 | chr8:74858633 | 3 | 3 | No | N | No change | Amp |
| MPC08 | TSPAN14 | DYDC2 | chr10:82214037 | chr10:82126443 | 3 | 1 | No | N | Amp | No change |
| MPC10 | IFI44L | IFI44 | chr1:79086087 | chr1:79115476 | 2 | 0 | No | N | Loss | Loss |
| MPC10 | MRPL21 | BX640963 | chr11:68660870 | chr2:69686413 | 2 | 0 | No | N | No change | No change |
| MPC10 | SYNGAP1 | RALY | chr6:33387846 | chr20:32664833 | 2 | 0 | No | N | Gain | Gain |
| MPC72 | MUC1 | C1orf86 | chr1:155161501 | chr1:2115916 | 2 | 0 | No | N | Gain | Loss |
| MPC71 | CYB5B | CALB2 | chr16:69458497 | chr16:71416621 | 2 | 2 | No | Y | No change | No change |
| MPC71 | NSF | C17orf57 | chr17:44668037 | chr17:45438743 | 2 | 2 | No | Y | Amp | No change |
5′, 5′ partner gene; 3′, 3′ partner gene; total reads, total number of reads supporting the nominated fusion; spanning reads, number of reads spanning the fusion junction.
Copy number derived from smoothed cbs ratios of aCGH data; loss, copy number loss; no change, no copy number change; gain, copy number gain, amp, amplification.
Figure 2.
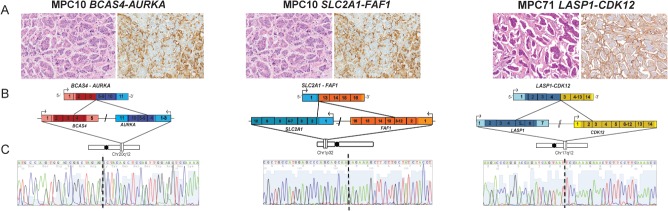
Structure of validated high-confidence fusion genes in micropapillary carcinomas. Sanger sequencing validation of functionally assessed fusion genes in the index cases of micropapillary carcinomas (MPCs) (BCAS4–AURKA and SLC2A1–FAF1 in MPC10 and LASP1-CDK12 in MPC71). (A) Haematoxylin and eosin (H&E) and epithelial membrane antigen (EMA) staining of representative areas of the MPCs harbouring the BCAS4–AURKA, SLC2A1–FAF1, and LASP1–CDK12 fusion genes (10× original magnification). (B) Schematic representation of nominated fusion transcripts. Fusion junctions with respective exon numbers are shown, while paler colours indicate 3′ and 5′ UTRs. (C) cDNA level sequence chromatograms spanning the junction (dotted line) of the fusion transcript.
RT-PCR analysis of a series of 14 independent MPCs and 62 IC-NSTs (Supplementary Table 1 and Supplementary Figure 4) revealed no additional case harbouring these fusion transcripts. Of interest, however, both SLC2A1–FAF1 and BCAS4–AURKA fusion genes were found to be present in the lymph-node metastasis of the index case MPC10 (Supplementary Figure 3). We next sought to determine whether one or both partner genes of all validated chimeric transcripts would be involved in fusion genes in other breast cancers. Publicly available next-generation sequencing breast cancer datasets (n = 185) 12,15–17,41–43 were interrogated and revealed that BCAS4 is the 5′ partner gene in the validated fusion BCAS4–BCAS3 in MCF7 cells 13,17 and that FAF1 is involved in a DNA rearrangement in an ER-negative/HER2-negative primary breast cancer. None of the other genes of these in-frame fusions were found to be involved in previously reported fusion genes in breast cancers. Of the out-of-frame validated chimeras, we identified recurrent expressed chimeric transcripts involving CDK12 (2.7%) and RAE1 (1%), and DNA rearrangements involving C17ORF57 (0.5%), NSF (0.5%), USH2A (0.5%), and LASP1 (1%) from unselected breast cancers in external datasets 12,15–17,41–43 (Supplementary Table 7).
Assessment of the biological relevance of selected fusion genes identified in MPCs
Given that SLC2A1–FAF1 and BCAS4–AURKA fusion genes were present in both the primary tumour and lymph node metastasis of MPC10, we hypothesized that, albeit restricted to a single case, these fusion genes could constitute driver events. Therefore, the chimeric transcript and each partner gene were transiently expressed in four ER-positive/HER2-negative breast cancer cell lines, including MCF7, which is reported to recapitulate many of the phenotypic characteristics of MPCs 44. Forced expression of SLC2A1–FAF1 caused a significant increase in cell proliferation compared with the empty vector control (as measured by fold change in cell viability on day 9 in each cell line; Figure 3A) in two out of four cancer cell lines (ie MCF7 and BT474, p < 0.05, one-way ANOVA). Forced expression of full-length FAF1 had a similar effect only in MCF7 and BT474 cells (Figure 3A). BCAS4–AURKA forced expression caused a significant increase in cell proliferation, compared with the empty vector, in one cell line (MCF7, p < 0.05, one-way ANOVA). Again, forced expression of the 3′ partner, AURKA, recapitulated these results only in MCF7 (Figure 3B). These data suggest that some private, or low-frequency, fusion genes may provide a selective advantage, which may also be dependent on the phenotype and genetic make-up of the cell harbouring them (Figure 3C).
Figure 3.

Functional assessment of in-frame expressed fusion genes. To determine the biological significance of the in-frame fusion genes identified in MPCs, forced expression of each fusion gene (SLC2A1–FAF1, A and BCAS4–AURKA, B), the 3′ partner gene, and an empty vector was performed in a panel of breast cancer cell lines. The fold change in cell population (y-axis) is plotted against growth time (days, x-axis). Red, solid black, and dashed black lines denote growth curves following transfection with fusion gene constructs (ie SLC2A1–FAF1 or BCAS4–AURKA), full-length 3′ partner genes (ie FAF1 or AURKA), and empty vector (pCMV), respectively. Western blotting using anti-DDK antibody was employed to confirm exogenous expression of cDNA constructs following transfection in MCF7 cells (A and B). In A and B, statistically significant differences are highlighted with an asterisk. (C) A matrix illustrating the pathological phenotype and aberrations affecting endogenous fusion gene partners in the cell lines employed, where dark blue squares represent positivity in a marker, light blue squares represent negativity in a marker, green squares denote amplification of a gene, and red denotes rearrangement of a gene.
Out-of-frame fusion genes may provide a selective advantage to cancer cells harbouring them by disrupting the expression of genes with tumour suppressor roles 45,46. Given that CDK12 maps to the smallest region of amplification of the HER2 amplicon, and recurrent fusions were identified in 13% (6/47) HER2-amplified tumours (Supplementary Table 7), we hypothesized that disruptions involving CDK12 were due to a copy number breakpoint within the amplicon. By mining aCGH and matched gene expression data from HER2-amplified cells lines 47, we identified 7/14 HER2-amplified cells where a breakpoint within the HER2 amplicon mapped to CDK12 (Supplementary Table 4). A significant reduction in CDK12 mRNA expression was observed in these cell lines relative to HER2-amplified breast cancer cell lines that did not harbour a breakpoint involving CDK12 (Figure 4A; p = 0.0360, t-test). Assessment of CDK12 protein expression in this panel of cells revealed a significantly lower level of protein expression (p = 0.0438, t-test; Figure 4B), with MDA-MB-453 showing no detectable levels of CDK12 protein expression. CDK12 has recently been reported to be involved in the maintenance of genomic stability through regulation of genes involved in the DNA damage response pathway including BRCA1, ATR, FANCI, and FANCD2, and cells devoid of CDK12 have been reported to be sensitive to DNA-damaging agents 48. To determine whether HER2-amplified cells with breakpoints in CDK12 were sensitive to PARP inhibitors, we investigated the sensitivity of HER2-amplified and ER-positive breast cancer cell lines to BMN673 (Figure 4C) and olaparib (Supplementary Figure 5). Although there was no difference in sensitivity comparing the SF50 to cell lines with and without CDK12 disruption (p = 0.207, BMN673 and p = 0.375, olaparib, t-test), MDA-MB-453 cells that are null for CDK12 expression were sensitive to both BMN673 and olaparib. Silencing of CDK12 mediated by siRNA in ER-positive cell lines MCF7 and T47D resulted in increased sensitivity to the PARP inhibitor BMN673 (Figure 4D). Furthermore, the ability to elicit RAD51 foci formation upon treatment with ionizing radiation or the PARP inhibitor BMN673 was diminished upon CDK12 silencing (Figure 4E and Supplementary Figure 6). Reconstitution of wild-type CDK12 in MDA-MB-453 CDK12 null cells rendered cells more resistant to both BMN673 (Figure 4F) and olaparib (Supplementary Figure 5).
Figure 4.

Disruption of CDK12 leads to PARP inhibitor sensitivity. (A) mRNA expression of CDK12 in HER2-amplified cell lines with a breakpoint spanning the CDK12 locus shows significantly lower levels of CDK12 mRNA compared with cells without a breakpoint spanning CDK12. (B) Western blot analysis of endogenous CDK12 in a panel of HER2-amplified cell lines relative to β-actin loading control. BT474 (blue) was employed as a loading control for normalization of the results of the western blot. Note that MDA-MB-453 shows no CDK12 expression (red), and relative quantification of CDK12 protein expression relative to β-actin, showing a significantly lower level of expression in cell lines with a breakpoint spanning CDK12 than those without (p = 0.0438, t-test). (C) Log10 SF50 of HER2-amplified cell lines to the PARP inhibitor BMN673. SUM149 in blue as a positive control, given that this cell line harbours a BRCA1 mutation. (D) CDK12 silencing results in increased sensitivity to BMN673 in T47D and MCF7 ER-positive breast cancer cells. The BRCA1 mutant SUM149 cells displayed no increase in sensitivity upon CDK12 silencing, suggesting that the PARP inhibitor sensitivity caused by silencing of this gene results from impaired homologous recombination DNA repair. Western blot showing expression of CDK12 in T47D, MCF7, and SUM149 cells relative to β-actin loading control. (E) Percentage of cells with RAD51 positive foci normalized to phospho-γ-H2AX foci formation without treatment (Ctrl), 6 h after 10 Gy (IR) of irradiation, and with 1 mm BMN673 for 24 h (PARPi), with (red) and without (grey) CDK12 silencing. (F) Reconstitution of full-length CDK12 (blue) and empty vector (p.CMV) (black) in MDA-MB-453 cells treated with BMN673. Western blot showing expression of CDK12 in MDA-MB-453 cells transfected with full-length CDK12.
Taken together, our results demonstrate that MPCs do not harbour highly-recurrent fusion genes; however, some of the in-frame private fusion genes identified in this study have a biological impact that is likely to be context-dependent and may be part of a convergent phenotype. Loss of CDK12 due to breakpoints in the HER2 amplicon results in sensitivity to PARP inhibitors, suggesting that some out-of-frame fusion genes may represent bona fide loss-of-function genomic events, and potentially targetable somatic genetic aberrations.
Discussion
In this analysis of breast MPCs, not only have we confirmed the patterns of gene copy number aberrations previously reported by our group 2,3 in this special type of breast cancer, but we have also provided direct evidence to rule out two potential mechanisms that result in breast cancers displaying a micropapillary phenotype: (i) pathognomonic mutations in genes recurrently mutated in breast cancer and DNA repair-related genes and (ii) highly-recurrent expressed fusion genes. In fact, our analysis revealed recurrent mutations affecting MAPK genes. In addition, mutations affecting genes often mutated in luminal B IC-NSTs have also been found in individual MPC samples (Table2). This finding confirms our previous observation that MPCs have a constellation of genetic aberrations similar to those of luminal B breast cancers 2,3 and rules out the possibility that the MPC phenotype is driven by pathognomonic mutations affecting any of the 273 recurrently mutated breast cancer and DNA repair-related genes included in the targeted capture sequencing platform employed (Supplementary Table 3) and in the Sequenom OncoCarta panel. Furthermore, paired-end massively parallel RNA-sequencing revealed that although fusion genes are present in a proportion of MPCs, these constitute private genetic events (ie restricted to the index case) and often map to regions of amplification.
Two of the in-frame expressed fusion genes identified in this study, SLC2A1–FAF1 and BCAS4–AURKA, were present both in the primary tumour MPC10 and in the corresponding synchronous lymph-node metastasis (MPC10LND). Although this observation may merely indicate that these fusion genes were present in the modal clonal population of MPCs, it is possible that their maintenance in the metastatic deposit was due to a selective advantage conferred by the expression of the chimeric fusion genes. To test whether these fusion genes would confer a growth/survival advantage, we forced the expression of the chimeric fusion transcripts and each 3′ partner in four ER-positive, HER2-negative breast cancer cell lines. Similar to driver fusion genes identified by RNA sequencing analysis of breast cancer 17, ectopic overexpression of these in-frame fusion genes resulted in increased proliferation of multiple breast cancer cell lines, which was similar to the effect of the ectopic expression of the 3′ partner genes. It should be noted, however, that different ER-positive breast cancer cell lines responded differently to the forced expression of the fusion genes SLC2A1–FAF1 and BCAS4–AURKA, and their wild-type fusion gene partners (Figure 3). The SLC2A1–FAF1 fusion involves a promoter swap of the major glucose transporter SLC2A1 exon 1 fused to exons 13–16 of FAF1. FAF1 (FAS associate factor 1) encodes for a protein that binds to FAS antigen and initiates apoptosis; its down-regulation may contribute to tumourigenesis, through the regulation of apoptosis and NFκB activity, as well as in ubiquitination and proteasomal degradation 49. The fusion gene found in MPC10 contains the ubiquitin association and ubiquitin-like regulatory X domain 49. The BCAS4–AURKA fusion gene results in the preservation of the AURKA kinase domain being driven by the promoter sequences of BCAS4. The loci of BCAS4 and AURKA (ie 20q13) are amplified in MPC10 and in MCF7 cells. AURKA encodes for Aurora Kinase A, a serine-threonine kinase mainly involved in centrosome duplication, mitotic entry, and spindle assembly 50. Although AURKA gene amplification is a common genetic aberration in breast cancer 16, its role as a therapeutic target for breast cancers harbouring amplification of this locus remains to be fully established. Taken together, these findings suggest that some private fusion genes may provide a growth/survival advantage to cancer cells and that this advantage is context-dependent and may be the product of epistatic interactions.
Some of the partner genes of the validated chimeric transcripts found in the present study were shown to be involved in other somatic rearrangements in breast cancers. CDK12, LASP1, RAE1, C17orf57, NSF, and USH2A were partners of out-of-frame, but not in-frame, fusion genes here and in other massively parallel sequencing analyses of breast cancers 12,15–17,41–43 (Supplementary Table 7). It is plausible that these out-of-frame rearrangements result in loss of function of one or both partners involved. Re-analysis of publicly available data revealed that CDK12 may constitute a tumour suppresser gene as it is recurrently targeted not only by DNA rearrangements in breast (2.6% of unselected breast cancers; 13% of HER2-amplified breast cancers) and 1/17 (5%) HER2-amplified gastric cancers 51, but also by nonsense mutations in 1.5% of triple-negative breast cancers 43. Consistent with this notion, CDK12 has been shown to be related to DNA repair, given that it plays a role in the regulation of transcription. In addition, depletion of CDK12 results in decreased expression of predominantly long genes with high numbers of exons, in particular DNA damage response genes, including BRCA1, ATR, FANCI, and FANCD2. CDK12-deficient cells display spontaneous DNA damage and are sensitive to a variety of DNA-damaging agents 48. Here we have demonstrated that RNA-interference-mediated silencing of CDK12 in ER-positive cell lines resulted in increased sensitivity to PARP inhibition and a reduction in the ability to form RAD51 foci in the nucleus upon DNA damage through irradiation or PARP inhibition. Furthermore, MDA-MB-453 cells, which lack CDK12, displayed sensitivity to PARP inhibition, which was rescued upon re-expression of full-length CDK12. These observations suggest that the subset of HER2-amplified breast cancers harbouring a disruption of CDK12 through somatic rearrangements may benefit from treatment with PARP inhibitors, and provide a molecular rationale for the testing of these agents in HER2-positive disease.
This study has several limitations. First, the small number of cases subjected to mRNA sequencing could have resulted in a type II/β-error in the search of a highly-recurrent pathognomonic event; however, by the sequencing of five samples we should have been able to identify a recurrent event (ie with a prevalence similar to FOXL2 mutations in granulosa cell tumours of the ovary 52) with 97% statistical power. Second, although cell lines constitutively harbouring the in-frame fusion genes identified in primary MPCs were not available, our results demonstrate that forced expression of SLC2A1–FAF1 and BCAS4–AURKA results in increased growth/survival in multiple breast cancer cells.
In conclusion, our findings demonstrate that the MPC phenotype in breast cancers is neither driven by pathognomonic mutations affecting the 273 recurrently mutated breast cancer and DNA repair-related genes tested in this study, nor is it underpinned by a highly-recurrent pathognomonic expressed fusion gene. Although the fusion genes identified in this study were private events, we have provided circumstantial evidence to suggest that at least some private in-frame expressed fusion genes may also be driver events and impact on cancer cell proliferation. Finally, some of the out-of-frame CDK12 rearrangements in HER2-positive breast cancers were shown to lead to a potential loss of function and provide a rationale for treating a subset of HER2-amplified patients with PARP inhibitors.
Acknowledgments
This study was funded by Breakthrough Breast Cancer. RN is the recipient of a Breast Cancer Campaign Career Development Fellowship. PMW is in receipt of a Wellcome Trust Clinical Research Fellowship grant. CM is funded by AIRC (MFAG 13310). SP is funded by the Swiss National Foundation; CAM is supported by an NIH Pathway to Independence Award (R00CA149182-03). We acknowledge NHS funding to the NIHR Biomedical Research Centre and AIRC (IG 10787 to AS).
Author contribution statement
RN, AMC, CAM, and JSR-F conceived and designed the experiments. RN, CM, SP, CKYN, PW, MBL, EPS, KJD, JF, IB, AK, PW, and PMW performed the experiments. DH, AS, KF, IK, DH, CJL, AS, and AA provided samples and/or facilities. RN, PMW, CM, CKYN, MBL, AM, RAH, JH, CM, CK-S, BW, CAM, and JSR-F analysed the data. RN, CM, PMW, BW, CAM, and JSR-F wrote the manuscript. All authors revised and approved the final draft.
SUPPORTING INFORMATION ON THE INTERNET
The following supporting information may be found in the online version of this article.
Flow diagram of the study design.
Figure S2. Identification and validation of PIK3CA mutations by the Sequenom OncoCarta v1.0 panel.
Figure S3. Validation of high-confidence fusion genes.
Figure S4. Recurrence RT-PCR screen for nominated fusions in 14 micropapillary and 14 grade- and ER-matched IC-NSTs.
Figure S5. Reconstitution of CDK12 in MDA-MB-453 with olaparib.
Figure S6. Assessment of RAD51 foci formation in MCF7 cells with CDK12 silencing.
Table S1. Details of the validation cohort of breast cancers.
Table S2. Summary of antibodies, clones, dilutions, antigen retrieval methods, scoring, and cut-offs used for immunohistochemistry.
Table S3. List of 273 genes included in the targeted capture massively parallel sequencing platform.
Table S4. Breast cancer cell line characteristics.
Table S5. Chromosomal regions of recurrent copy number changes in 16 MPCs, and the protein coding genes, microRNAs, and copy number variations mapping to these regions.
Table S6. Summary of mRNA-sequencing statistics.
Table S7. Recurrent alterations identified through re-analysis of public datasets.
References
Note: References 53-59 are cited in the Supporting information to this article.
- 1.Lakhani SR, Ellis IO, Schnitt SJ, et al. WHO Classification of Tumours of the Breast. 4th edn. Lyon: IARC Press; 2012. [Google Scholar]
- 2.Marchio C, Iravani M, Natrajan R, et al. Mixed micropapillary–ductal carcinomas of the breast: a genomic and immunohistochemical analysis of morphologically distinct components. J Pathol. 2009;218::301–315. doi: 10.1002/path.2572. [DOI] [PubMed] [Google Scholar]
- 3.Marchio C, Iravani M, Natrajan R, et al. Genomic and immunophenotypical characterization of pure micropapillary carcinomas of the breast. J Pathol. 2008;215::398–410. doi: 10.1002/path.2368. [DOI] [PubMed] [Google Scholar]
- 4.Weigelt B, Geyer FC, Reis-Filho JS. Histological types of breast cancer: how special are they? Mol Oncol. 2010;4::192–208. doi: 10.1016/j.molonc.2010.04.004. [DOI] [PMC free article] [PubMed] [Google Scholar]
- 5.Weigelt B, Reis-Filho JS. Histological and molecular types of breast cancer: is there a unifying taxonomy? Nature Rev Clin Oncol. 2009;6::718–730. doi: 10.1038/nrclinonc.2009.166. [DOI] [PubMed] [Google Scholar]
- 6.Persson M, Andren Y, Mark J, et al. Recurrent fusion of MYB and NFIB transcription factor genes in carcinomas of the breast and head and neck. Proc Natl Acad Sci U S A. 2009;106::18740–18744. doi: 10.1073/pnas.0909114106. [DOI] [PMC free article] [PubMed] [Google Scholar]
- 7.Tognon C, Knezevich SR, Huntsman D, et al. Expression of the ETV6–NTRK3 gene fusion as a primary event in human secretory breast carcinoma. Cancer Cell. 2002;2::367–376. doi: 10.1016/s1535-6108(02)00180-0. [DOI] [PubMed] [Google Scholar]
- 8.Bertucci F, Orsetti B, Negre V, et al. Lobular and ductal carcinomas of the breast have distinct genomic and expression profiles. Oncogene. 2008;27::5359–5372. doi: 10.1038/onc.2008.158. [DOI] [PMC free article] [PubMed] [Google Scholar]
- 9.Weigelt B, Geyer FC, Natrajan R, et al. The molecular underpinning of lobular histological growth pattern: a genome-wide transcriptomic analysis of invasive lobular carcinomas and grade- and molecular subtype-matched invasive ductal carcinomas of no special type. J Pathol. 2010;220::45–57. doi: 10.1002/path.2629. [DOI] [PubMed] [Google Scholar]
- 10.Ding L, Ellis MJ, Li S, et al. Genome remodelling in a basal-like breast cancer metastasis and xenograft. Nature. 2010;464::999–1005. doi: 10.1038/nature08989. [DOI] [PMC free article] [PubMed] [Google Scholar]
- 11.Shah SP, Morin RD, Khattra J, et al. Mutational evolution in a lobular breast tumour profiled at single nucleotide resolution. Nature. 2009;461::809–813. doi: 10.1038/nature08489. [DOI] [PubMed] [Google Scholar]
- 12.Stephens PJ, McBride DJ, Lin ML, et al. Complex landscapes of somatic rearrangement in human breast cancer genomes. Nature. 2009;462::1005–1010. doi: 10.1038/nature08645. [DOI] [PMC free article] [PubMed] [Google Scholar]
- 13.Edgren H, Murumagi A, Kangaspeska S, et al. Identification of fusion genes in breast cancer by paired-end RNA-sequencing. Genome Biol. 2011;12::R6. doi: 10.1186/gb-2011-12-1-r6. [DOI] [PMC free article] [PubMed] [Google Scholar]
- 14.Natrajan R, Mackay A, Lambros MB, et al. A whole-genome massively parallel sequencing analysis of BRCA1 mutant oestrogen receptor-negative and -positive breast cancers. J Pathol. 2012;227::29–41. doi: 10.1002/path.4003. [DOI] [PMC free article] [PubMed] [Google Scholar]
- 15.Banerji S, Cibulskis K, Rangel-Escareno C, et al. Sequence analysis of mutations and translocations across breast cancer subtypes. Nature. 2012;486::405–409. doi: 10.1038/nature11154. [DOI] [PMC free article] [PubMed] [Google Scholar]
- 16.The Cancer Genome Atlas Network. Comprehensive molecular portraits of human breast tumours. Nature. 2012;490::61–70. doi: 10.1038/nature11412. [DOI] [PMC free article] [PubMed] [Google Scholar]
- 17.Robinson DR, Kalyana-Sundaram S, Wu YM, et al. Functionally recurrent rearrangements of the MAST kinase and Notch gene families in breast cancer. Nature Med. 2011;17::1646–1651. doi: 10.1038/nm.2580. [DOI] [PMC free article] [PubMed] [Google Scholar]
- 18.Ha KC, Lalonde E, Li L, et al. Identification of gene fusion transcripts by transcriptome sequencing in BRCA1-mutated breast cancers and cell lines. BMC Med Genomics. 2011;4::75. doi: 10.1186/1755-8794-4-75. [DOI] [PMC free article] [PubMed] [Google Scholar]
- 19.Kalyana-Sundaram S, Shankar S, Deroo S, et al. Gene fusions associated with recurrent amplicons represent a class of passenger aberrations in breast cancer. Neoplasia. 2012;14::702–708. doi: 10.1593/neo.12914. [DOI] [PMC free article] [PubMed] [Google Scholar]
- 20.Geyer FC, Weigelt B, Natrajan R, et al. Molecular analysis reveals a genetic basis for the phenotypic diversity of metaplastic breast carcinomas. J Pathol. 2010;220::562–573. doi: 10.1002/path.2675. [DOI] [PubMed] [Google Scholar]
- 21.Marchio C, Natrajan R, Shiu KK, et al. The genomic profile of HER2-amplified breast cancers: the influence of ER status. J Pathol. 2008;216::399–407. doi: 10.1002/path.2423. [DOI] [PubMed] [Google Scholar]
- 22.Hernandez L, Wilkerson PM, Lambros MB, et al. Genomic and mutational profiling of ductal carcinomas in situ and matched adjacent invasive breast cancers reveals intra-tumour genetic heterogeneity and clonal selection. J Pathol. 2012;227::42–52. doi: 10.1002/path.3990. [DOI] [PMC free article] [PubMed] [Google Scholar]
- 23.Coe BP, Ylstra B, Carvalho B, et al. Resolving the resolution of array CGH. Genomics. 2007;89::647–653. doi: 10.1016/j.ygeno.2006.12.012. [DOI] [PubMed] [Google Scholar]
- 24.Gunnarsson R, Staaf J, Jansson M, et al. Screening for copy-number alterations and loss of heterozygosity in chronic lymphocytic leukemia – a comparative study of four differently designed, high resolution microarray platforms. Genes Chromosomes Cancer. 2008;47::697–711. doi: 10.1002/gcc.20575. [DOI] [PubMed] [Google Scholar]
- 25.Tan DS, Lambros MB, Natrajan R, et al. Getting it right: designing microarray (and not ‘microawry’) comparative genomic hybridization studies for cancer research. Lab Invest. 2007;87::737–754. doi: 10.1038/labinvest.3700593. [DOI] [PubMed] [Google Scholar]
- 26.Natrajan R, Weigelt B, Mackay A, et al. An integrative genomic and transcriptomic analysis reveals molecular pathways and networks regulated by copy number aberrations in basal-like, HER2 and luminal cancers. Breast Cancer Res Treat. 2010;121::575–589. doi: 10.1007/s10549-009-0501-3. [DOI] [PubMed] [Google Scholar]
- 27.Duprez R, Wilkerson PM, Lacroix-Triki M, et al. Immunophenotypic and genomic characterization of papillary carcinomas of the breast. J Pathol. 2012;226::427–441. doi: 10.1002/path.3032. [DOI] [PMC free article] [PubMed] [Google Scholar]
- 28.Wagle N, Berger MF, Davis MJ, et al. High-throughput detection of actionable genomic alterations in clinical tumor samples by targeted, massively parallel sequencing. Cancer Discov. 2012;2::82–93. doi: 10.1158/2159-8290.CD-11-0184. [DOI] [PMC free article] [PubMed] [Google Scholar]
- 29.De Mattos-Arruda L, Bidard FC, Won HH, et al. Establishing the origin of metastatic deposits in the setting of multiple primary malignancies: the role of massively parallel sequencing. Mol Oncol. 2013 doi: 10.1016/j.molonc.2013.10.006. (Epub ahead of print); DOI: 10.1016/j.molonc.2013.10.006. [DOI] [PMC free article] [PubMed] [Google Scholar]
- 30.DePristo MA, Banks E, Poplin R, et al. A framework for variation discovery and genotyping using next-generation DNA sequencing data. Nature Genet. 2011;43::491–498. doi: 10.1038/ng.806. [DOI] [PMC free article] [PubMed] [Google Scholar]
- 31.Cibulskis K, Lawrence MS, Carter SL, et al. Sensitive detection of somatic point mutations in impure and heterogeneous cancer samples. Nature Biotechnol. 2013;31::213–219. doi: 10.1038/nbt.2514. [DOI] [PMC free article] [PubMed] [Google Scholar]
- 32.Ding J, Bashashati A, Roth A, et al. Feature-based classifiers for somatic mutation detection in tumour–normal paired sequencing data. Bioinformatics. 2012;28::167–175. doi: 10.1093/bioinformatics/btr629. [DOI] [PMC free article] [PubMed] [Google Scholar]
- 33.McKenna A, Hanna M, Banks E, et al. The Genome Analysis Toolkit: a MapReduce framework for analyzing next-generation DNA sequencing data. Genome Res. 2010;20::1297–1303. doi: 10.1101/gr.107524.110. [DOI] [PMC free article] [PubMed] [Google Scholar]
- 34.Koboldt DC, Zhang Q, Larson DE, et al. VarScan 2: somatic mutation and copy number alteration discovery in cancer by exome sequencing. Genome Res. 2012;22::568–576. doi: 10.1101/gr.129684.111. [DOI] [PMC free article] [PubMed] [Google Scholar]
- 35.Robinson JT, Thorvaldsdottir H, Winckler W, et al. Integrative genomics viewer. Nature Biotechnol. 2011;29::24–26. doi: 10.1038/nbt.1754. [DOI] [PMC free article] [PubMed] [Google Scholar]
- 36.Tanas MR, Sboner A, Oliveira AM, et al. Identification of a disease-defining gene fusion in epithelioid hemangioendothelioma. Sci Transl Med. 2011;3: doi: 10.1126/scitranslmed.3002409. 98ra82. [DOI] [PubMed] [Google Scholar]
- 37.Iyer MK, Chinnaiyan AM, Maher CA. ChimeraScan: a tool for identifying chimeric transcription in sequencing data. Bioinformatics. 2011;27::2903–2904. doi: 10.1093/bioinformatics/btr467. [DOI] [PMC free article] [PubMed] [Google Scholar]
- 38.Wilkerson PM, Dedes KJ, Wetterskog D, et al. Functional characterization of EMSY gene amplification in human cancers. J Pathol. 2011;225::29–42. doi: 10.1002/path.2944. [DOI] [PubMed] [Google Scholar]
- 39.Dedes KJ, Wetterskog D, Mendes-Pereira AM, et al. PTEN deficiency in endometrioid endometrial adenocarcinomas predicts sensitivity to PARP inhibitors. Sci Transl Med. 2010;2: doi: 10.1126/scitranslmed.3001538. 53ra75. [DOI] [PubMed] [Google Scholar]
- 40.Horlings HM, Weigelt B, Anderson EM, et al. Genomic profiling of histological special types of breast cancer. Breast Cancer Res Treat. 2013;142::257–269. doi: 10.1007/s10549-013-2740-6. [DOI] [PubMed] [Google Scholar]
- 41.Ellis MJ, Ding L, Shen D, et al. Whole-genome analysis informs breast cancer response to aromatase inhibition. Nature. 2012;486::353–360. doi: 10.1038/nature11143. [DOI] [PMC free article] [PubMed] [Google Scholar]
- 42.Nik-Zainal S, Alexandrov LB, Wedge DC, et al. Mutational processes molding the genomes of 21 breast cancers. Cell. 2012;149::979–993. doi: 10.1016/j.cell.2012.04.024. [DOI] [PMC free article] [PubMed] [Google Scholar]
- 43.Shah SP, Roth A, Goya R, et al. The clonal and mutational evolution spectrum of primary triple-negative breast cancers. Nature. 2012;486::395–399. doi: 10.1038/nature10933. [DOI] [PMC free article] [PubMed] [Google Scholar]
- 44.Doublier S, Belisario DC, Polimeni M, et al. HIF-1 activation induces doxorubicin resistance in MCF7 3-D spheroids via P-glycoprotein expression: a potential model of the chemo-resistance of invasive micropapillary carcinoma of the breast. BMC Cancer. 2012;12::4. doi: 10.1186/1471-2407-12-4. [DOI] [PMC free article] [PubMed] [Google Scholar]
- 45.Vasmatzis G, Johnson SH, Knudson RA, et al. Genome-wide analysis reveals recurrent structural abnormalities of TP63 and other p53-related genes in peripheral T-cell lymphomas. Blood. 2012;120::2280–2289. doi: 10.1182/blood-2012-03-419937. [DOI] [PMC free article] [PubMed] [Google Scholar]
- 46.Mao X, Boyd LK, Yanez-Munoz RJ, et al. Chromosome rearrangement associated inactivation of tumour suppressor genes in prostate cancer. Am J Cancer Res. 2011;1::604–617. [PMC free article] [PubMed] [Google Scholar]
- 47.Shiu KK, Wetterskog D, Mackay A, et al. Integrative molecular and functional profiling of ERBB2-amplified breast cancers identifies new genetic dependencies. Oncogene. 2013 doi: 10.1038/onc.2012.625. (Epub ahead of print); DOI: 10.1038/onc.2012.625. [DOI] [PubMed] [Google Scholar]
- 48.Blazek D, Kohoutek J, Bartholomeeusen K, et al. The Cyclin K/Cdk12 complex maintains genomic stability via regulation of expression of DNA damage response genes. Genes Dev. 2011;25::2158–2172. doi: 10.1101/gad.16962311. [DOI] [PMC free article] [PubMed] [Google Scholar]
- 49.Menges CW, Altomare DA, Testa JR. FAS-associated factor 1 (FAF1): diverse functions and implications for oncogenesis. Cell Cycle. 2009;8::2528–2534. doi: 10.4161/cc.8.16.9280. [DOI] [PMC free article] [PubMed] [Google Scholar]
- 50.Vader G, Lens SM. The Aurora kinase family in cell division and cancer. Biochim Biophys Acta. 2008;1786::60–72. doi: 10.1016/j.bbcan.2008.07.003. [DOI] [PubMed] [Google Scholar]
- 51.Zang ZJ, Ong CK, Cutcutache I, et al. Genetic and structural variation in the gastric cancer kinome revealed through targeted deep sequencing. Cancer Res. 2011;71::29–39. doi: 10.1158/0008-5472.CAN-10-1749. [DOI] [PMC free article] [PubMed] [Google Scholar]
- 52.Shah SP, Kobel M, Senz J, et al. Mutation of FOXL2 in granulosa-cell tumors of the ovary. N Engl J Med. 2009;360::2719–2729. doi: 10.1056/NEJMoa0902542. [DOI] [PubMed] [Google Scholar]
- 53.Wetterskog D, Lopez-Garcia MA, Lambros MB, et al. Adenoid cystic carcinomas constitute a genomically distinct subgroup of triple-negative and basal-like breast cancers. J Pathol. 2012;226::84–96. doi: 10.1002/path.2974. [DOI] [PubMed] [Google Scholar]
- 54.Harvey JM, Clark GM, Osborne CK, et al. Estrogen receptor status by immunohistochemistry is superior to the ligand-binding assay for predicting response to adjuvant endocrine therapy in breast cancer. J Clin Oncol. 1999;17::1474–1481. doi: 10.1200/JCO.1999.17.5.1474. [DOI] [PubMed] [Google Scholar]
- 55.Jacobs TW, Gown AM, Yaziji H, et al. Specificity of HercepTest in determining HER-2/neu status of breast cancers using the United States Food and Drug Administration-approved scoring system. J Clin Oncol. 1999;17::1983–1987. doi: 10.1200/JCO.1999.17.7.1983. [DOI] [PubMed] [Google Scholar]
- 56.Mackay A, Tamber N, Fenwick K, et al. A high-resolution integrated analysis of genetic and expression profiles of breast cancer cell lines. Breast Cancer Res Treat. 2009;118::481–498. doi: 10.1007/s10549-008-0296-7. [DOI] [PubMed] [Google Scholar]
- 57.Natrajan R, Lambros MB, Rodriguez-Pinilla SM, et al. Tiling path genomic profiling of grade 3 invasive ductal breast cancers. Clin Cancer Res. 2009;15::2711–2722. doi: 10.1158/1078-0432.CCR-08-1878. [DOI] [PubMed] [Google Scholar]
- 58.Sathirapongsasuti JF, Lee H, Horst BA, et al. Exome sequencing-based copynumber variation and loss of heterozygosity detection: ExomeCNV. Bioinformatics. 2011;27::2648–2654. doi: 10.1093/bioinformatics/btr462. [DOI] [PMC free article] [PubMed] [Google Scholar]
- 59.Brough R, Frankum JR, Sims D, et al. Functional viability profiles of breast cancer. Cancer Discov. 2011;1::260–273. doi: 10.1158/2159-8290.CD-11-0107. [DOI] [PMC free article] [PubMed] [Google Scholar]
Associated Data
This section collects any data citations, data availability statements, or supplementary materials included in this article.
Supplementary Materials
Flow diagram of the study design.
Figure S2. Identification and validation of PIK3CA mutations by the Sequenom OncoCarta v1.0 panel.
Figure S3. Validation of high-confidence fusion genes.
Figure S4. Recurrence RT-PCR screen for nominated fusions in 14 micropapillary and 14 grade- and ER-matched IC-NSTs.
Figure S5. Reconstitution of CDK12 in MDA-MB-453 with olaparib.
Figure S6. Assessment of RAD51 foci formation in MCF7 cells with CDK12 silencing.
Table S1. Details of the validation cohort of breast cancers.
Table S2. Summary of antibodies, clones, dilutions, antigen retrieval methods, scoring, and cut-offs used for immunohistochemistry.
Table S3. List of 273 genes included in the targeted capture massively parallel sequencing platform.
Table S4. Breast cancer cell line characteristics.
Table S5. Chromosomal regions of recurrent copy number changes in 16 MPCs, and the protein coding genes, microRNAs, and copy number variations mapping to these regions.
Table S6. Summary of mRNA-sequencing statistics.
Table S7. Recurrent alterations identified through re-analysis of public datasets.