Abstract
Fluorescent dyes are commonly conjugated to nanomaterials for imaging applications using stochastic synthesis conditions that result in a Poisson distribution of dye/particle ratios and therefore a broad range of photophysical and biodistribution properties. We report the isolation and characterization of generation 5 poly(amidoamine) (G5 PAMAM) dendrimer samples containing 1, 2, 3, and 4 fluorescein (FC) or 6-carboxytetramethylrhodamine succinimidyl ester (TAMRA) dyes per polymer particle. For the fluorescein case, this was achieved by stochastically functionalizing dendrimer with a cyclooctyne `click' ligand, separation into sample containing precisely defined `click' ligand/particle ratios using reverse-phase high performance liquid chromatography (rp-HPLC), followed by reaction with excess azide-functionalized fluorescein dye. For the TAMRA samples, stochastically functionalized dendrimer was directly separated into precise dye/particle ratios using rp-HPLC. These materials were characterized using 1H and 19F NMR, rp-HPLC, UV-Vis and fluorescence spectroscopy, lifetime measurements, and MALDI.
Introduction
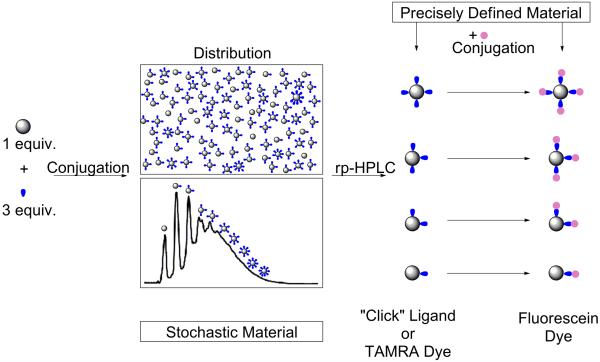
Precise control of dye/particle ratio has been a major challenge in nanomaterials chemistry.1–4 For many classes of nanomaterials, there are a large number of functional sites to which a small number of ligands are conjugated. This results in a Poisson distribution of ligand/particle ratios in the product obtained. For example, a generation 5 poly(amidoamine) (G5 PAMAM) dendrimer with 128 surface sites will generate eight species ranging from 0 to 7 dyes per particle when an average of three dyes is conjugated to polymer (Figure 1). Although deviations from the Poisson distribution can arise from mass transport,5 as well as site blocking and steric effects,6 these detailed considerations tend to lead to broader, not narrower, distributions. The presence of these distributions complicates understanding the behavior of these materials and limits their effectiveness for desired applications.
Figure 1.
Outline of procedure for obtaining precise ligand/particle ratios on a G5 PAMAM dendrimer.
Nanomaterials containing a Poisson distribution of dye/particle ratios have a range of photophysical and biodistribution properties. For this reason, a variety of strategies have been employed to minimize the distribution. A particularly interesting approach for dendrimeric polymers is encapsulation in the internal spaces between the branched arms.7,8 Dye encapsulation can be tuned depending on concentration, dye structure, and dendrimer structure including generation, length of alkane linker in the core, and end-capping of arms.7,9–11 Dendrimer structural isomerization can be used to vary the dye hosting capacity.12 Computer simulations indicate that the dendrimer systems are dynamic and that no static encapsulation volumes exist within the dendrimer arms.13
In order to overcome the limitations of encapsulated and stochastically conjugated systems, effort has been invested to synthesize precise dye/particle ratios.14–17 Convergent synthesis methods for dendritic polymers offer a powerful solution, although this strategy is generally limited to dye/particle ratios that are multiples of the numbers of dendrimer arms. Convergent strategies are also limited in terms of both dendrimer generation and molecular weight. Alternatively, methods to give a unique conjugation site on the polymer, for example the terminal site of a dendron, have also been employed.18
There is a substantial need for advance fluorescent probes with small dimensions (<10 nm) and well-defined photophysical and biological properties.19 We desired to develop a general strategy that would allow integer variation of dye/particle ratios on water soluble, divergent dendrimer platforms. In particular, the goal was to develop materials where the dye/particle ratio was identical for all particles in the sample (precisely defined), as opposed to an average dye particle ratio made up of a Poisson distribution of materials (stochastic average). Dendrimers synthesized using divergent synthetic methods are generally more defective than convergent materials; however, a greater range of generations, and therefore sizes and molecular weight is available. Acetylated G5 PAMAM dendrimer was selected as a material target because it is large enough to impart aqueous stability to at least ten hydrophobic ligands while it is small enough to escape through vascular pores and disperse through the tissue matrix to reach cells.20 In addition, it is small enough to be filtered and excreted by the kidney. G5 and G6 PAMAM dendrimers with these properties were recently prepared using stochastic conjugations of Cy3 and Cy5 dyes.21 The amine-terminated G5 PAMAM dendrimer is of interest because this material, which becomes positively charged in aqueous solution, is a useful non-viral vector for gene delivery.22–24 For all of these biological applications, materials with homogenous photophysical and biodistribution properties that also meet the biological criteria discussed above are desired. For this combined set of reasons, we desired to find a solution to obtaining precise ligand/dendrimer ratio materials for divergent, hydrophilic dendrimers.
Recently, we reported isolating materials with systematic variation of `click ligand'/dendrimer ratio on a G5 PAMAM core.25 This system is interesting in that dendrimer samples containing precise ligand/particle ratio can be isolated even though the divergent G5 dendrimer platform itself retains its normal molecular weight distribution. This suggested two possible paths for obtaining G5 PAMAM dendrimer materials containing precise dye/particle ratios: 1) dye conjugation to materials containing precise click ligand/dendrimer ratios or 2) isolation via direct separation of a stochastic mixture of dye conjugates. We now report the successful isolation of G5-(FC)n (n = 1–4) using the click conjugation strategy and G5-TAMRAn (n = 1–3) using the direct separation of dye conjugates.
Experimental
Biomedical grade G5 PAMAM dendrimer was purchased from Dendritech Inc. and purified using rp-HPLC method to obtain G5 dendrimer without trailing generations (G1–G4), dimers, and trimers.26 Aminofluorescein, trifluoroacetic acid, triethylamine, and acetic anhydride were purchased from Sigma-Aldrich (St. Louis, MO) and used as received. HPLC grade water,acetonitrile, and methanol, as well as dimethyl sulfoxide, hydrochloric acid, sodium azide, and sodium nitrite, were purchased from Fisher-Scientific and used as received. Click-Easy™ MFCO-N-hydroxysuccinimide was purchased from Berry & Associates Synthetic Medicinal Chemistry (Dexter, MI) and used as received. 5-carboxytetramethylrhodamine (TAMRA) succinimidyl ester was purchased from Life Technologies and used as received. Azido-fluorescein was synthesized using a literature protocol.27 A 500 MHz Varian NMR instrument was used for all 1H and 19F NMR measurements. 19F spectra were referenced to the 19F signal of internal trichlorofluoromethane using a Ξ of 94.0940110. All MALDI-TOF-MS measurements were performed on a Bruker Ultraflex III.
Synthesis of G5-Ac-MFCO Conjugates (stochastic average)
MFCO-N-hydroxysuccinimide (0.0062g, 0.0240mmol, 4.4 equiv) was dissolved in dimethyl sulfoxide (1.6 mL) and added dropwise to a solution of G5 PAMAM dendrimer (0.1554 g, 0.0055 mmol, 1.0 equiv) in water (34.4 mL). The mixture was stirred at 21 °C overnight and purified by centrifuge washing twice with 1X PBS and 5 times with deionized water. Upon lyophilization a white solid was obtained (61% yield). The white solid (0.0936 g, 0.0033 mmol, 1.0 equiv) was dissolved in anhydrous methanol (17.3 mL), 0.11 mL of triethylamine was added (0.07 mol, 224 equiv) was added, and the mixture stirred for 15 minutes. Acetic anhydride (0.06 mL, 0.60 mmol, 179 equiv) was added slowly until the solution turned clear and the mixture was stirred at room temperature for 4 hours. The sample was lyphophilized, dissolved in 2.5 mL 1X PBS, and purified using centrifuge washing twice with 1X PBS and 5 times with deionized water. Upon lyophilization a white solid was obtained (73% yield).
Synthesis of G5-Ac-TAMRA Conjugates (stochastic average)
TAMRA succinimidyl ester (0.0102 g, 0.0194 mmol, 3.5 equiv) was dissolved in dimethyl sulfoxide (2.5mL), added dropwise to G5 PAMAM dendrimer (0.1520 g, 0.0054 mmol, 1.0 equiv) dissolved in water (33.7mL), and stirred at 21 °C overnight. The reaction mixture was passed through a sephadex column (GE Healthcare protocol) to remove unreacted TAMRA and lyophilized resulting in a purple solid (78% yield). The purple solid (0.1178 g, 0.0042 mmol, 1.0 equiv) was dissolved in anhydrous methanol (22.4mL), 0.15 mL triethylamine (0.09mol, 224 equiv) was added, and the mixture stirred for 15 minutes. Acetic anhydride (0.08mL, 0.8mmol, 179 equiv) was added slowly until the solution becomes transparent. The mixture was stirred at 21 °C for 4 hours and lyophilized. The sample was re-dissolved in 2.5 mL 1X PBS and purified using centrifuge washing twice with 1X PBS and 5 times with deionized water. Upon lyophilization, a purple solid was obtained (72% yield).
Isolation of Precise Ratio G5-Ac-MFCOn (n = 1 – 4)
rp-HPLC separation was carried out using a Waters Delta 600 HPLC with a C18 silica-based rp-HPLC column (250 × 21.20 mm, 5 μm particles) connected to a C18 guard column (50 × 21.20 mm). The mobile phase consisted of a linear gradient beginning with 95:5 (v/v) water/acetonitrile mixture and ending with 55:45 (v/v) water/acetonitrile over 30 minutes at a flow rate of 16.37 mL/min. The water/acetonitrile mixture contained 0.10 wt % trifluoroacetic acid (TFA). Elution traces of the dendrimer-ligand conjugate were obtained at 210 nm. A concentration of 30 mg/mL per injection was used. The auto sampler fractions were 5 seconds long and 120 fractions were collected starting at 9 minutes and 1 second. The fractions were then combined to obtain each G5-Ac-MFCOn sample based upon analysis of the chromatogram in Origin-Pro.
General procedure for copper-free click reactions
A 54 mM stock solution of azido-fluorescein in dimethyl sulfoxide was prepared. Each G5-Ac-MFCOn was dissolved in methanol at a concentration of 2 mM based on MFCO. 10 equivalents of azidofluorescein per each MFCO were added and the mixture stirred at 21 °C for 48 hours. Following lyophilization the solid was re-dissolved in 2.5 mL 10x PBS, eluted through a sephadex column (GE Healthcare protocol) to remove excess azido-fluorescein. The 3.5 mL total solution was transferred to a 10,000 molecular cutoff dialysis bag (10 mL) and dialyzed versus 2 rounds of 1 L nanopure water. Lyophilization resulted in an orange solid.
Isolation of Precise Ratio G5-Ac-TAMRAn (n = 1 − 3, 4+)
General rp-HPLC protocols and solvents were identical to those described for above. A concentration of 25 mg/mL per injection was used. The auto sampler fractions were 5 seconds long and 120 fractions are collected starting at 10 minutes and 1 second. The fractions were then combined to obtain each G5-Ac-TAMRAn sample based upon analysis of the chromatogram in Origin-Pro.
Analytical reverse-phase Ultra-high Performance Liquid Chromatography (rp-UPLC)
A Water Acuity system with a C18 silica-based UPLC column (Agilent) was employed with a linear gradient mobile phase beginning with 95:5 (v/v) water/acetonitrile and ending with 55:45 (v/v) water/acetonitrile over 22 minutes at a flow rate of 2.0mL/min. The water/acetonitrile mixture contained 0.10 wt % trifluoroacetic acid (TFA). Elution traces were measured at 210 nm (dendrimer) and 491nm (dye). The instrument was also controlled by Empower 2 software.
Absorption and Emission Measurements
Fluorescence and UV-Vis measurements were taken at a concentration of 0.1 mg/mL using a Fluoromax-4 (slit width 2 nm) and a Shimadzu UV-1601 UV/vis spectrometer, respectively. For fluorescein conjugates an excitation of 491 nm and emission of 521 nm was employed. For TAMRA conjugates an excitation of 560 nm and emission of 580 nm was employed.
MALDI-TOF-MS Measurements
Three solutions were prepared: 1) 10 mg/mL dendrimer in water 2) 20 mg/mL sinnipinic acid in 1:1 acetonitrile: water and 3) 20 mg/mL sodium trifluoroacetate in water. These were then combined in a ratio of 10:2:1 of matrix:dendrimer:salt solution. The plate was spotted with 1 uL volumes of solution and allowed to dry. At least 100 scans were averaged per measurement and a smoothing factor of 12 channels was employed.
Fluorescence Quantum Yield and Lifetime Data
Photoluminescence quantum yields (ΦPL)28
ΦPL were recorded on a Fluoromax-4 (slit width 2.5 nm) and determined by a comparison method between a standard and sample of equal concentration and an excitation wavelength. Fluorescein samples were compared for ΦPL with a standard solution of fluorescein in water at pH 11 (excitation 490 nm, ΦPL = 0.70). TAMRA samples were compared for ΦPL with a standard solution of Rhodamine-B in ethanol (excitation 560 nm, ΦPL = 0.70). The solutions were diluted to three sets of concentrations each with absorption ranging from 0.02–0.08, to reduce fluorimeter saturation and excimer formation. The total area of emission for each sample and standard was calculated by subtracting out the background signal and calculating the area in Origin. To obtain the best accuracy, the slope of a plot of emission versus absorption was determined and calculated according to equation (1);
| (1) |
where ΦPL is the quantum yield, A is the absorption at the excitation wavelength, F is the total integrated emission, and n is the refractive index of the solution, which due to low concentration, can be approximated as the refractive index of the solvent. Subscripts x and s refer to the sample and reference, respectively.
Fluorescence Upconversion Kinetics.29
The sample solution was excited with frequency-doubled light from a mode-locked Ti-sapphire laser (Tsunami, Spectra Physics). This produces pulses of approximately 100 fs duration at a wavelength of 400 nm. Our upconversion apparatus also consists of the basic unit of the FOG-100 system (CDP). The polarization of the excitation beam for the anisotropy measurements was controlled with a Berek compensator. The sample cuvette was of 1 mm thick and was held in a rotating holder to avoid possible photo-degradation and other accumulative effects. The horizontally polarized fluorescence emitted from the sample was upconverted in a nonlinear crystal of β-barium borate using a pump beam at 800 nm that was first passed through a variable delay line. The instrument response function (IRF) was determined from the Raman signal of water for 400 nm excitation. Lifetimes were obtained by convoluting the decay profile with the instrument response function. Spectral resolution was achieved by dispersing the upconverted light in a monochromator and detecting it by using a photo-multiplier tube (Hamamatsu R1527P). The average excitation power was kept at a level below 3 mW to reduce excitation beam response. G5-MFCO-Fluorescein-NHAc and fluorescein samples were set to an absorption of ~0.4 at 400 nm in a 1 mm rotating sample cell. Fluorescence was collected at 515 nm, and compared at the 10 and 250 ps time scales. The fluorescence decay curves were then analyzed using a bi-exponential fitting procedure in Origin 7.0 (Origin Lab). TAMRA samples were not analyzed by fluorescence upconversion techniques due to limitations in the excitation wavelength.
Results and Discussion
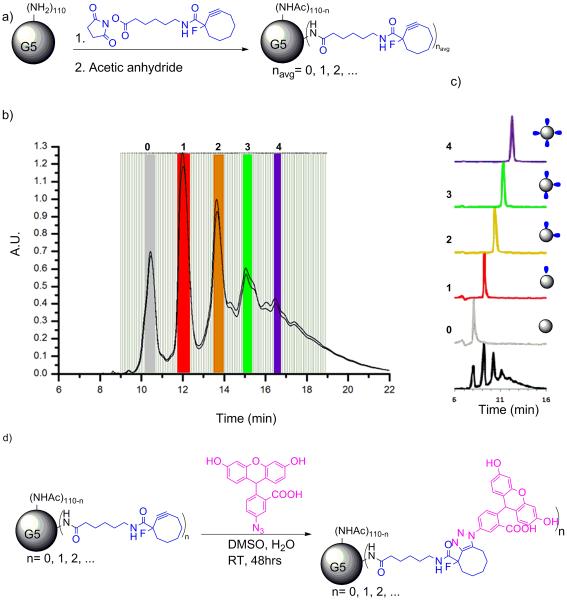
Conjugation of small numbers of hydrophobic ligands, including click linkers or dyes, to G5 PAMAM dendrimer generates a Poisson distribution of ligand/particle ratios (Schemes 1a and 2a).1,2 As highlighted in Schemes 1b and 2b, the amount of shift induced on a C18 rp-HPLC column by each hydrophobic ligand is substantially greater than the peak width induced by the mass distribution of the dendrimer. The baseline separation achieved for the isolated fractions (Schemes 1c and 2c) is substantially improved over previous reports25 because a more highly purified monomer of G5 PAMAM dendrimer was employed from which dimer, trimer, and all trailing generations have been removed by semi-preparative rp-HPLC.26 The tail end of the G5-Ac-TAMRA stochastic mixture (purple trace in Scheme 1c) was combined to generate a mixture of G5-TAMRA conjugates containing ≥ 3 TAMRA dye/dendrimer particle.
Scheme 1.
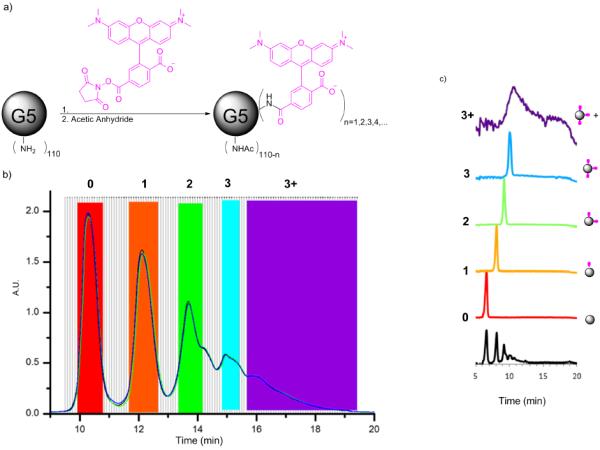
Isolation of dendrimer conjugates G5-Ac-TAMRAn by semi-preparative rp-HPLC. a) Conjugation and full acetylation of G5-Ac-TAMRAn. b) Overlay of semi-preparative rp-HPLC traces for 2 individual runs. Fractions selected for each dendrimer/ligand component are highlighted. c) rpUPLC traces for the isolated dendrimer conjugates (each trace is baseline corrected and normalized). Both rp-HPLC and rp-UPLC traces detected at 210 nm.
Scheme 2.
Isolation of dendrimer conjugates G5-Ac-MFCOn by semi-preparative rp-HPLC. a) Conjugation and full acetylation of G5-Ac-MFCOn . b) Overlayed semi-preparative rp-HPLC traces from 4 individual runs. Fractions selected for each dendrimer/ligand component are highlighted. c) rp-UPLC traces for the isolated dendrimer conjugates (each trace is baseline corrected and normalized). d) Synthesis of precise ratio dendrimer conjugates G5-Ac-Fcn by `click' reactions. Both rp-HPLC and rp-UPLC traces detected at 210 nm.
rp-UPLC indicates the successful isolation of G5-Ac-TAMRA1, G5-Ac-TAMRA2, and G5-Ac-TAMRA3 as discrete samples containing precise dye/dendrimer ratios within the error of the method (Scheme 1c). No shoulders are present on the traces, which would indicate a mixture of ligand/particle ratios, as we have both seen and quantitatively analyzed in previous studies.1 Each of these samples was also analyzed by 1H NMR spectroscopy using methods described previously (Table S1).2,25 In order to evaluate relative integral values and estimate the TAMRA/dendrimer ratio, the acetyl methyl peak of the dendrimer at 1.8 ppm was set to a value of 279 protons based on the average number of 93 arms present for monomer-only G5 PAMAM as determined by gel permeation chromatography and titration.2,26 The 9 aromatic TAMRA protons were used to determine the relative amount of dye. This resulted in an NMR-based estimate of the TAMRA/dendrimer ratios of 0.7, 1.6, 3.1, and 4.4 for the G5-Ac-TAMRA1, G5-Ac-TAMRA2, G5-Ac-TAMRA3, and G5-Ac-TAMRA3+ samples, respectively. Unfortunately, the NMR analysis suffers in accuracy from the large difference in the number of dendrimer vs dye protons and the need to use an average value for the number of acetylated protons on the dendrimer.2,25 In addition, the isolated precise ratio samples derive from only a subset of the full stochastic distribution generated by the synthesis (i.e. the colored bars in Schemes 1b and 2b extend over only part of the peak-width with this fraction decreasing as n increases). This is known error in the use of the GPC and titration data to determine number of dendrimer arms and thus a known error in determination of NMR ratios. This NMR error is also not constant for each sample because the relative size of the collected fraction vs real rp-HPLC peak width varies. For these reasons, we believe the rp-UPLC data provides a better measure of the TAMRA/dendrimer ratio. The full defect structure of the G5 PAMAM dendrimer is subsumed in the rp-UPLC peak width and the peak-to-peak separation is determined by the number of conjugated hydrophobic ligands. Unlike the NMR analysis, this effectively decouples the rp-UPLC assessment of ligand/particle ratio from the base polymer defect structure. Baseline separation of the click ligand/dendrimer ratios is obtained for the isolated samples (Schemes 1c and 2c, Figure 2a).
Figure 2.
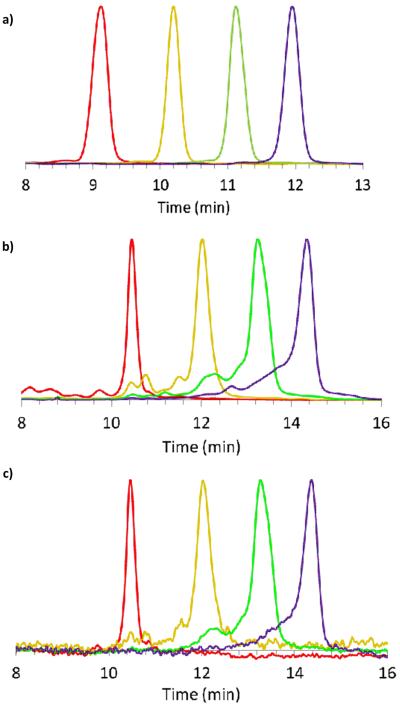
rpUPLC traces a) G5-Ac-MFCOn (n = 1 – 4) at 210 nm b) G5-Ac-FCn (n = 1 – 4) at 210 nm c) G5-Ac-FCn (n = 1 – 4) at 491 nm. Sample n= 1 fluorescein (red), 2 (orange), 3 (green), and 4 (purple).
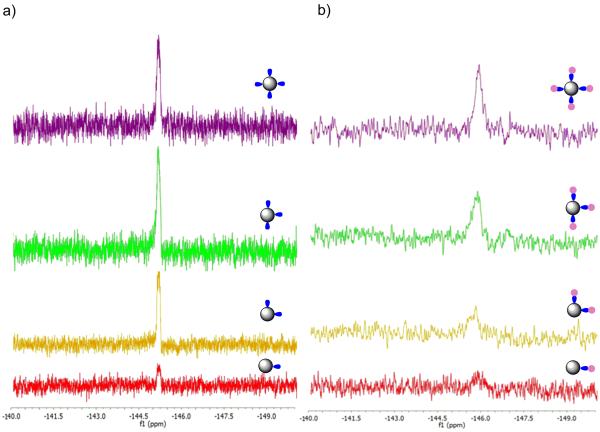
In order to generate the G5-Ac-FCn (n = 1 − 4) samples and drive the click reaction to completion, each G5-Ac-MFCOn (n = 1 − 4) was allowed to react with a ten-fold excess of azido-flourescein (based on the number of MFCO ligands). rp-UPLC characterization indicated the occurrence of successful click reaction whether the trace was detected at 210 nm (dendrimer backbone absorption) or at 491 nm (FC absorption) (Figure 2). For both G5-Ac-FC3 and G5-Ac-FC4 a small amount of n−1 product was detected. Each dye/dendrimer ratio was characterized by 1H NMR spectroscopy (Table S3). The analysis was directly analogous to that described for the TAMRA case (with the same limitations) and resulted in FC/dendrimer ratios of 1.2, 1.8, 3.3, and 3.0 for the G5-Ac-FC1, G5-Ac-FC2, G5-Ac-FC3, and G5-Ac-FC4 samples, respectively. The MFCO ligand also provides the opportunity to analyze the materials using 19F NMR spectroscopy. Spectra for G5-Ac-MFCOn (n = 1 − 4) (δ = −145.1 ppm) exhibiting integrated ratios of 1.2, 2.2, 3.2 and 4 are illustrated in Figure 3a. After conjugation with azide-FC, the peaks broaden, shift to δ = −145.8 ppm, and give integrated ratios of 0.8, 1.6, 2.9 and 4. Note that the 19F NMR analysis does not require the use of average dendrimer arm values but directly measures the number of conjugated arms per dendrimer, independent of structural defects in the polymer scaffold.
Figure 3.
19F NMR of a) pre and b) post click reactions for G5-Ac-MFCOn and- G5-Ac-Fcn (n = 1 - 4). Sample n= 1 fluorescein (red), 2 (orange), 3 (green), and 4 (purple).
The decrease in intensity of the 19F signal (Figure 3b) upon clicking the dye to the cyclooctyne is only observed for dendrimer conjugates. For small molecule click reactions between the MFCO click ligand and fluorescein in the absence of dendrimer, the peak shifts and broadens but does not decrease in intensity (Figure S6). Since the intensity decrease is unique to the dendrimer conjugates measured in both deuterated DMSO and water, it suggests this change arises from the clicked ligand being internalized into the dendrimer. Hydrophobic dyes can be hosted in the branches of a dendrimer,7,9,10,13 and it appears the addition of the fluorescein dye favors the fluorinated ligand to be internalized into the dendrimer. Disappearance of the fluorine signal of a small molecule upon encapsulation into a polyglycerol dendrimer has been previously reported.30 We also observe a decrease in the fluorine signal for clicked small molecules as a stoichiometric amount of the G5 PAMAM dendrimer is added to the solution (Figure S7) further supporting the encapsulation hypothesis. MALDI-TOF-MS measurements illustrate an overall increase in molecular weight as function ligand number n for both fluorescein and rhodamine dendrimer samples (Figure S1). The breadth of the molecular weight distribution for the G5 PAMAM polymer (Figure S2)31 limits the value of this approach for accurately determining the number of ligands present on each polymer particle. The defect structure of G5 PAMAM dendrimer results in molecular weight distribution ranging from ~21,000 to 28,000 Da. The click ligand-FC and TAMRA conjugates have a mass of 707 and 527, respectively. As discussed for the NMR analysis, the isolated fractions do not account for the full stochastic distribution of products and will therefore introduce error into attempts using mass spectrometry data to assign ligand/dendrimer ratios. In addition, MALDI-TOF-MS shot noise for these samples is 660 Da, which is similar to the ligand mass. For these reasons, MALDI-TOF-MS is of limited use in assigning numbers of ligand per particle. MALDI-TOF-MS was of greater use in characterizing precise ratio clusters of G5 PAMAM dendrimers where the mass shifts were ~30,000 Da.31 The precise ratio G5(G5)n dendrimer clusters were generated using the same precise ratio linker samples illustrated in Scheme 2.
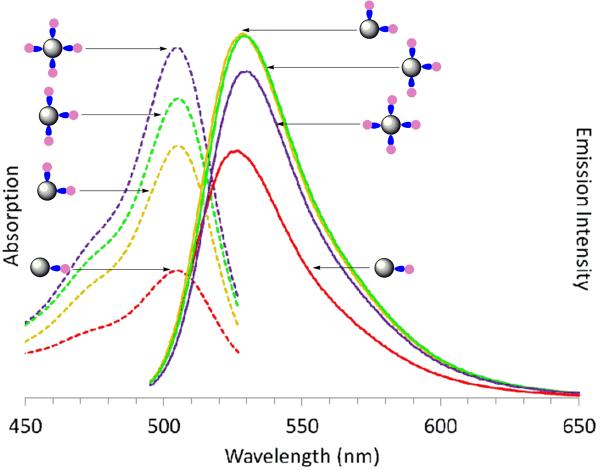
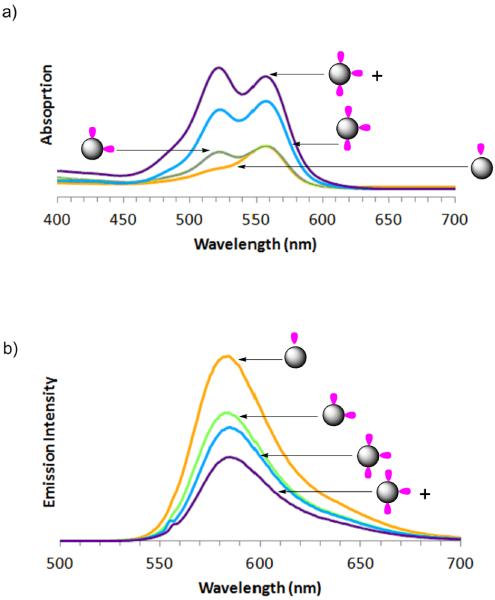
Both sets of precise dye/dendrimer ratio samples, G5-Ac-FCn (n = 1 – 4) and G5-Ac-TAMRAn (n = 1 – 3, 3+), were characterized in terms of absorption and fluorescent emission. Absorption spectra of G5-Ac-FCn show the anticipated increase in intensity at 491 nm associated with the fluorescein dye (Figure 4), although the extinction coefficient does not vary linearly with concentration (Table S4). This non-linearity is expected as these samples, although dilute in terms of polymer concentration, hold the conjugated dyes in close proximity to each other and therefore do not meet the criteria for Beer's Law in terms of local dye concentration. These samples of 0.1 mg/mL concentration of polymer correspond to approximately 1 × 10⁻⁶ M polymer and dye for G5-Ac-FCn where n = 1; however for n = 2, 3, and 4 the local concentration of dye is roughly 9, 13.5 and 18 M respectively. The emission spectra, centered at 526 nm, deviate even more strongly from a linear response as a function of n. The emission intensity of G5-Ac-FC3 and G5-Ac-FC2 are identical and the emission for G5-Ac-FC4 is less intense than that observed for n = 2 or 3. These observations belie the general strategy that placing more dye on a dendrimer will result in greater emission intensity. Absorption spectra of the G5-Ac-TAMRAn samples also deviate from a linear Beer's law response and exhibit a transition from monomer to dimer-like spectral bands that is consistent with the rhodamine small molecule absorption behavior reported as a function of concentration in solution (Figure 5a).32 The spectrum for G5-Ac-TAMRA1 is identical to that observed for unconjugated TAMRA at a dye concentration of 3.0 × 10⁻⁶ M, known to give a monomer absorption spectra. The spectrum for G5-Ac-TAMRA2 exhibits the increase in intensity at 520 nm associated the formation of TAMRA dimers and provides additional evidence that this sample contains a precise ratio of TAMRA/dendrimer particles as opposed to a stochastic distribution. Note the G5-Ac-TAMRA2 sample has a local dye concentration of about 9 M. This overall peak shape is also observed for G5-Ac-TAMRA3 and the 520 nm peak supersedes the 555 nm peak in intensity for the G5-Ac-TAMRA3+ sample. The fluorescence emission intensity shows an inverse relationship with the TAMRA/dendrimer ratio (Figure 5b).
Figure 4.
Absorption (dotted line) and Emission (solid line) spectra of precisely defined G5-Ac-FCn (n = 1 – 4) conjugates (0.1 mg/mL). Sample n= 1 fluorescein (red), 2 (orange), 3 (green), and 4 (purple).
Figure 5.
A) Absorption and b) Emission and spectra of precisely defined G5-Ac-TAMRAn (n = 1 – 3, 3+) conjugates (0.1 mg/mL).. Samples n= 1 TAMRA (orange), 2 (green), 3 (blue), and 3+ TAMRA (purple).
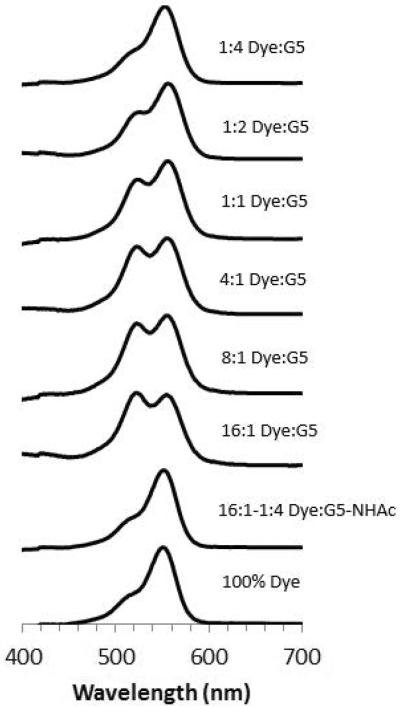
The absorption spectra of the G5-Ac-TAMRAn (n = 1 – 3, 3+) samples provide an opportunity to better understand the spectra obtained for fluorescent dye encapsulated in G5 dendrimer. By applying the data obtained from the absorption spectra of the precise ratio samples, we can better understand the physical encapsulation generated by physical mixing. A series of spectra are presented in Figure 6 at a constant dye concentration of 3.0 × 10⁻⁶ M in water, which would normally result in a monomer absorption signature,32 and the impact of dye encapsulation into the both G5-NH2 and G5-Ac dendrimer is illustrated. At a 16:1 TAMRA/G5-NH2 ratio, the 520 nm peak is more intense than the 550 nm peak, consistent with the conjugate containing 3+ TAMRA dye per dendrimer and an effective local dye concentration of > 14 M. The 8:1 and 4:1 TAMRA/G5-NH2 ratios have absorption peak shapes similar to the G5-Ac-TAMRA3 conjugate. Interestingly, for all three ratios measured ranging from 16:1 to 4:1 TAMRA/G5-NH2, the 550/520 nm peak ratio suggests little if any monomer TAMRA is present in solution. The 550/520 nm peak ratio for both the 1:1 and 1:2 TAMRA/G5-NH2 ratios indicate that species containing both 1 and 2 encapsulated dye/dendrimer exist in solution. The intensity of the 550 nm peak definitively indicates that neither the stoichiometric 1:1 ratio, nor even the case where there are two dendrimers for every dye, succeeds in generating a defined sample containing 1 dye encapsulated per dendrimer. Since the absorption behavior of the encapsulated one equivalent of TAMRA dye is different than the conjugated precisely defined material, this also agrees with the claim that precisely one dye is conjugated to the denrimer material previously discussed. It is not until a four-fold excess of dendrimer is employed that the dye absorption spectrum is consistent with that of monomer dye. The absorption data indicate that mixtures of TAMRA/G5-NH2 ratios are present even for the case of one dye per dendrimer. Therefore, similar to stochastic conjugation methods, physical encapsulation strategies also result in a mixture of small molecule-dendrimer ratios. Similar aggregation phenomena have been reported previously for the interaction of methylene blue with generations 1.5 to 7.5 PAMAM dendrimer terminated with carboxylic acid groups.11 For this case involving a positively charged dye and negatively charged dendrimer, monomer, dimer, and higher aggregates were observed. For the interaction of neutral G5-Ac with TAMRA, the absorption data for all ratios of TAMRA/G5-Ac, 16:1 to 1:4, only the monomer absorption was observed (Figure 6). This suggest that although it is favorable for TAMRA to intercalate into the G5-NH2 dendrimer for a water solution, intercalation into the G5-Ac dendrimer does not occur or is limited to a single dye. This difference is consistent with previous observations that amine-terminated PAMAM dendrimer in water is extended with available volume between the arms if solvent is displaced whereas acetylated PAMAM is a compact, condensed structure with little available volume.33
Figure 6.
Absorption spectra of 3.0 × 10⁻⁶ M TAMRA dye in water with varying amounts of G5-NH2 or G5-Ac added to solution. The TAMRA only absorbance (pink) is at a concentration where only monomer behavior is present. Once G5-NH2 dendrimer is added (light blue) the TAMRA becomes encapsulated and shows dimer absorption behavior. The monomer absorption behavior is not seen until a large excess of dendrimer has been added (light blue to dark blue). The addition of G5-Ac does not cause any change in the absorption over the range of 16:1 to 1:4 dye/G5-Ac ratios.
In order to better understand the trends in the absorption and emission spectra of the fluorescein samples, we also carried out fluorescence lifetime as well as quantum yield measurements. The fluorescence lifetime measurements were carried out with femtosecond fluorescence upconversion spectroscopy, which is very sensitive to small changes in the decay rates. The lifetime data suggests a two component decay with an initial short relaxation time on the order of ~15 ps and a longer decay of approximately ~200 ps (Table 1). In addition to this overall decay profile, the G5-Ac-FC1 and G5-Ac-FC2 samples have long decay components close to ~200 ps, while those for G5-Ac-FC3 and G5-Ac-FC4 appeared to have shorter decay components (~165 ps), albeit within the error the measurement. This possible difference between the G5-Ac-FC1/G5-Ac-FC2 and G5-Ac-FC3/G5-Ac-FC4 samples is also supported by a similar trend in the quantum yield. Combining these two results suggests that the decrease in the quantum yield observed for the G5-Ac-FC3 and G5-Ac-FC4 is related to the increased decay rate of these samples. Physically, the average distance between chromophores is becoming smaller in these samples and the possibility of chromophore-chromophore interactions and promotion of non-radiative pathways in the system is increased. This type of trend has been observed previously for chromophores stochastically attached to dendrimers where the increased loading of the chromphores on the surface of the dendrimer was not linear in terms of the quantum yield or fluorescence lifetime with number of chromophores.34–36 Attempts to obtain lifetime data for these TAMRA sample were unsuccessful due to poor overlap of the laser emission with the TAMRA absorption. Quantum yield data showed the expected decrease as the number of TARMA dyes per particle increased (Table S5).
Table 1.
Fluorescence lifetime kinetic data for G5-Ac-MFCO-FCn (n = 1 – 4) samples.
| # Fluoresceins per G5 | QY % | Short (ps) | Long (ps) | R2 |
|---|---|---|---|---|
| 1 | 21±2 | 13±2 | 199±40 | 0.94 |
| 2 | 20±1 | 14±1 | 188±19 | 0.98 |
| 3 | 13±1 | 15±1 | 166±21 | 0.99 |
| 4 | 14±1 | 11±1 | 155±9 | 0.99 |
| Fluorescein | 79 | 8.5±1.3 | 223±36 | 0.93 |
Conclusions
In summary, two approaches to the formation of G5 PAMAM samples containing precise dye/dendrimer ratios have been presented. The first approach, using direct separation based on dye hydrophobicity, generated a set of TAMRA containing dendrimer, G5-Ac-TAMRAn (n = 1 – 3, 3+). The second approach, using click chemistry strategy, generated a set of fluorescein containing dendrimer, G5-Ac-FCn (n = 1 – 4), using a method that could be readily extended to any azide-containing dye or other desired functional group. Both absorption and emission spectra show a strong dependence on the dye/dendrimer ratio.
Supplementary Material
Acknowledgements
C.A.D and M.M.B.H. would like to thank Dr. Chrys Wesdemiotis and Nadrah Alawani of the University of Akron for mass spectrometry advice. MMBH thanks the National Institutes of Health, National Institute of Biomedical Imaging and Bioengineering under award EB005028 for partial support of this research. SD thanks the National Institutes of Health-RCMI grant number 8G12MD007595-04 from the National Institute on Minority Health and Health Disparities and the Louisiana Cancer Research Consortium for partial support of this research.
ABBREVIATIONS
- G5 PAMAM
Generation 5 poly(amidoamine)
- MFCO
2,5-dioxopyrrolidin-1-yl-6-(1-fluorocycloocty-2-ynecarboxamido)hexanoate
Footnotes
Author Contributions C.A.D. performed synthesis, chromatography, mass spectrometry, and NMR experiments. The manuscript was written through contributions of all authors. J.C.F and C.A.D performed fluorescence experiments. C.A.D., J.C.F, M.A.V.D., T.G, J.M., S.D. and M.M.B.H designed experiments, interpreted data, and wrote the manuscript.
The authors declare no competing financial interest.
References
- (1).Mullen DG, Banaszak Holl MM. Heterogeneous ligand-nanoparticle distributions: a major obstacle to scientific understanding and commercial translation. Acc. Chem. Res. 2011;44:1135–1145. doi: 10.1021/ar1001389. [DOI] [PMC free article] [PubMed] [Google Scholar]
- (2).Mullen DG, Fang M, Desai A, Baker JR, Orr BG, Banaszak Holl MM. A Quantitative Assessment of Nanoparticle Ligand Distributions: Implications for Targeted Drug and Imaging Delivery in Dendrimer Conjugates. ACS Nano. 2010;4:657–670. doi: 10.1021/nn900999c. [DOI] [PMC free article] [PubMed] [Google Scholar]
- (3).Mullen DG, Desai AM, Waddell JN, Cheng XM, Kelly CV, McNerny DQ, Majoros IJ, Baker JR, Sander LM, Orr BG, Holl MMB. The implications of stochastic synthesis for the conjugation of functional groups to nanoparticles. Bioconjugate Chem. 2008;19:1748–1752. doi: 10.1021/bc8002106. [DOI] [PMC free article] [PubMed] [Google Scholar]
- (4).Roglin L, Lempens EHM, Meijer EW. A Synthetic “Tour de Force”: Well-Defined Multivalent and Multimodal Dendritic Structures for Biomedical Applications. Angew. Chem., Int. Ed. 2011;50:102–112. doi: 10.1002/anie.201003968. [DOI] [PubMed] [Google Scholar]
- (5).Mullen DG, Borgmeier EL, Fang M, McNerny DQ, Desai A, Baker JR, Orr BG, Holl MMB. Effect of Mass Transport in the Synthesis of Partially Acetylated Dendrimer: Implications for Functional Ligand-Nanoparticle Distributions. Macromolecules. 2010;43:6577–6587. doi: 10.1021/ma100663c. [DOI] [PMC free article] [PubMed] [Google Scholar]
- (6).Hakem IF, Leech AM, Johnson JD, Donahue SJ, Walker JP, Bockstaller MR. Understanding Ligand Distributions in Modified Particle and Particlelike Systems. Journal of the American Chemical Society. 2010;132:16593–16598. doi: 10.1021/ja107139c. [DOI] [PubMed] [Google Scholar]
- (7).Jansen JFGA, de Brabander-van der Berg EMM, Meijer EW. Encapsulation of guest molecules into a dendritic box. Science. 1994;266:1226–1229. doi: 10.1126/science.266.5188.1226. [DOI] [PubMed] [Google Scholar]
- (8).Bosman AW, Janssen HM, Meijer EW. About Dendrimers: Structure, Physical Properties, and Applications. Chem. Rev. 1999;99:1665–1688. doi: 10.1021/cr970069y. [DOI] [PubMed] [Google Scholar]
- (9).Schenning A, Peeters E, Meijer EW. Energy transfer in supramolecular assemblies of oligo(p-phenylene vinylene)s terminated poly(propylene imine) dendrimers. Journal of the American Chemical Society. 2000;122:4489–4495. [Google Scholar]
- (10).Balzani V, Ceroni P, Gestermann S, Gorka M, Kauffmann C, Vogtle F. Fluorescent guests hosted in fluorescent dendrimers. Tetrahedron. 2002;58:629–637. [Google Scholar]
- (11).Jockusch S, Turro NJ, Tomalia DA. Aggregation of Methylene Blue Adsorbed on Starburst Dendrimers. Macromolecules. 1995;28:7416–7418. [Google Scholar]
- (12).Puntoriero F, Ceroni P, Balzani V, Bergamini G, Vogtle F. Photoswitchable dendritic hosts: A dendrimer with peripheral azobenzene groups. Journal of the American Chemical Society. 2007;129:10714–10719. doi: 10.1021/ja070636r. [DOI] [PubMed] [Google Scholar]
- (13).Teobaldi G, Zerbetto F. Molecular dynamics of a dendrimer-dye guest-host system. Journal of the American Chemical Society. 2003;125:7388–7393. doi: 10.1021/ja027905s. [DOI] [PubMed] [Google Scholar]
- (14).Ornelas C, Lodescar R, Durandin A, Canary JW, Pennell R, Liebes LF, Weck M. Combining Aminocyanine Dyes with Polyamide Dendrons: A Promising Strategy for Imaging in the Near-Infrared Region. Chemistry-a European Journal. 2011;17:3619–3629. doi: 10.1002/chem.201002268. [DOI] [PubMed] [Google Scholar]
- (15).Ornelas C, Pennell R, Liebes LF, Weck M. Construction of a Well-Defined Multifunctional Dendrimer for Theranostics. Organic Letters. 2011;13:976–979. doi: 10.1021/ol103019z. [DOI] [PubMed] [Google Scholar]
- (16).Wangler C, Moldenhauer G, Saffrich R, Knapp EM, Beijer B, Schnolzer M, Wangler B, Eisenhut M, Haberkorn U, Mier W. PAMAM Structure-Based Multifunctional Fluorescent Conjugates for Improved Fluorescent Labelling of Biomacromolecules. Chemistry-a European Journal. 2008;14:8116–8130. doi: 10.1002/chem.200800328. [DOI] [PubMed] [Google Scholar]
- (17).Zill AT, Licha K, Haag R, Zimmerman SC. Synthesis and properties of fluorescent dyes conjugated to hyperbranched polyglycerols. New Journal of Chemistry. 2012;36:419–427. [Google Scholar]
- (18).McNerny DQ, Kukowska-Latallo JF, Mullen DG, Wallace JM, Desai AM, Shukla R, Huang BH, Holl MMB, Baker JR. RGD Dendron Bodies; Synthetic Avidity Agents with Defined and Potentially Interchangeable Effector Sites That Can Substitute for Antibodies. Bioconjugate Chem. 2009;20:1853–1859. doi: 10.1021/bc900217h. [DOI] [PMC free article] [PubMed] [Google Scholar]
- (19).Wang F, Tan WB, Zhang Y, Fan XP, Wang MQ. Luminescent nanomaterials for biological labelling. Nanotechnology. 2006;17:R1–R13. [Google Scholar]
- (20).Baker JR. Why I believe nanoparticles are crucial as a carrier for targeted drug delivery. Wiley Interdisciplinary Reviews-Nanomedicine and Nanobiotechnology. 2013;5:423–429. doi: 10.1002/wnan.1226. [DOI] [PubMed] [Google Scholar]
- (21).Kim Y, Kim SH, Tanyeri M, Katzenellenbogen JA, Schroeder CM. Dendrimer Probes for Enhanced Photostability and Localization in Fluorescence Imaging. Biophys. J. 2013;104:1566–1575. doi: 10.1016/j.bpj.2013.01.052. [DOI] [PMC free article] [PubMed] [Google Scholar]
- (22).Kukowska-Latallo JF, Bielinska AU, Johnson J, Spindler R, Tomalia DA, Baker JR. Efficient transfer of genetic material into mammalian cells using Starburst polyamidoamine dendrimers. Proc. Natl. Acad. Sci. U. S. A. 1996;93:4897–4902. doi: 10.1073/pnas.93.10.4897. [DOI] [PMC free article] [PubMed] [Google Scholar]
- (23).Haensler J, Szoka FC. Polyamidoamine Cascade Polymers Mediate Efficient Transfection of Cells in Culture. Bioconjugate Chem. 1993;4:372–379. doi: 10.1021/bc00023a012. [DOI] [PubMed] [Google Scholar]
- (24).Tang Y, Li YB, Wang B, Lin RY, van Dongen M, Zurcher DM, Gu XY, Holl MMB, Liu G, Qi R. Efficient in Vitro siRNA Delivery and Intramuscular Gene Silencing Using PEG-Modified PAMAM Dendrimers. Molecular Pharmaceutics. 2012;9:1812–1821. doi: 10.1021/mp3001364. [DOI] [PMC free article] [PubMed] [Google Scholar]
- (25).Mullen DG, Borgmeier EL, Desai A, van Dongen MA, Barash M, Cheng XM, Baker JR, Banaszak Holl MM. Isolation and Characterization of Dendrimer with Precise Numbers of Functional Groups. Chem. Eur. J. 2010;16:10675–10678. doi: 10.1002/chem.201001175. [DOI] [PMC free article] [PubMed] [Google Scholar]
- (26).van Dongen MA, Desai A, Orr BG, Baker JR, Banaszak Holl MM. Quantitative Analysis of Generation and Branch Defects in G5 Poly(amidoamine) Dendrimer. Polymer. 2013;54:4126–4133. doi: 10.1016/j.polymer.2013.05.062. [DOI] [PMC free article] [PubMed] [Google Scholar]
- (27).Salic A, Mitchison TJ. A chemical method for fast and sensitive detection of DNA synthesis in vivo. Proc. Natl. Acad. Sci. U. S. A. 2008;105:2415–2420. doi: 10.1073/pnas.0712168105. [DOI] [PMC free article] [PubMed] [Google Scholar]
- (28).Maciejewski AS, R. 1986;Vol. 35:59–69. [Google Scholar]
- (29).Varnavski OGI, T. Chem. Phys. Lett. 2000;320:688–696. [Google Scholar]
- (30).Lee H, Ooya T. F-19-NMR, H-1-NMR, and Fluorescence Studies of Interaction between 5-Fluorouracil and Polyglycerol Dendrimers. J. Phys. Chem B. 2012;116:12263–12267. doi: 10.1021/jp307710b. [DOI] [PubMed] [Google Scholar]
- (31).van Dongen MA, Vaidyanathan S, Banaszak Holl MM. PAMAM Dendrimers as Quantized Building Blocks for Novel Nanostructures. Soft Matter. 2013;9:11188–11196. doi: 10.1039/C3SM52250D. [DOI] [PMC free article] [PubMed] [Google Scholar]
- (32).Selwyn JE, Steinfeld JI. Aggregation Equilibria of Xanthene Dyes. J. Phys. Chem. 1972;76:762–774. [Google Scholar]
- (33).Kelly CV, Leroueil PR, Nett EK, Wereszczynski JM, Baker JR, Orr BG, Holl MMB, Andricioaei I. Poly(amidoamine) dendrimers on lipid bilayers I: Free energy and conformation of binding. J. Phys. Chem B. 2008;112:9337–9345. doi: 10.1021/jp801377a. [DOI] [PMC free article] [PubMed] [Google Scholar]
- (34).Wang Y, Xie XB, Goodson T. Enhanced third-order nonlinear optical properties in dendrimer-metal nanocomposites. Nano Lett. 2005;5:2379–2384. doi: 10.1021/nl051402d. [DOI] [PubMed] [Google Scholar]
- (35).Goodson TG. Optical excitations in organic dendrimers investigated by time-resolved and nonlinear optical spectroscopy. Acc. Chem. Res. 2005;38:99–107. doi: 10.1021/ar020247w. [DOI] [PubMed] [Google Scholar]
- (36).Cho MJ, Choi DH, Sullivan PA, Akelaitis AJP, Dalton LR. Recent progress in second-order nonlinear optical polymers and dendrimers. Progress in Polymer Science. 2008;33:1013–1058. [Google Scholar]
Associated Data
This section collects any data citations, data availability statements, or supplementary materials included in this article.


