

Abstract
The aim of this study is to investigate whether different spatial perfusion-deficit patterns, which indicate differing compensatory mechanisms, can be recognized and used to predict recanalization success of intravenous fibrinolytic therapy in acute stroke patients. Twenty-seven acute stroke data sets acquired within 6 hours from symptom onset including diffusion- (DWI) and perfusion-weighted magnetic resonance (MR) imaging (PWI) were analyzed and dichotomized regarding recanalization outcome using time-of-flight follow-up data sets. The DWI data sets were used for calculation of apparent diffusion coefficient (ADC) maps and subsequent infarct core segmentation. A patient-individual three-dimensional (3D) shell model was generated based on the segmentation and used for spatial analysis of the ADC as well as cerebral blood volume (CBV), cerebral blood flow, time to peak (TTP), and mean transit time (MTT) parameters derived from PWI. Skewness, kurtosis, area under the curve, and slope were calculated for each parameter curve and used for classification (recanalized/nonrecanalized) using a LogitBoost Alternating Decision Tree (LAD Tree). The LAD tree optimization revealed that only ADC skewness, CBV kurtosis, and MTT kurtosis are required for best possible prediction of recanalization success with a precision of 85%. Our results suggest that the propensity for macrovascular recanalization after intravenous fibrinolytic therapy depends not only on clot properties but also on distal microvascular bed perfusion. The 3D approach for characterization of perfusion parameters seems promising for further research.
Keywords: brain imaging, cerebral ischemia, diffusion imaging, magnetic resonance imaging, perfusion imaging, stroke
Introduction
Multiparametric magnetic resonance imaging (MRI) is nowadays widely established in the clinical routine for the diagnosis of acute ischemic stroke. Here, especially diffusion-weighted imaging (DWI) and perfusion-weighted imaging (PWI) are commonly used in acute ischemic stroke to identify the ischemic core and tissue-at-risk of infarction.1, 2, 3, 4 The irreversible damaged brain tissue, which exhibits a severe diffusion restriction (DR), is typically identified in the apparent diffusion coefficient (ADC) map derived from DWI data sets. Perfusion-weighted imaging allows identifying hypoperfused tissue, which may be already infarcted or exhibit an increased risk for infarction. Therefore, the volumetric mismatch between the lesions identified in DWI and PWI data sets is typically assumed to represent the tissue-at-risk and therapeutic target.5, 6 The area of perfusion deficit has been identified in multiple studies using different perfusion parameters such as prolonged mean transit time (MTT), prolonged time to peak (TTP), or a decrease in cerebral blood volume (CBV) and cerebral blood flow (CBF) together with different thresholds of these perfusion parameters.7, 8, 9 However, previous studies showed that the severity of perfusion impairment is not consistent within the penumbra.10, 11, 12 More precisely, there are different levels of perfusion impairment within the hypoperfused area of brain tissue indicating differing compensatory mechanisms resulting in altering tissue vulnerability and response to hypoperfusion, e.g., due to sufficiency of collateral circulation situation.13 Nevertheless, therapy decisions still rely on the identification of ischemic core and penumbra by certain thresholds without considering the distribution of severity of perfusion impairment, i.e., regional differences or changes in severity of hypoperfusion throughout the ischemic region. Apart from this, it is known that recanalization of the occluded vessel after the administration of intravenous thrombolytic therapy is not successful in all patients. Success of reperfusion after the application of intravenous thrombolytic therapy may also depend on different variables such as the collateral situation and distribution of perfusion impairment and, thus, the pathway of the fibrinolytic agent throughout the infarct region,13 and not only on absolute values of perfusion impairment as a measure of severity. A number of previous studies aimed at analyzing the ischemic region based on thresholds or visual inspection while the spatial anatomy of perfusion impairment has not attracted much attention yet.14, 15, 16
The aim of this work is to analyze the spatial centrifugal distribution of diffusion and perfusion impairment from ischemic core into the periphery of the ischemic region using ADC values and different perfusion parameters. We hypothesized that different patterns of spatial distribution of the perfusion deficit distribution in the vicinity of the ischemic core can be recognized reflecting a different extent or possibly different mechanisms of compensatory collateral flow. We further hypothesize that successful recanalization after the administration of intravenous thrombolytic therapy is not only dependent on the absolute value of perfusion impairment but also on the spatial distribution of perfusion deficit within the irreversibly injured tissue and the tissue-at-risk of later infarction.
Materials and methods
Patients and Magnetic Resonance Imaging
From a database with 205 MRIs of acute stroke patients, acquired between 2006 and 2010, consecutive data sets were selected, which fulfilled the following criteria: complete MRI stroke protocol acquired within 6 hours of symptom onset (day 0), including DWI and PWI data sets, and a follow-up (FU) examination acquired within 1 day thereafter (day 1) including a time-of-flight (TOF) MR angiography for evaluation of recanalization.
To provide homogenous pathophysiological condition, only patients with occlusion and resulting acute cerebral ischemia in the territory of the middle cerebral artery (MCA) who were treated by intravenous thrombolytic therapy with recombinant tissue plasminogen activator were included in this study. The study was approved by the local Ethics Committee of the Ärztekammer Hamburg and followed the Helsinki guidelines for Human experiments. Patients or their guardians provided written informed consent.
All MRI measurements were performed on a 1.5-T Sonata Scanner (Siemens, Erlangen, Germany). The PWI data sets were acquired after application of contrast agent (∼15 mL of Bayer Magnevist) using a gradient-echo echo-planar-imaging sequence with repetition time=1,500 ms, TE=37 ms, flip angle=90°, field of view=240 × 240 mm2, matrix 256 × 256, 18 slices, and 6.5 mm slice thickness.
A single-shot, spin-echo, echo-planar-imaging sequence with repetition time=2,600 ms, TE=77 ms, flip angle=90°, field of view=240 × 240 mm2, matrix 256 × 256, 20 slices, and 6.5 mm slice thickness was used for DWI image acquisition using b values of 0, 500, and 1,000 s/mm2.
Single slab TOF MR angiography was obtained by a three-dimensional (3D) FISP sequence with venous saturation, MTS (magnetization transfer saturation) pulse and TONE-up pulse with repetition time=36 ms, TE=6 ms, flip angle=25°, field of view=230 × 170 mm2, matrix 512 × 384, 72 slices, and 0.8 mm slice thickness.
Image Preparation
In a first step, the signal values S(t) of the raw PWI images were converted into concentration time curves C(t) in a voxelwise manner using the following equation:
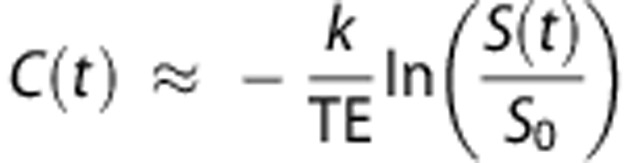 |
where S0 denotes the baseline MR signal intensity, TE the echo time, and k a proportionality constant.
After conversion into concentration time curves, an arterial input function was selected from the contralateral unaffected MCA and used for calculation of perfusion parameter maps. Here, maps for different perfusion parameters including CBV, CBF, MTT, and TTP were calculated using the software given by the vendor (dynamic susceptibility contrast-MRI bolus tracking method; model-independent method singular value decomposition17).
Furthermore, ADC images were calculated based on the three DWI images obtained for the different b values. For this purpose, a voxel-by-voxel least-squares fit of was employed
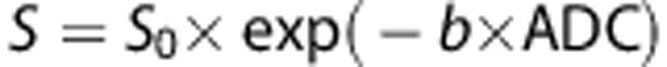 |
where S0 describes the baseline signal.
A complete data set of an individual patient consisted of the ADC, MTT, TTP, CBV, and CBF maps as well as a TOF angiography at day 0 and day 1.
Perfusion maps were first registered intraindividually to the corresponding ADC map to assure an optimal 3D comparison of corresponding tissues between the modalities. Therefore, the first time point of the raw PWI data set was registered to the corresponding b=0 DWI data set by optimizing the rigid transformation ϕrigidPWI by maximization of the mutual information metric. In a second step, the b=0 DWI data set was registered to the 1-mm3 Montreal Neurological Institute (MNI) brain atlas by optimizing the rigid transformation ϕaffineDWI by maximization of the mutual information metric. After registration, the ADC parameter map was transformed for each patient to the MNI atlas using the affine transformation ϕaffineDWI and a cubic interpolation. Likewise, the four calculated perfusion parameter maps were also transformed to the MNI brain atlas using a merged transformation ϕrigidPWI+ϕaffineDWI (rigid PWI and affine DWI transformation) and cubic interpolation.
The transformation to MNI space results not only in an interpolated (1 mm3) isotropic spatial resolution of the parameter maps but also allows the definition of corresponding voxels in the ipsi- and contralateral hemisphere. This is required to obtain relative perfusion maps in terms of calculating the quotient: ipsilateral/contralateral (qCBF and qCBV) for CBF and CBV maps and the difference: ipsilateral–contralateral (dMTT and dTTP) in case of the MTT and TTP maps, which is necessary to correct for different perfusion properties in different brain tissues in the following analysis.
Time-Of-Flight Reading
The acute TOF and TOF of day 1 were independently rated with respect to recanalization by an experienced neuroradiologist applying the thrombolysis in cerebral infarction (TICI) perfusion categories.18 Recanalization was defined as TOF at day 1 if there was recanalization with remaining mild stenosis or normal arterial caliber (TICI 2 and 3). In addition, patients were dichotomized according to recanalization information (i.e., nonrecanalized group (non-recan)=TICI 0 and 1 and recanalized group (recan)=TICI 2 and 3).
Region of Interest and Voxel of Interest Definition
After preprocessing, the area of decreased ADC (DR) was semiautomatically segmented in the ADC image sequence. Therefore, a seed point was manually placed in the lesion and applied for 3D volume growing using a fixed upper threshold of 550 × 10−6 mm2/s. Manual correction of the resulting segmentation was performed hereafter in the orthogonal slices in case of leakage of the segmentation into noninfarct areas. In a second step, a brain segmentation method19 adapted to ADC image sequences was performed for exclusion of noncerebral tissue. Finally, voxels representing cerebrospinal fluid (CSF) were segmented in the ADC image sequence using global lower threshold of 1,050 × 10−6 mm2/s (Figure 1). The brain mask was then refined by excluding voxels that were part of the CSF segmentation and mirrored CSF segmentation. The exclusion of voxels part of the mirrored CSF segmentation is necessary to prevent calculation of erroneous quotients (qCBV and qCBF) or differences (dMTT and dTTP) of the perfusion maps.
Figure 1.

Apparent diffusion coefficient (ADC) map (left) and the corresponding segmentations with diffusion restriction (DR) lesion (red) and calculated three-dimensional (3D) shell model evolving around the ADC lesion (green).
The segmented lesion was then used for lesion volume quantification as well as for the analysis of perfusion and diffusion properties in the vicinity of the lesion in the style of the segment model proposed by Fiehler et al.20 For this purpose, the Euclidean distance map was calculated based on the segmented lesion using the method proposed by Danielsson.21 Using this approach, an image is generated assigning a value to every voxel representing the distance to the nearest segmented lesion voxel with the approximation to the Euclidean distance. This distance map was then used to calculate 15 concentric shells with a thickness of 4 mm with increasing distance to the stroke lesion using iterative thresholding. Finally, voxels that are located in the contralateral hemisphere were excluded from the shell model such that only voxels part of the ipsilateral hemisphere are analyzed in the following step (Figure 1).
The shell model was built around the ischemic core defined by the thresholded area of DR. This approach was chosen since spatial changes in perfusion deficit due to a potential collateral circulation can be mainly expected in the vicinity of the ischemic core.
Statistics
This 3D shell model was then used for analysis of the ADC and relative perfusion values in terms of calculating an average value for each shell and parameter, whereas only voxels within the CSF-corrected brain segmentation were included for this measurement. Relative values for perfusion parameters were compared within each shell between recanalized and nonrecanalized group using Fisher's test.22
Since the aim of this study was to analyze the spatial distribution of perfusion parameters in terms of curve characteristics instead of only using absolute values, the resulting curves of each parameter (ADC, qCBV, qCBF, dMTT, and dTTP) were then used for calculation of the corresponding skewness, kurtosis, area under the curve, and slope, which was approximated by linear regression, for each patient. For calculation of the higher order moments, the curves representing the average value for each shell with increasing distance to the infarct core were analyzed separately for each diffusion/perfusion parameter. These 20 statistical moment parameters together with the lesion volume were then employed for training and classification into one of the two groups (recanalized versus nonrecanalized) of the data sets using a LogitBoost Alternating Decision Tree (LAD Tree) classification.23 Tenfold cross-validations were performed for evaluation of the classification precision. For selection of the parameters that have a positive influence on the classification results and are, therefore, really required, the cross-validation was performed repeatedly by removing parameters until the optimal subset was identified.
Results
In total, 27 patient data sets fulfilled the inclusion criteria. The mean patient age was 66±13 years (mean±s.d.), and ages ranged from 38 to 83 years. The right hemisphere was affected in 12 patients while 15 patients showed an infarction in the left hemisphere. The interval between symptom onset and acute MRI was 166±77 minutes (mean±s.d.).
In the evaluation of MR angiography data, occlusion of the MCA trunk was seen in 18 patients, occlusion of the MCA trifurcation was seen in 4 patients, and occlusion of an MCA branch in 5 patients (Table 1).
Table 1. Patient characteristics of recanalization and nonrecanalization group.
|
Grouping |
||
|---|---|---|
| Recan | Non-recan | |
| Total number | 16 | 11 |
| Age (years) | ||
| Mean | 68 | 68 |
| s.d. | 12 | 12 |
| Sex | ||
| Male | 9 | 6 |
| Female | 7 | 5 |
| Infarct side | ||
| Right | 8 | 4 |
| Left | 8 | 7 |
| Time (minutes) | ||
| Mean | 165 | 168 |
| s.d. | 62 | 91 |
| MCA occlusion site | ||
| Trunk | 12 | 6 |
| Trifurcation | 2 | 2 |
| Branch | 2 | 3 |
Patients age (mean and standard deviation (s.d.)), sex, infarct side, time from symptom onset (mean and s.d.), and vessel occlusion site in media cerebral artery (MCA) territory (trunk, trifurcation, and branch) for recanalized (recan) and nonrecanalized (non-recan) group.
Follow-up TOF showed recanalization in 16 patients, while no successful recanalization was observed in 11 patients (Table 1). More precisely, 8 patients showed no recanalization (TICI 0), 3 patients showed minimal recanalization (TICI 1) in FU TOF, while 4 patients presented with partial (TICI 2), and 12 patients with full recanalization (TICI 3) in FU TOF scan. In our patient group, successful recanalization was not dependent on occlusion type or time from symptom onset.
Apparent Diffusion Coefficient
Mean ADC values for both patient groups showed an overall increase from center to periphery of the infarct lesion, reaching a plateau in the recanalized group in the third shell and in the nonrecanalized group more peripherally in the fifth shell. Apparent diffusion coefficient values in both groups presented a rather steep increase within the first two shells and then further but less steep increase up to segment nine and ten, respectively. There was no significant difference in absolute ADC values between both groups within any of the shells (Figures 2E and 2F).
Figure 2.

Relative values of perfusion parameters such as (A) cerebral blood volume (CBV), (B) cerebral blood flow (CBF), (C) mean transit time (MTT), and (D) time to peak (TTP) as well as (E) apparent diffusion coefficient (ADC) displayed for each patient group (recanalized group (recan) and nonrecanalized group (non-recan) within each segment from center (segment 1) to periphery (segment 15) of the three-dimensional shell model). Mean relative values of perfusion parameters and ADC for all patients (F).
Mean Transit Time
In comparison, mean dMTT values showed a clear increase in the first two shells with maximum difference of 4.5 seconds in shell 2 and then decreased almost linearly toward the periphery with each shell. Both groups reached the dMTT maximum difference in shell 2 but patients with no recanalization presented a steeper increase within the first two shells and reached a lower maximum of 5.25 seconds in comparison with the maximum of the recanalized group with 4.7 seconds (Figures 2C and 2F). With increasing distance from the ischemic core both groups showed a similar continuous, almost linear decrease in dMTT values while the curve of the nonrecanalized group showed a slightly steeper decrease between shells 2 and 7 after reaching the maximum dMTT value. When comparing both groups, mean dMTT values in recanalization group were above those derived from nonrecanalization group within the first two shells, distal dMTT values in recanalization group appeared higher than in nonrecanalization group in all segments, nevertheless the difference was not significant.
Time to Peak
The dTTP values for both groups were highest within the inner shells, without significant difference between groups and then showed a continuous, almost parallel decrease with each segment toward the periphery for both groups (Figures 2D and 2F).
Cerebral Blood Volume
Distribution and magnitude of qCBV values for both groups was almost identical within the first three shells. In more outer shells, recanalized group values were slightly above values in the nonrecanalized group in most segments, but without significant difference of absolute values in any shells (Figures 2A and 2F).
Cerebral Blood Flow
The qCBF values in both groups were lowest closest to the ischemic core and presented a rather steep increase within the first three shells, which was steeper in the nonrecanalized group in comparison with the slope of the recanalized group curve in these segments. The values in both groups showed a slighter but continuous increase until they reached a plateau at shell 14. In all shells, recanalized group values were slightly above nonrecanalized group values but also without significant differences in relative values (Figures 2B and 2F).
Comparison of Spatial Distribution of Perfusion Parameter Mean Values
Absolute ADC values were decreased in the vicinity of the ischemic core and increased rather steeply to the periphery within the first shells while TTP and MTT delay was decreasing slowly from ischemic core toward the periphery. Cerebral blood volume values were markedly decreased closely to the ischemic core correlating with the region of severe ADC decrease but showed a continuous increase toward the periphery and, in comparison with CBF, even further above normal values, reaching values up to 1.8 times higher than those values derived from the unaffected hemisphere. Cerebral blood flow values also increased from ischemic core to periphery but reached normal values in more peripheral shells compared with CBV and ADC (Figure 2F).
Analysis of Relative Values
When comparing values for ADC, dTTP, dMTT, qCBV, and qCBV between recanalized and nonrecanalized group there was no significant difference found for any of the shells.
LogitBoost Alternating Decision Tree Classification
The evaluation of the 21 parameters initially used for LAD Tree classification by repeatedly removing parameters from the classification revealed that only 3 parameters were required for the best possible prediction of a successful recanalization. These parameters were ADC skewness, qCBV kurtosis, and dMTT kurtosis (Table 2). The tenfold cross-validation using these parameters revealed that the LAD Tree classification was able to predict a successful recanalization with a mean precision of 85% (22 of the 26 data sets were correctly classified). The incorrectly classified data sets could be separated into two false positives and two false negatives such that the classification was able to predict a recanalization with a sensitivity of 0.82 and a specificity of 0.87. Absolute values for recanalized and nonrecanalized group for ADC skewness, CBV kurtosis, and MTT kurtosis are displayed in Table 2.
Table 2. Curve characteristics of perfusion parameters.
| Nonrecanalized | Recanalized | t-test | |
|---|---|---|---|
| ADC skewness | −2.09+−0.56 | −2.35+−0.73 | 0.323 |
| qCBV kurtosis | 1.34+−1.515 | 0.083+−1.16 | 0.024 |
| dMTT kurtosis | 0.091+−1.072 | 1.142+−3.05 | 0.287 |
ADC, apparent diffusion coefficient; CBV, cerebral blood volume; qCBV, quotient CBV; MTT, mean transit time; dMTT, difference MTT.
Absolute values (±standard deviation) of ADC skewness, CBV kurtosis and MTT kurtosis for recanalized and nonrecanalized group.
Discussion
It is known that the area of perfusion deficit in acute ischemic stroke consists of inhomogeneous degree of perfusion impairment with resulting differing hemodynamic and metabolic responses throughout the area of hypoperfusion. A recent study suggested that a normalized index derived from Tmax maps calculated from MR-PWI data might be a predictor of full MCA-M1 recanalization in patients treated with IV thrombolysis.24 Nevertheless, PET studies have shown that there are differences regarding the stages of compensation throughout the whole area that is generally defined as ischemic penumbra by the PWI-DWI mismatch criterion.25 Until now, these regional differences are not taken into account in most studies when analyzing the penumbra and only minor attention has been devoted to the distribution of perfusion impairment rather than to the mere severity measured by absolute or relative values in perfusion parameter maps. We chose a different approach in this study and analyzed the area of hypoperfusion in the area of perfusion-diffusion mismatch surrounding the ischemic core as a three-dimensional shell model to account for regional changes in hypoperfusion and DR. Absolute ADC values were decreased in the vicinity of the ischemic core and increased rather steeply to the periphery within the first shells. This behavior of ADC values is in concordance with other studies that showed comparably low ADC values within the ischemic core, which increases slightly toward the ADC lesion boundaries.1, 26, 27 In line with reports from other studies, we also found a decreasing TTP and MTT delay from ischemic core toward the periphery, representing severe hypoperfusion in penumbral region close to the ischemic core in contrast to areas of benign oligemia in the periphery.2, 11, 28 Cerebral blood volume values were markedly decreased closely to the ischemic core represented by the region of severe ADC decrease but showed a continuous increase toward the periphery and even further above normal values, reaching values up to 1.8 times higher than those values derived from the unaffected hemisphere. Therefore, in comparison with CBF, in our study CBV values seemed to increase even further toward the periphery. These observations are also in line with other studies reporting increased CBV values within the penumbra and oligemia zone29 and decreased CBV values slightly exceeding the ADC lesion in the hyperacute phase within the ischemic core.27, 30, 31 These elevated CBV values in the ischemic penumbra are known from PET studies to show decreased cerebral perfusion pressure producing vasodilation, especially in tissue supplied by collateral flow and therefore an compensatory increase in the CBV to maintain constant CBF and OEF (oxygen extraction fraction) in early stages of ischemia.29, 32, 33 These parameters represent autoregulatory vasodilatation and collateral circulation playing an important role in maintaining the viability of ischemic tissue.34, 35 Nevertheless, if cerebral perfusion pressure further decreases, then the compensatory vasodilation reaches maximum and CBF begins to decrease, which seems to be the case toward the infarct center. The relative values for CBV and CBF measured in the ischemic core are in concordance with those reported from other studies.29, 36 In our study, CBF values also increased from ischemic core to periphery and reached normal values in more peripheral shells compared with CBV and ADC. The CBF increase in the periphery may be also ascribed to compensatory mechanisms and increased flow in small vessels. These findings are also in line with other studies reporting the area of CBF decrease to exceed the area of CBV and ADC decrease.37
The extent of the penumbra as well as the vulnerability of brain tissue to infarction in case of persistent vessel occlusion or with successful recanalization depends on many factors.
In MR perfusion imaging of stroke patients, the imaging technique mainly relies on the passage of contrast medium through the brain via collateral pathways in case of vessel occlusion and reflects characteristics of both the macrocirculation and the microcirculation. Therefore, calculated perfusion parameters like TTP, MTT, CBV, and CBF indirectly represent the status of the collateral situation. However, the definition of absolute thresholds for effective versus ineffective collateral perfusion is critical, because they are time dependent, shows an interindividual variability, and can be altered by treatment.12 However, it is known that the response to thrombolytic therapy is strongly related to the presence or absence of collateral flow.38
Within this study we, therefore, aimed to test whether the spatial distribution of perfusion and diffusion parameters might help to identify patients with higher chances of successful treatment and with this predict recanalization. Our results suggest that not absolute values but certain curve characteristics of ADC, MTT, and CBV might have an influence on chance of recanalization. In addition, we did not find significant differences in relative values of perfusion parameters between the two groups. According to our results, recanalization showed a dependency on spatial distribution of different perfusion parameters, such as CBV kurtosis and MTT kurtosis, rather than on absolute values.
Mean transit time kurtosis is a parameter indicating the ‘bulging' of the MTT curve, representing the distribution of this parameter from infarct center toward the periphery. Higher MTT kurtosis might therefore indicate that the area of most severe prolongation of MTT is spatially more concentrated and, therefore, restricted to a smaller area (fewer shells) surrounding the ischemic core, even with higher absolute MTT values. These parameter characteristics might be pathophysiologically related to a longer possible contact time of thrombolytic agent with the thrombus resulting in higher chances of dissolving the clot. In addition, a prolonged MTT in the vicinity of the ischemic core and throughout the periphery might be indicative of less adverse pressure giving higher chances for clot fragments in the periphery to dissolve. In contrast to this finding, CBV kurtosis was lower in recanalizing patients, who showed overall higher CBV values, indicating a positive effect of wider distribution of CBV values and overall higher values corresponding to more effective collateral supply. Furthermore, ADC skewness, representing the asymmetry of the spatial distribution of this parameter, indicated a continuous increase in ADC values from lowest values within the lesion center toward the periphery already beginning in the first shells. In comparison, a lower ADC skewness indicated a similar increase in ADC values but starting more peripheral and with a much steeper slope. Pathophysiologically, these curve characteristics represent a positive effect of a slight but continuous increase in ADC values already closely to the ischemic core, which is also an indirect indicator of sufficient collateral circulation limiting lowest ADC values only to the ischemic core. Nevertheless, the optimal prediction of recanalization within the LAD tree classification was only possible considering a combination of all three parameter characteristics.
An explanation for these findings might be that the collateral circulation is a critical determinant of cerebral perfusion pressure in acute cerebral ischemia. The hemodynamic effects of the collateral circulation may be important in maintaining perfusion to penumbral regions, but these collateral vessels may also facilitate clearance of fragmented thrombus from more proximal locations.39, 40 Previous findings suggest that intracerebral clots dissolve spontaneously in a relatively short period of time, but that fragments formed from the clot may obstruct more distal blood vessels.39 It is, therefore, more likely that clot fragments accumulate and stay in arteries with lower blood flow and poor collateral perfusion, where they continue to cause ischemia for a longer duration. Also, distal fragmentation of a thrombus within the parent vessel may occlude distal branches supplying retrograde collateral flow from cortical arteries. These changes might be represented by spatial distribution of perfusion and diffusion parameters. Successful recanalization is not only dependent on the mere administration of tissue plasminogen activator but might also depend on the supply of collateral vasculature and, therefore, the amount of thrombolytic agent that reaches the thrombus not only via the regular pathway but also from the opposite side of the thrombus. Thus, the propensity for macrovascular recanalization seems to be dependent not only on the clot properties but also on perfusion conditions in the distal microvascular bed.
A limitation of our study is that the model we applied measured values of different perfusion parameters in a three-dimensional model surrounding the ischemic core represented by the area of severest ADC decrease. Nevertheless, the ADC lesion does not necessarily need to be in the middle of the infarct or hypoperfused area. Therefore, values surrounding the ADC lesion are mean values over all shells within a segment. Accordingly, parameter values might still be different on one side of the ADC lesion versus the opposite side. In addition to this, shells around the ischemic core or as represented by the ADC lesion do not follow the extent of the perfusion deficit, which does not evolve in a symmetric shelllike model around the ischemic core. Nevertheless, vessel occlusion in one territory also affects the adjacent brain regions due to collaterals circulation and we find this method a promising approach to determine perfusion changes in the vicinity of the ischemic core and throughout the affected hemisphere.
Moreover, acute ischemic stroke is a dynamic process, but the perfusion measurements studied here represent only one single time point, while patients were studied at different time points from symptom onset, even though all patients were scanned within a 6-hour time window. Therefore, with our data it is not possible to detect slight and very early changes within the first 6 hours. Our data represent an average for patients within the first 6 hours after symptom onset in the acute period. Therefore, for each patient only one data set from a single time point is available even though a dynamic process was evaluated. Nevertheless, it would be impossible to scan patients successively within the early acute stroke phase. Another limitation of our study is that in patients with recanalization, the exact time point of recanalization is unknown since vessel occlusion status was not assessed or monitored continuously by any means but rather late after 24 hours.
The classification model used in this study requires the previous calculation of higher order moments (skewness and kurtosis) based on the diffusion and perfusion parameter curves. Due to the fact that higher order moments are known to be sensitive to noise, we also evaluated the classification accuracy of the proposed model after adding 10% Gaussian distributed noise to the parameter maps before postprocessing. The result of this was that 85% of the patients are still classified correctly with the same false positives and false negatives. This finding can be ascribed to the fact that numerous voxels are used for calculation of an average shell value such that systematic noise contributions are averaged out.
Another limitation of this study is that the 3D shell model is defined by the distance to the infarct core regardless of the direction. However, the PWI and DWI data sets used in this study are acquired with a slice thickness of 6.5 mm and in-plane spatial resolution of 0.94 mm2. Thus, the actual location of the slices may also influence the parameter curves due to the comparable larger slice thickness. This limitation was partly solved in this work by the registration of the parameter maps to the 1-mm3 MNI brain atlas using a cubic interpolation. However, the interpolation result may still not display an optimal representation of the reality.
Even though our findings are based on differences in curve shape evaluated by a classification algorithm while there was no significant difference when comparing the absolute values of ADC skewness and MTT kurtosis. Still, there is a clear tendency of absolute difference visible in the curve plots when comparing recanalization and nonrecanalization groups. Nevertheless, the main goal of this study was to develop a geometrical model that could predict recanalization by only including parameters describing curve characteristics instead of relying on absolute values derived from perfusion and diffusion data. Therefore even though the interpretation of our data is only preliminary and certainly needs further study, the 3D approach for evaluation of perfusion parameters in ischemic stroke seems promising.
Summary
Our results suggest that patients with and without later recanalization of the same large artery occlusion site exhibit different spatial distributions of microvascular perfusion impairment and DR from ischemic core to periphery. The propensity for macrovascular recanalization after intravenous fibrinolytic therapy seems to be dependent not only on clot properties but also on perfusion conditions in the distal microvascular bed. The 3D approach for characterization perfusion parameters as used in this paper seems promising for further research.
The authors declare no conflict of interest.
References
- Fiehler J, Kucinski T, Knudsen K, Rosenkranz M, Thomalla G, Weiller C, et al. Are there time-dependent differences in diffusion and perfusion within the first 6 hours after stroke onset. Stroke. 2004;35:2099–2104. doi: 10.1161/01.STR.0000138450.15078.b5. [DOI] [PubMed] [Google Scholar]
- Fiehler J, Knab R, Reichenbach JR, Fitzek C, Weiller C, Röther J. Apparent diffusion coefficient decreases and magnetic resonance imaging perfusion parameters are associated in ischemic tissue of acute stroke patients. J Cereb Blood Flow Metab. 2001;21:577–584. doi: 10.1097/00004647-200105000-00012. [DOI] [PubMed] [Google Scholar]
- Rother J, Schellinger PD, Gass A, Siebler M, Villringer A, Fiebach JB, et al. Effect of intravenous thrombolysis on MRI parameters and functional outcome in acute stroke <6 hours. Stroke. 2002;33:2438–2445. doi: 10.1161/01.str.0000030109.12281.23. [DOI] [PubMed] [Google Scholar]
- Hacke W, Furlan AJ, Al-Rawi Y, Davalos A, Fiebach JB, Gruber F, et al. Intravenous desmoteplase in patients with acute ischaemic stroke selected by MRI perfusion-diffusion weighted imaging or perfusion CT (DIAS-2): a prospective, randomised, double-blind, placebo-controlled study. Lancet Neurol. 2009;8:141–150. doi: 10.1016/S1474-4422(08)70267-9. [DOI] [PMC free article] [PubMed] [Google Scholar]
- Warach S. Measurement of the ischemic penumbra with MRI: It's about time. Stroke. 2003;34:2533–2534. doi: 10.1161/01.STR.0000092395.19554.9A. [DOI] [PubMed] [Google Scholar]
- Schaefer P, Barak E, Kamalian S, Gharai L, Schwamm L, Gonzalez R, et al. Quantitative assessment of core/penumbra mismatch in acute stroke: CT and MR perfusion imaging are strongly correlated when sufficient brain volume is imaged. Stroke. 2008;39:2986–2992. doi: 10.1161/STROKEAHA.107.513358. [DOI] [PubMed] [Google Scholar]
- Carrera E, Jones PS, Alawneh JA, Klaerke Mikkelsen I, Cho TH, Siemonsen S, et al. Predicting infarction within the diffusion-weighted imaging lesion: does the mean transit time have added value. Stroke. 2011;42:1602–1607. doi: 10.1161/STROKEAHA.110.606970. [DOI] [PubMed] [Google Scholar]
- Carrera E, Jones PS, Iglesias S, Guadagno JV, Warburton EA, Fryer TD, et al. The vascular mean transit time: a surrogate for the penumbra flow threshold. J Cereb Blood Flow Metab. 2011;31:1027–1035. doi: 10.1038/jcbfm.2010.197. [DOI] [PMC free article] [PubMed] [Google Scholar]
- Yoo AJ, Barak ER, Copen WA, Kamalian S, Gharai LR, Pervez MA, et al. Combining acute diffusion-weighted imaging and mean transmit time lesion volumes with National Institutes of Health Stroke Scale Score improves the prediction of acute stroke outcome. Stroke. 2010;41:1728–1735. doi: 10.1161/STROKEAHA.110.582874. [DOI] [PubMed] [Google Scholar]
- Butcher KS, Parsons M, MacGregor L, Barber PA, Chalk J, Bladin C, et al. Refining the perfusion-diffusion mismatch hypothesis. Stroke. 2005;36:1153–1159. doi: 10.1161/01.str.0000166181.86928.8b. [DOI] [PubMed] [Google Scholar]
- Ritzenthaler T, Cho TH, Wiart M, Berthiller J, Ostergaard L, Hermier M, et al. Assessment of baseline hemodynamic parameters within infarct progression areas in acute stroke patients using perfusion-weighted MRI. Neuroradiology. 2011;53:571–576. doi: 10.1007/s00234-010-0793-3. [DOI] [PubMed] [Google Scholar]
- Butcher K, Parsons M, Baird T, Barber A, Donnan G, Desmond P, et al. Perfusion thresholds in acute stroke thrombolysis. Stroke. 2003;34:2159–2164. doi: 10.1161/01.STR.0000086529.83878.A2. [DOI] [PubMed] [Google Scholar]
- Liebeskind D. Collaterals in acute stroke: beyond the clot. Neuroimaging Clin N Am. 2005;15:553–573. doi: 10.1016/j.nic.2005.08.012. [DOI] [PubMed] [Google Scholar]
- Ribo M, Molina CA, Rovira A, Quintana M, Delgado P, Montaner J, et al. Safety and efficacy of intravenous tissue plasminogen activator stroke treatment in the 3- to 6-hour window using multimodal transcranial Doppler/MRI selection protocol. Stroke. 2005;36:602–606. doi: 10.1161/01.STR.0000155737.43566.ad. [DOI] [PubMed] [Google Scholar]
- Barber N, Parsons J, Clifford S, Darracott R, Horne R. Patients' problems with new medication for chronic conditions. Qual Saf Health Care. 2004;13:172–175. doi: 10.1136/qshc.2003.005926. [DOI] [PMC free article] [PubMed] [Google Scholar]
- Derex L, Nighoghossian N, Hermier M, Adeleine P, Berthezene Y, Philippeau F, et al. Influence of pretreatment MRI parameters on clinical outcome, recanalization and infarct size in 49 stroke patients treated by intravenous tissue plasminogen activator. J Neurol Sci. 2004;225:3–9. doi: 10.1016/j.jns.2004.05.020. [DOI] [PubMed] [Google Scholar]
- Ostergaard L, Sorensen AG, Kwong KK, Weisskoff RM, Gyldensted C, Rosen BR. High resolution measurement of cerebral blood flow using intravascular tracer bolus passages. Part II: Experimental comparison and preliminary results. Magn Reson Med. 1996;36:726–736. doi: 10.1002/mrm.1910360511. [DOI] [PubMed] [Google Scholar]
- Higashida RT, Furlan AJ, Roberts H, Tomsick T, Connors B, Barr J, et al. Trial design and reporting standards for intra-arterial cerebral thrombolysis for acute ischemic stroke. Stroke. 2003;34:e109–e137. doi: 10.1161/01.STR.0000082721.62796.09. [DOI] [PubMed] [Google Scholar]
- Forkert ND, Saring D, Fiehler J, Illies T, Moller D, Handels H. Automatic brain segmentation in Time-of-Flight MRA images. Methods Inf Med. 2009;48:399–407. doi: 10.3414/ME9237. [DOI] [PubMed] [Google Scholar]
- Fiehler J, Illies T, Piening M, Saring D, Forkert N, Regelsberger J, et al. Territorial and microvascular perfusion impairment in brain arteriovenous malformations. AJNR Am J Neuroradiol. 2009;30:356–361. doi: 10.3174/ajnr.A1351. [DOI] [PMC free article] [PubMed] [Google Scholar]
- Danielsson PE. Euclidean distance mapping. Comput Graph Image Process. 1980;14:227–248. [Google Scholar]
- Fisher RA. On the interpretation of χ2 from contingency tables, and the calculation of P. J R Stat Soc. 1922;85:87–94. [Google Scholar]
- Holmes G, Pfahringer B, Kirkby R, Frank E, Hall M. Multiclass alternating decision trees. Machine Learning: ECML 2002. 2002;2430:161–172. [Google Scholar]
- Nicoli F, Lafaye de Micheaux P, Girard N. Perfusion-weighted imaging-derived collateral flow index is a predictor of MCA M1 recanalization after IV thrombolysis. AJNR Am J Neuroradiol. 2012;34:107–114. doi: 10.3174/ajnr.A3174. [DOI] [PMC free article] [PubMed] [Google Scholar]
- Baron JC. Mapping the ischaemic penumbra with PET: a new approach. Brain. 2001;124:2–4. doi: 10.1093/brain/124.1.2. [DOI] [PubMed] [Google Scholar]
- Fiehler J, Knudsen K, Kucinski T, Kidwell CS, Alger J, Thomalla G, et al. Predictors of apparent diffusion coefficient normalization in stroke patients. Stroke. 2004;35:514–519. doi: 10.1161/01.STR.0000114873.28023.C2. [DOI] [PubMed] [Google Scholar]
- Kluytmans M, van Everdingen KJ, Kappelle LJ, Ramos LM, Viergever MA, Van Der Grond J. Prognostic value of perfusion- and diffusion-weighted MR imaging in first 3 days of stroke. Eur Radiol. 2000;10:1434–1441. doi: 10.1007/s003300000501. [DOI] [PubMed] [Google Scholar]
- Rohl L, Ostergaard L, Simonsen CZ, Vestergaard-Poulsen P, Andersen G, Sakoh M, et al. Viability thresholds of ischemic penumbra of hyperacute stroke defined by perfusion-weighted MRI and apparent diffusion coefficient. Stroke. 2001;32:1140–1146. doi: 10.1161/01.str.32.5.1140. [DOI] [PubMed] [Google Scholar]
- Schaefer PW, Ozsunar Y, He J, Hamberg LM, Hunter GJ, Sorensen AG, et al. Assessing tissue viability with MR diffusion and perfusion imaging. AJNR Am J Neuroradiol. 2003;24:436–443. [PMC free article] [PubMed] [Google Scholar]
- Sorensen AG, Buonanno FS, Gonzalez RG, Schwamm LH, Lev MH, Huang-Hellinger FR, et al. Hyperacute stroke: evaluation with combined multisection diffusion-weighted and hemodynamically weighted echo-planar MR imaging. Radiology. 1996;199:391–401. doi: 10.1148/radiology.199.2.8668784. [DOI] [PubMed] [Google Scholar]
- Rordorf G, Koroshetz WJ, Copen WA, Cramer SC, Schaefer PW, Budzik RF, et al. Regional ischemia and ischemic injury in patients with acute middle cerebral artery stroke as defined by early diffusion-weighted and perfusion-weighted MRI. Stroke. 1998;29:939–943. doi: 10.1161/01.str.29.5.939. [DOI] [PubMed] [Google Scholar]
- Powers WJ. Cerebral hemodynamics in ischemic cerebrovascular disease. Ann Neurol. 1991;29:231–240. doi: 10.1002/ana.410290302. [DOI] [PubMed] [Google Scholar]
- Derdeyn CP, Videen TO, Yundt KD, Fritsch SM, Carpenter DA, Grubb RL, et al. Variability of cerebral blood volume and oxygen extraction: stages of cerebral haemodynamic impairment revisited. Brain. 2002;125:595–607. doi: 10.1093/brain/awf047. [DOI] [PubMed] [Google Scholar]
- Liebeskind DS. Collateral circulation. Stroke. 2003;34:2279–2284. doi: 10.1161/01.STR.0000086465.41263.06. [DOI] [PubMed] [Google Scholar]
- Meyer JS, Denny-Brown D. The cerebral collateral circulation. I. Factors influencing collateral blood flow. Neurology. 1957;7:447–458. doi: 10.1212/wnl.7.7.447. [DOI] [PubMed] [Google Scholar]
- Liu Y, Karonen JO, Vanninen RL, Nuutinen J, Perkio J, Vainio PA, et al. Detecting the subregion proceeding to infarction in hypoperfused cerebral tissue: a study with diffusion and perfusion weighted MRI. Neuroradiology. 2003;45:345–351. doi: 10.1007/s00234-003-0959-3. [DOI] [PubMed] [Google Scholar]
- Siemonsen S, Fitting T, Thomalla G, Krutzelmann A, Fiehler J. Visual assessment of magnetic resonance imaging perfusion lesions in a large patient group. Clin Neuroradiol. 2012;22:305–313. doi: 10.1007/s00062-012-0143-4. [DOI] [PubMed] [Google Scholar]
- Miteff F, Levi CR, Bateman GA, Spratt N, McElduff P, Parsons MW. The independent predictive utility of computed tomography angiographic collateral status in acute ischaemic stroke. Brain. 2009;132:2231–2238. doi: 10.1093/brain/awp155. [DOI] [PubMed] [Google Scholar]
- Caplan LR, Wolpert SM. Angiography in patients with occlusive cerebrovascular disease: views of a stroke neurologist and neuroradiologist. AJNR Am J Neuroradiol. 1991;12:593–601. [PMC free article] [PubMed] [Google Scholar]
- Wang CX, Todd KG, Yang Y, Gordon T, Shuaib A. Patency of cerebral microvessels after focal embolic stroke in the rat. J Cereb Blood Flow Metab. 2001;21:413–421. doi: 10.1097/00004647-200104000-00010. [DOI] [PubMed] [Google Scholar]