

Abstract
Hypoglycemia-associated autonomic failure (HAAF) is a condition in which patients with type 1 diabetes (T1D) who experience frequent hypoglycemia develop defective glucose counter-regulation and become unable to sense hypoglycemia. Brain glutamate may be involved in the mechanism of HAAF. The goal of this study was to follow the human brain glutamate concentration during experimentally induced hypoglycemia in subjects with and without HAAF. 1H magnetic resonance spectroscopy was used to track the occipital cortex glutamate concentration throughout a euglycemic clamp followed immediately by a hypoglycemic clamp. T1D patients with HAAF were studied in comparison to two control groups, i.e., T1D patients without HAAF and healthy controls (n=5 per group). Human brain glutamate concentration decreased (P⩽0.01) after the initiation of hypoglycemia in the two control groups, but a smaller trend toward a decrease in patients with HAAF did not reach significance (P>0.05). These findings are consistent with a metabolic adaptation in HAAF to provide higher glucose and/or alternative fuel to the brain, eliminating the need to oxidize glutamate. In an exploratory analysis, we detected additional metabolite changes in response to hypoglycemia in the T1D patient without HAAF control group, namely, increased aspartate and decreased lactate.
Keywords: brain, diabetes, glutamate, hypoglycemia, unawareness
Introduction
Patients with type 1 and late stage type 2 diabetes who experience frequent episodes of hypoglycemia as a result of iatrogenic insulin excess are at a risk for developing compromised physiological and behavioral defenses against hypoglycemia. When blood glucose in healthy individuals falls below physiological levels, a coordinated hormonal response is generated that supports the restoration of normoglycemia through the sequential secretion of counter-regulatory hormones including glucagon, epinephrine, cortisol and growth hormone. This counter-regulatory hormonal response to hypoglycemia is impaired in patients who experience recurrent hypoglycemic episodes. As a result, they develop hypoglycemia-associated autonomic failure (HAAF) that is characterized by both a reduction in the glycemic threshold necessary to elicit the counter-regulatory response and a reduction in the magnitude of that response. HAAF is a clinical syndrome in which the first symptom of low blood sugar is confusion or loss of consciousness. Fear of experiencing too many hypoglycemic events over a short period of time and thus developing HAAF is a serious problem in the management of type 1 and advanced type 2 diabetes as it limits the ability of patients to achieve the level of normoglycemia known to reduce the risk of microvascular complications of diabetes.1 As a result, iatrogenic hypoglycemia remains the limiting factor in the glycemic management of diabetes.2
Although the mechanisms of HAAF have not been fully elucidated, a picture is emerging in which a series of cerebral adaptations, including altered fuel transport and/or metabolism, lead to defective glucose counter-regulation and impaired hypoglycemia awareness.3 The cerebral response to hypoglycemia in the healthy brain involves changes in regional blood flow4, 5 and sequential adjustments in cerebral metabolism in order to provide sufficient fuel for brain activity. As the levels of glucose, the principal cerebral energy substrate, drop from 5 to ∼3 mmol/L in plasma, cerebral metabolic rate of glucose (CMRglc) and cerebral metabolic rate of oxygen (CMRO2) are preserved6, 7, 8 despite lower brain glucose uptake.9 The brain starts using alternative fuels such as glycogen in this glycemic range.10 At lower glycemic levels, below a threshold of 2.5 to 3 mmol/L plasma glucose, a sharp increase in cerebral blood flow (CBF)11, 12 is accompanied by compensatory reductions in CMRglc.6, 7, 13, 14 At such severe hypoglycemia, CMRO2 has been reported either unchanged15 or decreased to a lesser extent than CMRglc,7 indicating oxidation of non-glucose fuels. It is clear that in this glycemic range the brain relies heavily on alternative fuels such as glycogen,16 lactate (Lac), and amino acids like glutamate (Glu).15, 17, 18 Studies in rats demonstrated that during the transition to an isoelectric electroencephalogram (EEG) in the setting of hypoglycemic coma reductions in Glu, glutamine (Gln) and Lac levels are accompanied by an increase in aspartate (Asp) before a precipitous drop in the phosphocreatine-to-creatine (PCr/Cr) ratio indicative of energy failure.18, 19, 20, 21 Whether similar changes also occur in the human brain is unknown.
One magnetic resonance spectroscopy (MRS) study in humans reported lower Glu-to-total creatine (Glu/tCr) ratios in the occipital cortex (OCC) at moderate hypoglycemia (3 mmol/L) relative to euglycemia, indicating that a modest reduction in Glu may occur in the healthy human even in the absence of severe hypoglycemia.22 Interestingly, a similar change in Glu/tCr was not observed in patients with type 1 diabetes (T1D) and blunted glucose counter-regulation. The authors considered the Glu levels as reflective of tricarboxylic acid (TCA) cycle activity and interpreted the lower Glu/tCr finding as a reduction of TCA cycle activity in the healthy brain. They reasoned that normal energy metabolism was maintained in T1D, thereby contributing to the development of HAAF. However, it was not clear whether the observed difference in the Glu/tCr response to hypoglycemia between patients with T1D and controls was due to HAAF or diabetes alone.
The primary goals of the current investigation were to determine whether (1) Glu reduction similar to that suggested by Bischof et al22 occurs in response to moderate hypoglycemia in the healthy human brain; and (2) this response is different in patients with T1D with HAAF compared with those without HAAF and those without T1D. To accomplish this, human brain Glu concentration was followed throughout a hyperinsulinemic euglycemic–hypoglycemic clamp in subjects with T1D and matched controls. On the basis of the prior MRS study,22 we hypothesized that Glu levels in the OCC would decrease in response to moderate hypoglycemia in healthy controls and in T1DM without HAAF, but not in T1DM with HAAF. This study took advantage of a highly optimized protocol for detecting changes in neurochemical concentrations that permitted direct observation of the time course of the neurochemical response to hypoglycemia with high sensitivity. We focused on the OCC because of our desire to replicate and extend the findings of Bischof et al who also studied this brain region, and because we have previously found that steady state brain glucose concentrations in this region differ between controls and participants with well-controlled T1D and frequent hypoglycemia;23 an observation that suggests altered glucose transport or metabolism in this region. This approach encompassed the reliable quantification of a neurochemical profile of several metabolites including Lac, Asp, and Gln, which have been observed to change upon severe hypoglycemia in the rat brain.18, 19, 20, 21 Hence, the changes in the levels of these additional neurochemicals were investigated in an exploratory fashion.
Materials and methods
Subject Characteristics
Twenty subjects (39±12 years (mean±s.d.), body mass index (BMI) 25±5 kg/m2, 7 males) were enrolled in this study. Fourteen had a clinical diagnosis of well-controlled T1D and six were healthy controls. Eight subjects with T1D and hypoglycemia unawareness (i.e., inability to sense hypoglycemia) and six without unawareness were recruited on the basis of their response to the Cox questionnaire24 at the time of recruitment (⩾4 weeks before the clamp study) with a score ⩾4 indicating unawareness. The presence of HAAF was determined by measuring blood epinephrine concentrations (Epiblood) during hypoglycemia in all subjects. Exclusion criteria included history of stroke, seizures, neurosurgical procedures, arrhythmias, and usage of glucose metabolism-altering drugs (other than insulin). Three subjects (one in each study group) moved too much during the study to allow collection of reliable MRS data so they were not included. In two additional subjects (both with T1D and Cox score ⩾4) no satisfactory vascular access could be achieved so these studies were abandoned. Experiments were approved by and studied in accordance with the ethical standards of the University of Minnesota's institutional review board.
Euglycemic/Hypoglycemic Clamp
Subjects arrived at the Center for Magnetic Resonance Research (CMRR) in the morning of the day of the study after an overnight fast. Upon arrival, an intravenous catheter was placed antegrade in a forearm for subsequent intravenous infusions. Intravenous catheters were placed retrograde in one or both lower legs (as tolerated) for blood sampling. The leg used for blood sampling was wrapped in heated towels and hot packs to arterialize the venous blood.25 Subjects underwent a two-step hyperinsulinemic clamp in which insulin at a rate of 2.0 mU/kg per minute and potassium phosphate at a rate of 4 mEq/hour were infused. Figure 1 illustrates the study protocol. Blood glucose was initially maintained at 90 mg/dL by intravenous infusion of 20% dextrose while the baseline MRS data were collected. After collection of data in the euglycemic condition, blood glucose was allowed to drop to 50 mg/dL by the discontinuation of the dextrose infusion and then maintained at the hypoglycemic plateau by a variable dextrose infusion for approximately 30 minutes. MRS data were acquired in two 5-minute blocks while glucose was maintained at 90 mg/dL and then continuously in 5-minute blocks as blood glucose was dropped and clamped at 50 mg/dL. Blood was sampled using a retrograde lower leg intravenous catheter to follow glucose concentration and for assessing counter-regulatory hormones. Blood glucose was sampled every 5 minutes. Blood samples for counter-regulatory hormones were collected at baseline and every 10 minutes during hypoglycemia. After completion of MRS data acquisition during the hypoglycemic clamp, symptoms of hypoglycemia were quantified by using a previously validated questionnaire.26 Subjects were asked to score from 0 (none) to 6 (severe) for each of 12 symptoms: 6 autonomic symptoms (heart pounding, shaky or tremulous, nervous or anxious, sweaty, hungry, and tingling) and 6 neuroglycopenic symptoms (difficulty thinking, tired or drowsy, weak, warm, faint, and dizzy).
Figure 1.

Study protocol and blood glucose concentrations (mean±s.d.) throughout the euglycemia/hypoglycemia clamp per study group, i.e., T1D with HAAF (T1D w| HAAF), T1D without HAAF (T1D w|o HAAF), and healthy control. The upper and lower dashed horizontal lines delineate the respective euglycemic and hypoglycemic blood glucose clamp target concentrations. Dextrose was discontinued at time=0.
Laboratory Analyses
Plasma glucose concentration was measured in duplicates during the scanning session using an Analox machine (Analox Instruments, Lunenburg, MA, USA). Blood samples obtained for measurement of counter-regulatory hormones were sent to Vanderbilt Diabetes Research and Training Center core laboratory for analysis. Plasma epinephrine was measured by high-performance liquid chromatography (Dionex, Sunnyvale, CA, USA; formerly ESA). Radioimmunoassay was used to measure cortisol (Diagnostic Products Corporation, Los Angeles, CA, USA) as well as plasma glucagon (Millipore, Billerica, MA, USA, division of Merck, Whitehouse Station, NJ, USA). The maximum hormone levels measured at baseline and during hypoglycemia were computed and used to represent the euglycemic and hypoglycemic hormone levels in each subject. These peak hormonal values were used in stratifying patients and determining group averages.
Magnetic Resonance Protocol
Neurochemical concentrations were measured using a highly optimized MRS protocol. Spectra were measured at the ultra-high-field strength of 7 T (90-cm horizontal bore Magnex Scientific, Abingdon, UK magnet and Siemens, Erlangen, Germany console) as described before.27 Use of a surface coil (i.e., an elliptical quadrature half-volume transceiver), which is ideally suited to study the OCC, further insured optimization of sensitivity. Measurements were made without removing the subject from the scanner to reduce the variance that can occur via removal and replacement. Images acquired with a 1.7 × 1.3 × 2.0 mm3 resolution pre-inverted turbo-fast low-angle shot, magnetization prepared rapid acquisition gradient echo (Turboflash, MPRAGE) sequence (repetition time TR=1.9 seconds, inversion time TI=0.9 second, echo time TE=3.1 milliseconds, 112 partition-encode steps, 192 phase-encode steps, 256 data points in the read direction, nominal flip angle=7°, total acquisition time=2 minutes 44 seconds) were used for selection of the 22 × 22 × 22 mm3 volume of interest (VOI) in the OCC. Spectra were measured using stimulated echo acquisition mode spectroscopy (TE=8 milliseconds, TR=5 seconds, mixing time TM=32 milliseconds, number of excitations NEX=64, and variable power radiofrequency (RF) pulses with optimized relaxation delays water suppression and outer volume saturation). Symmetric sinc RF pulses (1.5 milliseconds, 5.9 kHz bandwidth) were used for stimulated echo acquisition mode localization and required a peak excitation power (B1) of 34 μT, which was easily achieved via utilization of a surface coil.27 First- and second-order shims were adjusted using fast automatic shimming by mapping along projections (FASTMAP)28 with echo-planar imaging readout. Unsuppressed water spectra acquired from the same VOI were used to remove residual eddy current effects and as an internal quantification reference. Single-shot data were saved during acquisition to facilitate frequency and phase correction of each free induction decay (FID) before summation. For display, spectra were zero filled to 125k points and line broadened (Gaussian factor 0.15). Scout images (two-dimensional fast low-angle shot (FLASH) in three orthogonal orientations, 1.1 × 1.0 × 7.0 mm3 resolution, TR=8.6 milliseconds, TE=4 milliseconds, 230 phase-encode steps, 256 data points in the read direction, nominal flip angle=20°, total acquisition time=12 seconds) measured at the beginning and end of the protocol were used to assure that translation of the participant's head remained within 3 mm in all directions.
Magnetic Resonance Spectral Analysis
Quantification of the brain chemical concentrations was optimized by using water as an internal reference, thus eliminating the potential for confounding by changes in brain tCr concentration that can occur when tCr signal is used as an internal reference. Neurochemicals were quantified using LCModel29 with the following basis set and key control parameters: The spectra of alanine(Ala), Asp, ascorbate/vitamin C (Asc), glycerophosphocholine (GPC), phosphocholine (PC), Cr, PCr, γ-aminobutyric acid (GABA), glucose (Glc), Gln, Glu, glutathione (GSH), myo-inositol (myo-Ins), Lac, N-acetylaspartate (NAA), N-acetylaspartylglutamate (NAAG), scyllo-inositol (scyllo-Ins), and taurine (Tau) were generated on the basis of previously reported chemical shifts and coupling constants.30 Macromolecule spectra were acquired from the OCC of five healthy volunteers using an inversion recovery sequence (TR=2 seconds, TI=0.680 second).27 The LCModel parameter to control the flatness of the spline baseline (DKNTMN) was set to 0.25, and fitting was performed over 0.5 to 4.2 p.p.m. All study spectra were analyzed in a single batch with no user input. Neurochemicals quantified with Cramér–Rao lower bounds (CRLB, estimated error of the neurochemical quantification) >50% were classified as not detected, as recommended by the LCModel manual.31 If the correlation between two neurochemicals was consistently high (correlation coefficient r<−0.5), their sum was used for analysis, i.e., NAA+NAAG (tNAA, total NAA), Cr+PCr (tCr), GPC+PC (tCho, total choline). Owing to the increased spectral complexity of the glucose resonances at ultra-high field, Glc was not detected reliably. Because of possible confounding via strong spectral similarity with Glc, Tau data are not reported.
Neurochemical concentrations were computed by comparing each metabolite resonance signal with that of water as previously described.27 Concentrations were not corrected for longitudinal and transverse relaxation (T1 and T2) effects because long TR and ultra-short TE values were used. As contributions of cerebrospinal fluid to the VOI as well as head motion relative to the VOI size were small, and because each person served as their own control in calculation of the metabolite response to hypoglycemia, neurochemical concentrations were not corrected for cerebrospinal fluid content. GABA findings in the healthy volunteer group in this study were reported previously.32
Analytical Procedures
To address the association of the neurochemical response to hypoglycemia with HAAF, the patients were stratified on the basis of their counter-regulatory hormonal response to hypoglycemia into two groups: those with a severely blunted counter-regulatory response (peak epinephrine during hypoglycemia <100 pg/mL, denoted as T1D w| HAAF) and those with normal-to-modestly blunted counter-regulatory response (peak epinephrine during hypoglycemia >100 pg/mL, denoted as T1D w|o HAAF). The method to calculate the change in brain neurochemical concentrations from baseline (euglycemia) to those during hypoglycemia was designed to control for individual differences in the rate at which the target hypoglycemic blood glucose concentration (i.e., 50 mg/dL) was achieved. As such, neurochemical concentrations were averaged within person across the two measures obtained during euglycemia and across the first three measures obtained during hypoglycemia (after blood glucose first dropped to ⩽50 mg/dL). Baseline and hypoglycemic blood glucose concentrations were calculated from samples collected concurrent with respective spectra, i.e., during stable euglycemia and hypoglycemia.
Statistical Analysis
Glu was identified before acquisition of data in subjects with T1D as the primary neurochemical of interest, whereas the remaining neurochemicals were assigned secondary importance. Analysis of variance (ANOVA) was used to analyze whether there was a drop in average Glu concentrations from euglycemia to hypoglycemia in each experimental group and whether such drops were different among experimental groups using F-tests of the corresponding contrasts. These analyses were repeated using analysis of covariance (ANCOVA) to adjust the within- and among-group comparisons for average blood glucose achieved during hypoglycemia. ANOVA and ANCOVA results were similar, therefore only those calculated using ANOVA are reported. Because of small sample sizes all tests were repeated with a nonparametric approach; results were similar and are not reported here. A two-sided P<0.05 for the Glu test was considered statistically significant. As spectral analysis readily produced the concentrations of several neurochemicals in addition to Glu, these data were tested similarly for euglycemic versus hypoglycemic changes and group differences in those changes. These analyses were considered exploratory. Counter-regulatory hormones during euglycemia versus hypoglycemia were compared with paired two-sided t-tests within experimental group. The concentrations of the counter-regulatory hormones and hypoglycemia symptom scores were compared among patient groups using two-sided t-tests with unequal variance (equal-variance assumption of ANOVA was violated). Tests were repeated with a nonparametric approach; results were again similar and are not reported here. Next, ANOVA was used to test for differences in spectral and fitting quality control parameters among groups and for differences in the Glu–Gln correlation coefficient between euglycemia and hypoglycemia. Lastly, the euglycemic versus hypoglycemic change in Glu was correlated with the euglycemic versus hypoglycemic change in epinephrine using data in all three groups (N=15). P-values shown have not been adjusted for multiple comparisons.
Results
Figure 1 illustrates achievement of stable euglycemia followed by a rapid drop to and maintenance at the targeted hypoglycemic level with a similar time course in all study groups. Mean blood glucose and counter-regulatory hormone concentrations during the euglycemic and hypoglycemic clamps are listed in Table 1. The 10 subjects with T1D were readily separable into those without HAAF and with HAAF as 5 had peak hypoglycemic Epiblood <100 pg/mL, whereas 5 had peak Epiblood >200 pg/mL. Subject characteristics are listed in Table 2. Total hypoglycemia symptom scores were significantly higher during hypoglycemia in T1D w|o HAAF as compared with T1D w| HAAF (P=0.02). Total hypoglycemia symptom scores were higher in control as compared with T1D w| HAAF but the difference did not reach statistical significance (P=0.07). Symptom scores were not different between control and T1D w|o HAAF groups (P=0.6). The average hypoglycemic epinephrine concentration among subjects with T1D was lower than that among controls (Table 1). Among the five T1D w| HAAF subjects, two indicated that they were aware of hypoglycemic episodes at the time of recruitment via the Cox questionnaire. Among the five T1D w|o HAAF subjects, two were characterized as being hypoglycemia unaware based on scores of the Cox questionnaire administered at the time of recruitment.
Table 1. Blood glucose and hormone concentrations.
| Group |
Glc (mg/dL) |
Epi (pg/mL) |
Glucagon (pg/mL) |
Cortisol (mg/dL) |
||||
|---|---|---|---|---|---|---|---|---|
| Eu | Hypo | Eu | Hypo | Eu | Hypo | Eu | Hypo | |
| Control | 92±4 | 50±4a | 23±12 | 559±232a | 85±18 | 134±37a | 29±9 | 29±11 |
| T1D w|o HAAF | 92±9 | 48±4a | 25±10 | 374±169a | 67±14 | 66±16b | 31±20 | 34±21 |
| T1D w| HAAF | 93±8 | 49±5a | 21±10 | 46±30b | 62±9b | 51±9b | 19±5 | 17±3 |
Summary of blood concentrations (mean±s.d.) of glucose (Glc) and counter-regulatory hormones epinephrine (Epi), glucagon and cortisol during euglycemia (Eu) and hypoglycemia (Hypo) per study group. Glc is the average of that measured from blood samples drawn from each subject concurrent with accumulation of the magnetic resonance spectroscopy data, i.e., a 11-minute span before discontinuation of dextrose and 16 minutes after blood glucose was first sampled at ⩽50 mg/dL. Hormone values represent the maximum concentration measured in each subject before and after discontinuation of dextrose.
Eu to Hypo: P<0.02.
T1D subgroup to control: P<0.05.
Table 2. Subject characteristics.
| Group | Age (years) | BMI (kg/m2) | HbA1c (% (mmol/mol)) | Duration (years)a | M | F |
|---|---|---|---|---|---|---|
| Control | 32±4 | 24±5 | 1 | 4 | ||
| T1D w|o HAAF | 40±18 | 23±2 | 7.4±0.4 (57±5) | 28±14 | 1 | 4 |
| T1D w| HAAF | 44±10 | 26±4 | 6.3±0.3 (46±5) | 28±10 | 2 | 3 |
Subject characteristics (mean±s.d.) including age, body mass index (BMI), hemoglobin A1c (HbA1c), diabetes duration, and number of males (M) and females (F) per group.
As patients with T1D immediately start insulin upon diagnosis, the diabetes duration is also the length of time that they were on insulin treatment.
Figure 2 illustrates the VOI from which spectra were measured in this study. Representative 1H MR spectra obtained from a patient with T1D w| HAAF during euglycemia and hypoglycemia are shown in Figure 3. Good-quality spectra (average signal-to-noise ratio=56, average linewidth as fitted by LCModel =9 Hz, excellent water suppression, and absence of extraneous coherences) were consistently obtained. This facilitated the quantification of 12 neurochemicals (Asc, Asp, GABA, Gln, Glu, GSH, myo-Ins, Lac, scyllo-Ins, tNAA, tCr, and tCho) with mean CRLB per neurochemical ⩽20%. Glu was detected reliably in all cases as indicated by the fitting quality control parameters generated by LCModel. Namely, CRLB was 2% on average and always ⩽3% for Glu. The coefficient of correlation r between Glu and each of the other neurochemicals was always >−0.5. The average correlation coefficient between Glu and Gln was 0.002. This absence of correlation assures that the Glu resonance was reliably separated from other neurochemical resonances, including the very similar Gln resonance. ANOVA on the spectral quality control parameters found that the 8-Hz average linewidth of the healthy control spectra was narrower than the 10-Hz found for the subjects with T1D. Linewidth was not different between T1D w| HAAF and T1D w|o HAAF. No differences in the Glu–Gln correlation coefficient between euglycemia and hypoglycemia were found both when taking the group as a whole and when testing per study group.
Figure 2.
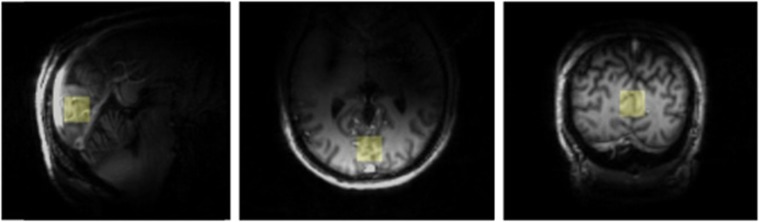
Three-dimensional MPRAGE images measured from a patient with T1D w| HAAF for selection of the illustrated volume of interest.
Figure 3.

Spectra from a subject with T1D w| HAAF during euglycemia (Eu, top) and 30 minutes after discontinuation of dextrose (Hypo, bottom). These spectra were measured from the VOI and subject represented in Figure 2. Glu, glutamate; Ins, myo-inositol; tCho, total choline; tCr, total creatine; tNAA, total N-acetylaspartate.
Figure 4 graphs the euglycemic to hypoglycemic drop in brain Glu concentration that was measured in all subjects. Group averages for this drop are reported in Table 3. Glu dropped after initiation of hypoglycemia in the control and T1D w|o HAAF groups (P⩽0.003). The drop in the T1D w| HAAF group (Table 3) did not reach significance (P=0.06), and this drop was different from the T1D w|o HAAF group (P=0.01). No correlation between the euglycemic versus hypoglycemic change in epinephrine and change in brain Glu concentration was observed.
Figure 4.

Euglycemic to hypoglycemic change in brain glutamate concentration (mean±s.d.) and values (dots) for this change in each individual subject. *P<0.01 for euglycemic versus hypoglycemic brain glutamate concentration (brain [Glu]).
Table 3. Brain glutamate concentrations.
| Group | Eu Glu | Hypo Glu | % Change | P |
|---|---|---|---|---|
| Control | 8.8±0.3 | 8.4±0.3 | −4.5 | 0.003 |
| T1D w|o HAAF | 9.1±0.6 | 8.6±0.7a | −5.5 | <0.0001 |
| T1D w| HAAF | 9.0±0.4 | 8.8±0.4a | −2.2 | 0.06 |
Brain glutamate (Glu) concentrations for control and type 1 diabetes (T1D) groups (mean±s.d., μmol per g wet weight) during euglycemia (Eu) and hypoglycemia (Hypo), percent change (% change=100 × (Hypo Glu−Eu Glu)/Eu Glu) between euglycemia and hypoglycemia, and significance for Eu to Hypo change (P, analysis of variance).
Euglycemic to hypoglycemic change for T1D w|o HAAF is significantly different from T1D w| HAAF (P=0.01).
There was no significant decrease (P>0.05) from euglycemia to hypoglycemia in the concentration of any of the other major neurochemicals: tNAA, tCr, tCho, myo-Ins, or Gln in any of the study groups, demonstrating stable normalization of the spectroscopic data. Among all of the other neurochemicals, those showing strong changes were: an increase in inositol (both myo and scyllo) in both T1D groups, an increase in scyllo-Ins in the control group, and an increase in Asp and a decrease in Lac in the T1D w|o HAAF group (Supplementary Figure). As such, the decrease in brain chemical concentration from euglycemia to hypoglycemia was most uniform across groups for Glu, substantiating the specificity of this effect to Glu.
Discussion
Here we demonstrated that cerebral Glu concentration decreases in response to moderate hypoglycemia in the healthy human brain and in patients with T1D w|o HAAF using ultra-high-field MRS, an optimized acquisition protocol, and euglycemic/hypoglycemic clamps performed in the scanner. This drop in Glu was not detected in patients with T1D w| HAAF. There was no correlation between the cerebral Glu and peripheral epinephrine responses to hypoglycemia. In an exploratory analysis, we detected changes in other neurochemicals, such as Asp and Lac, in response to moderate hypoglycemia, changes that have thus far only been observed at severe hypoglycemia in the rodent brain.
A prior study had reported a decrease in the cerebral Glu/tCr ratio upon hypoglycemia in healthy controls, but not patients with T1D and blunted counter-regulation,22 and provided motivation for the current study. The current results demonstrate that the cause of the Glu/tCr ratio change in the prior study was indeed a change in Glu concentration (rather than in tCr), and that the lack of this response was associated with HAAF and not diabetes alone. In the prior study, the percent decrease in brain Glu/tCr in the healthy group was 7%, and hypoglycemia was maintained longer and brain Glu/tCr was sampled later (at 80–120 minutes). Therefore the ∼5% reduction we observed earlier in the time course was consistent with the prior observation. More substantial changes in Glu levels were observed at severe hypoglycemia in the rodent brain.17, 18, 19, 20, 21 The current study, together with the earlier observations regarding Glu/tCr,22 demonstrates that these metabolite changes start at moderate hypoglycemia. It is unsafe to study humans at lower glycemic levels and thus the human studies are advantageous in revealing these subtle changes in metabolite levels at moderate hypoglycemia. Moderate hypoglycemic levels are more typically experienced by patients and therefore are more clinically relevant.
The reduction in Glu upon hypoglycemia was ascribed to Glu oxidation in earlier animal work, namely, that Glu starts to enter the TCA cycle with decreasing glucose supply from the blood.17, 18 As an alternative hypothesis to Glu oxidation during hypoglycemia, Bischof et al ascribed the lowering of the Glu/tCr ratio to a slower substrate flux through the TCA cycle during hypoglycemia. However, a number of animal studies indicate that cerebral metabolic rates of glucose decrease only below a blood glucose level of 2.5–3 mmol/L.6, 7, 14 Consistently, using 13C MRS, Van de Ven et al8 found that acute moderate hypoglycemia (3 mmol/L blood glucose) does not affect cerebral TCA cycle rates in healthy humans. On the basis of these prior data that indicate stable metabolic rates during moderate hypoglycemia, glutamate oxidation seems a more plausible explanation for the drop in Glu levels that we observed. If Glu is indeed oxidized at moderate hypoglycemia in the healthy human brain, the lack of a Glu response to hypoglycemia in HAAF suggests higher glucose and/or alternative fuel availability to the brain in HAAF, perhaps because of an increase in glucose or lactate transport into the brain, thereby eliminating the need to oxidize glutamate. Such a conclusion is supported by our previous work suggesting that an increase in glucose transport rates and not a reduction in glucose metabolism rates33 is responsible for the finding that patients with T1D and hypoglycemia unawareness have higher brain glucose concentrations than controls studied under the same metabolic conditions,23 as well as by the findings of Van de Ven et al34 who did not see differences in the plasma-to-brain glucose relationship in subjects with T1D who had awareness of hypoglycemia. In addition, the work of Mason et al35 suggests that patients with T1D and hypoglycemia unawareness may have increased cerebral lactate transport. A recent study in a rat model suggested that lactate, the transport of which into and out of the brain is upregulated upon recurrent hypoglycemia, may serve as a metabolic regulator to enhance glucose utilization in the brain in HAAF.36 All of these studies point to an increased ability of the brain to sustain its metabolic needs following recurrent hypoglycemia.
Interestingly, the cerebral Glu response did not correlate with the peripheral epinephrine response, as may be expected from the different responses among the three subject groups, with the T1D w| HAAF group having the smallest Glu and epinephrine responses to hypoglycemia. The study had 80% power to detect a correlation of 0.66 or larger with N=15, i.e., was powered to detect moderate to large correlations. Consistent with the lack of a correlation between the change in Glu and change in epinephrine in this study, an earlier rat study demonstrated that the decrease in cerebral Glu in response to hypoglycemia is not related to the epinephrine released as it also occurred in animals after adrenal demedullation.17
Regarding the exploratory outcomes among the other neurochemicals, the reason for a change in inositols upon hypoglycemia in all groups is not clear. Chronically elevated levels of cerebral myo-Ins have been reported in mixed cohorts of subjects with diabetes37, 38 as well as in animal models of diabetes,39 and interpreted either as gliotic activity or as osmolarity regulation. The acute change in inositols observed here upon hypoglycemia cannot be due to structural changes (as in gliosis) and is more likely related to changes in osmolarity.40 As such changes were not seen in another human study during hypoglycemia,22 additional studies in which the impact of glycemic changes on cerebral inositols is the focus of the study will be necessary to clarify the conditions under which these compounds change. Decreased Lac and increased Asp upon hypoglycemia were previously observed in healthy rats at severe hypoglycemia.18, 19, 20, 21 The Lac decrease could be ascribed to Lac utilization when glucose levels are low and the Asp increase could possibly be explained by a shift in the aspartate aminotransferase reaction (Glu+oxaloacetate↔Asp+α-ketoglutarate), a reaction that feeds Glu into the TCA cycle.18, 21 However, the small sample size of our study and the moderate level of hypoglycemia used in our protocol make any conclusions about the mechanisms responsible for these small changes in metabolite concentrations premature.
In this study, we used the hypoglycemic epinephrine levels to stratify the subjects with T1D into w| and w|o HAAF groups; a stringent requirement that assures characterization based on documented counter-regulatory responses. Other investigators have relied on Cox questionnaires done at the time of subject ascertainment or unspecified clinical assessment of hypoglycemia awareness to categorize participants with T1D into those with and without HAAF. However, recent exposure to hypoglycemia is known to alter the glucose threshold at which hypoglycemia-induced epinephrine secretion occurs and without a comprehensive assessment of minute by minute glycemia for the weeks before a study, these clinical characterizations are inadequate for accurate identification of which participants do and do not have HAAF. This fact is well demonstrated in the current study where participants were wrongly characterized as having or not having HAAF on the basis of the Cox questionnaire administered weeks before the study. We propose that future investigations use the hypoglycemic epinephrine levels for HAAF stratification to ensure that comparisons among studies can be made.
Regarding the MRS methodology, improvements in sensitivity and resolution were achieved at ultra-high field, leading to outstanding spectral quality. Together with an optimal protocol these improvements enabled measurement of robust human brain neurochemcal time courses throughout controlled euglycemia and experimentally induced hypoglycemia. In addition, MRS data acquisition at euglycemia and hypoglycemia within the same MR session, i.e., without removing the subject from the scanner, avoided issues with consistent voxel placement between scanning sessions and provided excellent reproducibility of concentrations. Together, these improvements facilitated detection of a small brain Glu change (∼5%) in the healthy and T1D control groups with a small sample size.
The primary limitation in our study is the small sample size caused by complications associated with hyperinsulinemic clamps performed in the MR scanner during long scanning sessions. Of the 20 subjects enrolled, data from 5 were unusable due to issues with vascular access and subject motion in the scanner. We pre-identified Glu as the primary outcome of interest and all of the other neurochemicals as secondary outcomes to avoid diluting the power to detect Glu changes. Studies with larger samples sizes are needed, particularly, to confirm and further investigate the hypoglycemic changes in neurochemicals other than Glu. Another limitation is that the controls that completed the study tended to be younger than the participants with diabetes despite our efforts to recruit controls who were similar in age to the participants with diabetes. Although age may have an impact on cerebral metabolism, it is unlikely that the small difference in age between these groups of mid-life adults can explain the differences we found, particularly as larger and more significant differences were found between the two groups with diabetes who were better matched for age (Tables 2 and 3).
In conclusion, the drop in human brain Glu that was observed during moderate hypoglycemia in control and T1D w| HAAF subjects, but not in T1D w|o HAAF in this study extends similar prior findings in the healthy rat brain at severe hypoglycemia.18, 19, 20, 21 These data affirm similar prior findings in the human brain22 and extend the specificity of those findings to HAAF, as opposed to T1D in general. Whether maintenance of brain Glu in T1D w| HAAF exists because of compensatory changes in brain glucose or because of lactate transport/metabolism that occurs as a result of recurrent antecedent hypoglycemia will be the subject of future investigations, but our work shows that HAAF-induced changes include alterations in Glu metabolism. This work provides further evidence that the metabolic adaptations that occur in humans with T1D and HAAF impact multiple pathways in the brain.
Acknowledgments
The authors thank the staff of the Center for MR Research for maintaining and supporting the NMR system and the volunteers for their enthusiastic participation in this work.
The content is solely the responsibility of the authors and does not necessarily represent the official views of the National Institutes of Health. The authors declare no conflict of interest.
Footnotes
Supplementary Information accompanies the paper on the Journal of Cerebral Blood Flow & Metabolism website (http://www.nature.com/jcbfm)
This work was supported by the National Institute of Neurological Disorders and Stroke (NINDS) grant R01 NS035192. The Center for Magnetic Resonance Research is supported by National Center for Research Resources (NCRR) biotechnology research resource grant P41 RR008079, National Institute of Biomedical Imaging and Bioengineering (NIBIB) grant P41 EB015894, the Institutional Center Cores for Advanced Neuroimaging award P30 NS076408, NCRR grant S10 RR026783 and the WM KECK Foundation. Amir Moheet is supported by CTSA 5KL2TR000113. Research reported in this publication was supported by the National Center for Advancing Translational Sciences of the National Institutes of Health Award Number UL1TR000114.
Supplementary Material
References
- The Diabetes Control and Complications Trial Research Group The effect of intensive treatment of diabetes on the development and progression of long-term complications in insulin-dependent diabetes mellitus. New Engl J Med. 1993;329:977–986. doi: 10.1056/NEJM199309303291401. [DOI] [PubMed] [Google Scholar]
- Cryer PE. Mechanisms of hypoglycemia-associated autonomic failure and its component syndromes in diabetes. Diabetes. 2005;54:3592–3601. doi: 10.2337/diabetes.54.12.3592. [DOI] [PubMed] [Google Scholar]
- McCrimmon RJ, Oz G. Cerebral adaptation to recurrent hypoglycemia. Transl Endocrinol Metab. 2013;3:1–25. [Google Scholar]
- Mangia S, Tesfaye N, De Martino F, Kumar AF, Kollasch P, Moheet AA, et al. Hypoglycemia-induced increases in thalamic cerebral blood flow are blunted in subjects with type 1 diabetes and hypoglycemia unawareness. J Cereb Blood Flow Metab. 2012;32:2084–2090. doi: 10.1038/jcbfm.2012.117. [DOI] [PMC free article] [PubMed] [Google Scholar]
- Kennan RP, Takahashi K, Pan C, Shamoon H, Pan JW. Human cerebral blood flow and metabolism in acute insulin-induced hypoglycemia. J Cereb Blood Flow Metab. 2005;25:527–534. doi: 10.1038/sj.jcbfm.9600045. [DOI] [PubMed] [Google Scholar]
- Abdul-Rahman A, Siesjo BK. Local cerebral glucose consumption during insulin-induced hypoglycemia, and in the recovery period following glucose administration. Acta Physiol Scand. 1980;110:149–159. doi: 10.1111/j.1748-1716.1980.tb06645.x. [DOI] [PubMed] [Google Scholar]
- Ghajar JB, Plum F, Duffy TE. Cerebral oxidative metabolism and blood flow during acute hypoglycemia and recovery in unanesthetized rats. J Neurochem. 1982;38:397–409. doi: 10.1111/j.1471-4159.1982.tb08643.x. [DOI] [PubMed] [Google Scholar]
- Van de Ven KCC, De Galan BE, Van der Graaf M, Shestov AA, Henry P-G, Tack CJ, et al. Effect of acute hypoglycemia in on human cerebral glucose metabolism measured by 13C magnetic resonance spectroscopy. Diabetes. 2011;60:1467–1473. doi: 10.2337/db10-1592. [DOI] [PMC free article] [PubMed] [Google Scholar]
- Lubow JM, Pinon IG, Avogaro A, Cobelli C, Treeson DM, Mandeville KA, et al. Brain oxygen utilization is unchanged by hypoglycemia in normal humans: lactate, alanine, and leucine uptake are not sufficient to offset energy deficit. Am J Physiol Endocrinol Metab. 2006;290:E149–E153. doi: 10.1152/ajpendo.00049.2005. [DOI] [PubMed] [Google Scholar]
- Oz G, Kumar A, Rao JP, Kodl CT, Chow L, Eberly LE, et al. Human brain glycogen metabolism during and after hypoglycemia. Diabetes. 2009;58:1978–1985. doi: 10.2337/db09-0226. [DOI] [PMC free article] [PubMed] [Google Scholar]
- Horinaka N, Artz N, Jehle J, Takahashi S, Kennedy C, Sokoloff L. Examination of potential mechanisms in the enhancement of cerebral blood flow by hypoglycemia and pharmacological doses of deoxyglucose. J Cereb Blood Flow Metab. 1997;17:54–63. doi: 10.1097/00004647-199701000-00008. [DOI] [PubMed] [Google Scholar]
- Choi I-Y. In vivo measurements of brain glucose transport using the reversible Michaelis-Menten model and simultaneouls measurements of cerebral blood flow changes during hyupoglycemia. J Cereb Blood Flow Metab. 2001;21:653–663. doi: 10.1097/00004647-200106000-00003. [DOI] [PubMed] [Google Scholar]
- Brondsted HE, Gjedde A. Glucose phosphorylation rate in rat parietal cortex during normoglycemia, hypoglycemia, acute hyperglycemia, and in diabetes-prone rats. Acta Neurol Scand. 1990;81:233–236. doi: 10.1111/j.1600-0404.1990.tb00972.x. [DOI] [PubMed] [Google Scholar]
- Suda S, Shinohara M, Miyaoka M, Lucignani G, Kennedy C, Sokoloff L. The lumped constant of the deoxyglucose method in hypoglycemia: effects of moderate hypoglycemia on local cerebral glucose utilization in the rat. J Cereb Blood Flow Metab. 1990;10:499–509. doi: 10.1038/jcbfm.1990.92. [DOI] [PubMed] [Google Scholar]
- Norberg K, Siesio BK. Oxidative metabolism of the cerebral cortex of the rat in severe insulin-induced hypoglycaemia. J Neurochem. 1976;26:345–352. doi: 10.1111/j.1471-4159.1976.tb04487.x. [DOI] [PubMed] [Google Scholar]
- Choi IY, Seaquist ER, Gruetter R. Effect of hypoglycemia on brain glycogen metabolism in vivo. J Neurosci Res. 2003;72:25–32. doi: 10.1002/jnr.10574. [DOI] [PMC free article] [PubMed] [Google Scholar]
- Dawson RM. Studies on the glutamine and glutamic acid content of the rat brain during insulin hypoglycaemia. Biochem J. 1950;47:386–391. doi: 10.1042/bj0470386. [DOI] [PMC free article] [PubMed] [Google Scholar]
- Lewis LD, Ljunggren B, Norberg K, Siesjo BK. Changes in carbohydrate substrates, amino acids and ammonia in the brain during insulin-induced hypoglycemia. J Neurochem. 1974;23:659–671. doi: 10.1111/j.1471-4159.1974.tb04389.x. [DOI] [PubMed] [Google Scholar]
- Behar KL, den Hollander JA, Petroff OA, Hetherington HP, Prichard JW, Shulman RG. Effect of hypoglycemic encephalopathy upon amino acids, high-energy phosphates, and pHi in the rat brain in vivo: detection by sequential 1H and 31P NMR spectroscopy. J Neurochem. 1985;44:1045–1055. doi: 10.1111/j.1471-4159.1985.tb08723.x. [DOI] [PubMed] [Google Scholar]
- Sutherland GR, Tyson RL, Auer RN. Truncation of the krebs cycle during hypoglycemic coma. Med Chem. 2008;4:379–385. doi: 10.2174/157340608784872235. [DOI] [PubMed] [Google Scholar]
- Rao R, Ennis K, Long JD, Ugurbil K, Gruetter R, Tkac I. Neurochemical changes in the developing rat hippocampus during prolonged hypoglycemia. J Neurochem. 2010;114:728–738. doi: 10.1111/j.1471-4159.2010.06797.x. [DOI] [PMC free article] [PubMed] [Google Scholar]
- Bischof MG, Brehm A, Bernroider E, Krssak M, Mlynarik V, Krebs M, et al. Cerebral glutamate metabolism during hypoglycaemia in healthy and type 1 diabetic humans. Eur J Clin Invest. 2006;36:164–169. doi: 10.1111/j.1365-2362.2006.01615.x. [DOI] [PubMed] [Google Scholar]
- Criego AB, Tkac I, Kumar A, Thomas W, Gruetter R, Seaquist ER. Brain glucose concentrations in patients with type 1 diabetes and hypoglycemia unawareness. J Neurosci Res. 2005;79:42–47. doi: 10.1002/jnr.20296. [DOI] [PubMed] [Google Scholar]
- Clarke WL, Cox DJ, Gonder-Frederick LA, Julian D, Schlundt D, Polonsky W. Reduced awareness of hypoglycemia in adults with IDDM. A prospective study of hypoglycemic frequency and associated symptoms. Diabetes Care. 1995;18:517–522. doi: 10.2337/diacare.18.4.517. [DOI] [PubMed] [Google Scholar]
- Seaquist ER, Damberg GS, Tkac I, Gruetter R. The effect of insulin on in vivo cerebral glucose concentrations and rates of glucose transport/metabolism in humans. Diabetes. 2001;50:2203–2209. doi: 10.2337/diabetes.50.10.2203. [DOI] [PubMed] [Google Scholar]
- Towler DA, Havlin CE, Craft S, Cryer P. Mechanism of awareness of hypoglycemia. Perception of neurogenic (predominantly cholinergic) rather than neuroglycopenic symptoms. Diabetes. 1993;42:1791–1798. doi: 10.2337/diab.42.12.1791. [DOI] [PubMed] [Google Scholar]
- Tkac I, Oz G, Adriany G, Ugurbil K, Gruetter R. In vivo 1H NMR spectroscopy of the human brain at high magnetic fields: metabolite quantification at 4T vs. 7T. Magn Reson Med. 2009;62:868–879. doi: 10.1002/mrm.22086. [DOI] [PMC free article] [PubMed] [Google Scholar]
- Gruetter R, Tkac I. Field mapping without reference scan using asymmetric echo-planar techniques. Magn Reson Med. 2000;43:319–323. doi: 10.1002/(sici)1522-2594(200002)43:2<319::aid-mrm22>3.0.co;2-1. [DOI] [PubMed] [Google Scholar]
- Provencher SW. Automatic quantitation of localized in vivo 1H spectra with LCModel. NMR Biomed. 2001;14:260–264. doi: 10.1002/nbm.698. [DOI] [PubMed] [Google Scholar]
- Govindaraju V, Young K, Maudsley AA. Proton NMR chemical shifts and coupling constants for brain metabolites. NMR Biomed. 2000;13:129–153. doi: 10.1002/1099-1492(200005)13:3<129::aid-nbm619>3.0.co;2-v. [DOI] [PubMed] [Google Scholar]
- Provencher SW.LCModel and LCMgui User's Manual http://s-provencher.com/ .
- Moheet A, Emir UE, Terpstra M, Kumar A, Eberly LE, Seaquist ER, et al. Initial experience with seven tesla magnetic resonance spectroscopy of hypothalamic GABA during hyperinsulinemic euglycemia and hypoglycemia in healthy humans. Magn Reson Med. 2013;71:12–18. doi: 10.1002/mrm.24663. [DOI] [PMC free article] [PubMed] [Google Scholar]
- Henry PG, Criego AB, Kumar A, Seaquist ER. Measurement of cerebral oxidative glucose consumption in patients with type 1 diabetes mellitus and hypoglycemia unawareness using (13)C nuclear magnetic resonance spectroscopy. Metabolism. 2010;59:100–106. doi: 10.1016/j.metabol.2009.07.012. [DOI] [PMC free article] [PubMed] [Google Scholar]
- Van de Ven KCC, Van der Graaf M, Tack CJ, Heerchap A, De Galan BE. Steady-state brain glucose concentrations during hypoglycemia in healthy humans and patients with type 1 diabetes. Diabetes. 2012;61:1974–1977. doi: 10.2337/db11-1778. [DOI] [PMC free article] [PubMed] [Google Scholar]
- Mason GF, Petersen KF, Lebon V, Rothman DL, Shulman GI. Increased brain monocarboxylic acid transport and utilization in type 1 diabetes. Diabetes. 2006;55:929–934. doi: 10.2337/diabetes.55.04.06.db05-1325. [DOI] [PMC free article] [PubMed] [Google Scholar]
- Herzog RI, Jiang L, Herman P, Zhao C, Sanganahalli BG, Mason GF, et al. Lactate preserves neuronal metabolism and function following antecedent recurrent hypoglycemia. J Clin Invest. 2013;123:1988–1998. doi: 10.1172/JCI65105. [DOI] [PMC free article] [PubMed] [Google Scholar]
- Kreis R, Ross BD. Cerebral metabolic disturbances in patients with subacute and chronic diabetes mellitus: detection with proton MR spectroscopy. Radiology. 1992;184:123–130. doi: 10.1148/radiology.184.1.1319074. [DOI] [PubMed] [Google Scholar]
- Geissler A, Frund R, Scholmerich J, Feuerbach S, Zietz B. Alterations of cerebral metabolism in patients with diabetes mellitus studied by proton magnetic resonance spectroscopy. Exp Clin Endocrinol Diabetes. 2003;111:421–427. doi: 10.1055/s-2003-44289. [DOI] [PubMed] [Google Scholar]
- Duarte JM, Carvalho RA, Cunha RA, Gruetter R. Caffeine consumption attenuates neurochemical modifications in the hippocampus of streptozotocin-induced diabetic rats. J Neurochem. 2009;111:368–379. doi: 10.1111/j.1471-4159.2009.06349.x. [DOI] [PubMed] [Google Scholar]
- Stevens MJ, Lattimer SA, Kamijo M, Van Huysen C, Sima AA, Greene DA. Osmotically-induced nerve taurine depletion and the compatible osmolyte hypothesis in experimental diabetic neuropathy in the rat. Diabetologia. 1993;36:608–614. doi: 10.1007/BF00404069. [DOI] [PubMed] [Google Scholar]
Associated Data
This section collects any data citations, data availability statements, or supplementary materials included in this article.