

Graphical abstract
Keywords: Brain metabolism, 13C-labelling, Microdialysis, NMR, Traumatic brain injury, Human
Abstract
Human brain chemistry is incompletely understood and better methodologies are needed. Traumatic brain injury (TBI) causes metabolic perturbations, one result of which includes increased brain lactate levels. Attention has largely focussed on glycolysis, whereby glucose is converted to pyruvate and lactate, and is proposed to act as an energy source by feeding into neurons’ tricarboxylic acid (TCA) cycle, generating ATP. Also reportedly upregulated by TBI is the pentose phosphate pathway (PPP) that does not generate ATP but produces various molecules that are putatively neuroprotective, antioxidant and reparative, in addition to lactate among the end products.
We have developed a novel combination of 13C-labelled cerebral microdialysis both to deliver 13C-labelled substrates into brains of TBI patients and recover the 13C-labelled metabolites, with high-resolution 13C NMR analysis of the microdialysates. This methodology has enabled us to achieve the first direct demonstration in humans that the brain can utilise lactate via the TCA cycle. We are currently using this methodology to make the first direct comparison of glycolysis and the PPP in human brain.
In this article, we consider the application of 13C-labelled cerebral microdialysis for studying brain energy metabolism in patients. We set this methodology within the context of metabolic pathways in the brain, and 13C research modalities addressing them.
1. Introduction
1.1. Need for better understanding of energy metabolism in the injured human brain
Energy metabolism in the human brain is incompletely understood, even in the normal uninjured state. Moreover, following traumatic brain injury (TBI), a complex (and variable) sequence of pathological processes arises, in which cerebral energy perturbations appear to play a major role. A well-recognised feature is elevation of brain extracellular lactate and the lactate/pyruvate (L/P) ratio, associated with unfavourable clinical outcome (Timofeev et al., 2011). TBI-induced pathologies evolve over the scale of hours and days, and, despite treatment, may lead to a range of clinical outcomes from good recovery to varying degrees of disability or even death (Kolias et al., 2013). Historically, attention has focussed on ischaemia, leading to a deficiency in supply of oxygen, glucose and other blood-borne nutrients, falling short of the metabolic demands of the injured brain. Much has been learned in neuro-critical care management of patients, so that ischaemia is minimised by adopting modern protocol-driven therapy designed to maintain adequate cerebral perfusion whilst keeping intracranial pressure below a critical threshold. Survival rates, and quality of survival, have thus improved. Despite these advances, there is a growing recognition that, in some circumstances, diffusion barriers (Menon et al., 2004) or increased metabolic demands, e.g. by spreading depression (Parkin et al., 2005), may adversely affect the balance between substrate supply and demand, thus resulting in tissue hypoxia or reduced glucose availability. In other settings, despite seemingly adequate provision of metabolic fuels and oxygen, the injured brain is unable to efficiently utilise these substrates to generate cellular energy. This has sometimes been termed ‘mitochondrial dysfunction’ although the exact basis of this process is not understood. Increased reliance on glycolysis, which produces a low yield of ATP per molecule of glucose, followed by conversion of pyruvate to lactate, is often regarded as a consequence of mitochondrial dysfunction. Also, alternative pathways that consume glucose may become upregulated, such as the pentose phosphate pathway (PPP) that does not generate ATP but is potentially reparative. There is therefore a need to improve our understanding of the fundamental processes of brain energy metabolism, refine our clinical interventions to minimise this energy failure and, ultimately, generate specific strategies to optimise clinical outcome.
Until recently, understanding of energy metabolism has arisen through laboratory investigations, and the concepts applied to humans. Advances in technology are now enabling direct, detailed exploration of metabolism in man. Techniques available include microdialysis, nuclear magnetic resonance (NMR) spectroscopy, mass spectrometry, and in vivo magnetic resonance spectroscopy (MRS).
In this article, we consider the application of the novel technique of 13C-labelled cerebral microdialysis that we have developed for studying brain energy metabolism in patients (Gallagher et al., 2009). We set this methodology within the context of metabolic pathways in the brain, and 13C research modalities addressing them.
1.2. Fundamental biochemistry of energy metabolism
Energy metabolism is the overall process through which living systems acquire and utilise the energy they need to carry out various functions. Humans, like other chemoorganotrophs, obtain this energy by oxidising organic compounds, notably carbohydrates, lipids and proteins. This energy is coupled to endergonic reactions resulting in the synthesis of high-energy phosphate compounds, specifically adenosine triphosphate (ATP). The primary organic compound utilised by humans is glucose. ATP is generated by a sequence of three well-recognised processes (Fig. 1), as follows:
-
(a)
Glycolysis: This is the linear pathway (also termed Embden–Meyerhof–Parnas pathway, or the Embden–Meyerhof pathway) by which glucose is converted (via several intermediates) to pyruvate, thereby generating 2 molecules of ATP per molecule of glucose. Glycolysis does not involve molecular oxygen. After glycolysis, under aerobic conditions, pyruvate is converted to acetyl CoA and enters the tricarboxylic acid (TCA) cycle (see (b), below). Under anaerobic conditions, and/or if the mitochondria are dysfunctional, pyruvate is converted by the enzyme lactate dehydrogenase to lactate, while converting nicotinamide adenine dinucleotide (NADH) to NAD+. The L/P ratio can therefore be used as an indicator of the comparative degree of “aerobic” vs. “anaerobic” metabolism. One of the intermediates in glycolysis, glucose-6-phosphate, can also be metabolised via the PPP initially generating nicotinamide adenine dinucleotide phosphate (NADPH) and ribulose-5-phosphate that undergo further reactions (see below). Both glycolysis and the PPP occur in the cytosol.
-
(b)
Tricarboxylic acid (TCA) cycle: This cyclical pathway (also termed citric acid cycle or Krebs cycle) comprises a series of 8 reactions that oxidise the acetyl group of acetyl-coenzyme A (acetyl-CoA) producing 3 molecules of NADH, one molecule of flavin adenine dinucleotide (FADH2), and one molecule of guanosine triphosphate (GTP). The TCA cycle takes place in mitochondria.
-
(c)
Oxidative phosphorylation: This is a process occurring in mitochondria through which NADH and FADH2 from the TCA cycle are oxidised by oxygen in the electron transport chain resulting in the synthesis of further molecules of ATP. Also, the succinate to fumarate step of the TCA cycle takes place directly on part of the electron transport chain (Complex 2) thereby promoting ATP synthesis.
Fig. 1.

Simplified schematic of major energy pathways in the brain include glycolysis, which takes places in the cytosol and produces pyruvate, which enters mitochondria and is converted into acetyl CoA that enters the TCA cycle. Alternatively, pyruvate can stay in the cytosol and is converted into lactate that is exported out of the cell. The pentose phosphate pathway (PPP) takes place in the cytosol and is an alternative energy pathway that can be up-regulated after injury; it is an important source of NADPH used to produce the reduced form of glutathione (GSH) for preventing oxidative stress.
Overall, one molecule of glucose, in the presence of oxygen, processed via this three-stage pathway (glycolysis, TCA cycle and oxidative phosphorylation), yields a net production of 36 molecules of ATP.
1.3. Brain energy metabolism
While glucose is recognised as the primary substrate in most organs, including muscle, recent evidence suggests that the situation in the brain is considerably more complex, particularly in relation to the main cell types. The traditional view is that both glia and neurones metabolise glucose as the preferred substrate via glycolysis to pyruvate, which is converted to acetyl CoA and enters the TCA cycle resulting in the generation of ATP by oxidative phosphorylation. Recent evidence suggests, however, that the neurones may utilise lactate (classically perceived as a waste product) as an energy substrate. Fig. 2 outlines a scheme of metabolic trafficking between astrocytes and neurons. This theory, later termed the astrocyte-neuron lactate shuttle (ANLS) hypothesis, was originally proposed (Pellerin and Magistretti 1994) as a result of in vitro studies and has been later supported by studies in animals e.g. (Tyson et al., 2003). Moreover, our recent microdialysis studies using 13C-labelling have demonstrated that the injured human brain can metabolise lactate via the TCA cycle (Gallagher et al., 2009) (Figs. 3 and 4).
Fig. 2.

Glucose (Glc) from the vasculature is metabolised to lactate (Lac) in astrocytes, exported into the extra-cellular fluid, taken up by neurons and processed (via pyruvate (Pyr) and acetate (Ac)) by the TCA cycle. This spins off glutamate (Glt), which is released and then taken up by astrocytes, which convert it to glutamine (Gln), which is released into the extra-cellular fluid and taken up by neurons, which re-convert it to glutamate (Gallagher et al., 2009). Figure originally published in Brain (Gallagher et al., 2009).
Fig. 3.

Some examples of 13C-labelling patterns in brain metabolism, based on results with singly labelled substrates (Gallagher et al., 2009; Tyson et al., 2003). Turquoise fills indicate 13C atoms. Yellow highlight indicates the metabolic pathway by which 13C-labelled lactate is processed via the TCA cycle, emerging as 13C-labelled glutamate or 13C-labelled glutamine that can be recovered in brain microdialysates. (For interpretation of the references to colour in this figure legend, the reader is referred to the web version of this article.)
Fig. 4.
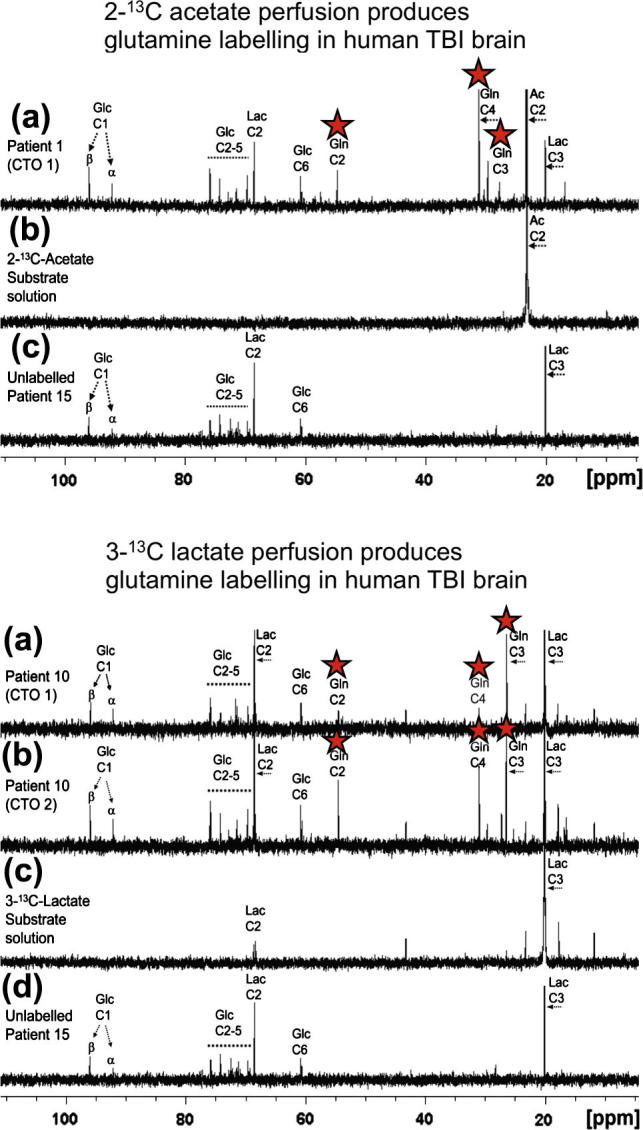
Upper panel: (a) Example of 13C NMR spectrum of brain microdialysate from a TBI patient, who received perfusion with 2-13C acetate (4 mM) by a microdialysis catheter via a craniotomy (CTO); red stars indicate 13C signals for glutamine C4, C3 and C2 indicating metabolism via TCA cycle. (b) 13C NMR spectrum of the 2-13C acetate substrate solution prior to perfusing. (c) 13C NMR spectrum of brain microdialysate from an unlabelled patient whose microdialysis catheter was perfused with plain perfusion fluid without labelled substrate. Lower panel: (a) and (b) Examples of 13C NMR spectra of brain microdialysates from a TBI patient, who received perfusion with 3-13C lactate (4 mM) by microdialysis catheters via a craniotomy (CTO); red stars indicate 13C signals for glutamine C4, C3 and C2 indicating metabolism via TCA cycle. (c) 13C NMR spectrum of the 3-13C lactate substrate solution prior to perfusing. (d) 13C NMR spectrum of brain microdialysate from an unlabelled patient (as in Upper panel (c)). Abbreviations: see Fig. 2 legend. For further details, see (Gallagher et al., 2009). Figures originally published in Brain (Gallagher et al., 2009).
Cerebral metabolism following injury appears to differ from that of the normal brain, although the full extent and nature of these changes are poorly understood, especially in man. The best-known metabolic characteristic of injured brain is a high L/P ratio (>25 is interpreted as ischaemia or mitochondrial dysfunction) (Bellander et al., 2004; Hillered et al., 2006; Hillered et al., 2005; Persson and Hillered 1992; Persson et al., 1996). Our study of 233 TBI patients demonstrated that microdialysate L/P ratio >25 predicted unfavourable outcome in a multivariate analysis in addition to previously known predictors of outcome (Timofeev et al., 2011).
Low extracellular lactate levels, associated with better outcomes (Timofeev et al., 2011), might be because astrocytic glycolysis-derived lactate is being efficiently taken up by neurons and utilised via the TCA cycle (Gallagher et al., 2009). Conversely, high extracellular lactate may result if neurons are too damaged to efficiently utilise the lactate being produced by astrocytes, i.e. uncoupling of neuronal and glial metabolism.
1.4. Alternative pathways
1.4.1. Pentose phosphate pathway
As well as the fundamental pathways outlined in Section 1.2, other pathways may also be relevant, for example the PPP (Fig. 5), also termed the hexose monophosphate shunt, a complex detour (hence the name “shunt”) that bypasses some of the steps of glycolysis. Glucose enters the cell, and becomes phosphorylated to give glucose-6-phosphate as in glycolysis, but then in the PPP it is diverted through a different set of enzymatic reactions. Glucose-6-phosphate is oxidised to 6-phosphogluconolactone by glucose-6-phosphate dehydrogenase, the rate-limiting step of the PPP. NADP+ is a cofactor, and NADPH is produced. Subsequently 6-phosphogluconolactone is converted to 6-phosphogluconate, and then C1 of the 6-carbon sugar skeleton is lost as CO2, together with conversion of NADP+ to NADPH, and formation of ribulose-5-phosphate (5-carbon sugar, a pentose). The aforementioned steps are termed the oxidative phase of the PPP. The subsequent steps are termed the non-oxidative phase of the PPP, in which the 5-carbon skeleton undergoes various transformations and recombinations generating intermediate molecules with 3–7 carbon atoms. The 5-carbon (pentose) sugar ribose-5-phosphate can be utilised in nucleic acid synthesis, providing reparative building blocks for the injured tissue, while the 4-carbon sugar erythrose-4-phosphate can be utilised in the synthesis of aromatic amino acids. The NADPH generated by the oxidative phase of the PPP provides reducing equivalents for the synthesis of fatty acids (e.g. for repairing injured tissue) and for the formation of the reduced form of glutathione (GSH), an essential co-factor for glutathione peroxidases (GPx), a family of enzymes that remove hydroperoxides, thereby combating oxidative stress. While the activity of the PPP thus appears potentially reparative, it neither consumes nor generates ATP. The exit-points of the PPP involve the re-entry of products fructose-6-phosphate and glyceraldehyde-3-phosphate (these can alternatively be recycled back into the PPP to generate more NADPH) into the main stream of glycolysis, producing pyruvate, which can enter mitochondria, form acetate and enter the TCA cycle, or pyruvate can be converted to lactate in the cytosol and exit into the extracellular fluid.
Fig. 5.

Simplified schematic of steps in glycolysis and the pentose phosphate pathway (PPP), showing 13C labelling patterns resulting from 1,2-13C2 glucose substrate. Red fills indicate 13C atoms. Abbreviations: Glc-6-P, glucose-6-phosphate; 6PGL, 6-phosphogluconolactone; F6P, fructose-6-phosphate; G3P, glyceraldehyde-3-phosphate; PYR, pyruvate.
Overall, 3 molecules of glucose-6-phosphate (6-carbon sugar) that enter the PPP lose 3 molecules of CO2 while converting 6 molecules of NADP+ to 6 molecules of NADPH, and producing 3 molecules of ribulose-5-phosphate (5-carbon sugar) which, via several intermediates (3–7 carbons), result in 2 molecules of fructose-6-phosphate (6-carbon sugar) and 1 molecule of glyceraldehyde-3-phosphate (3-carbon molecule). However the stoichiometry is not necessarily so straightforward, as some of the 5-carbon and 4-carbon sugar intermediates can be taken out of the PPP by conversion to nucleic acids and amino acids respectively, and some of the fructose-6-phosphate (6-carbon sugar) and glyceraldehyde-3-phosphate (3-carbon molecule) that are PPP products can be recycled back into the PPP, potentially generating more NADPH, as mentioned above.
Pre-clinical evidence from 13C-labelling and NMR suggests that the utilisation of glucose following injury differs from normal, with an increased flux through the PPP, which is upregulated by cellular stress, demonstrated in animals, e.g. brain injury (controlled cortical impact or fluid percussion injury) with brain tissue extracts analysed ex vivo using 13C NMR (Bartnik et al., 2007; Bartnik et al., 2005), or hypothermia with brain tissue extracts analysed ex vivo by 1H-observe [13C-edited] spin-echo difference NMR (Kaibara et al., 1999). The idea of an increased PPP flux was supported by the results of an indirect measure in a small study of TBI patients (n = 6) vs. healthy controls (n = 6), using arterio-jugular venous difference (AJVD) with 1,2-13C2 glucose (intravenous infusion) as the substrate with gas chromatography–mass spectrometry (GC–MS) used for analysing the products including 13C-labelled lactate in arterial and jugular venous blood (Dusick et al., 2007). However, the AJVD methodology could only produce relevant 13C results in periods when the brain was showing net export of lactate, as opposed to net import, which can happen in some periods (Dusick et al., 2007; Jalloh et al., 2013), and the findings of Dusick et al. have yet to be confirmed in human brain directly. We are currently using 1,2-13C2 glucose substrate perfused via cerebral microdialysis catheters in TBI patients, with analysis of lactate 13C labelling in microdialysates, using 13C NMR (see Section 3.1).
Using 1,2-13C2 glucose as the substrate, the products downstream of the PPP include lactate singly labelled at the C3 position, showing as a singlet in the 13C NMR spectrum (Fig 5). Lactate produced via glycolysis (without going through the PPP) is doubly labelled with 13C at both the C3 and C2 positions of lactate within the same molecule, showing as a doublet for C3 (Fig. 5), and a doublet for C2. The ratio of C3 singlet to C3 doublet signal intensities (peak area ratios) can be used as a measure of lactate production by PPP vs. glycolysis. Bartnik and colleagues used this approach in pre-clinical studies of brain injury in rats (Bartnik et al., 2007; Bartnik et al., 2005). Brain tissue extracts from the control rats (uninjured, sham-operated) in these studies showed lactate C3 doublet indicative of glycolysis, while C3 singlet was undetectable, i.e. no detectable lactate via the PPP (Bartnik et al., 2007; Bartnik et al., 2005). In the same studies, for brain tissue extracts from the brain-injured rats (controlled cortical impact or fluid percussion injury), Bartnik and colleagues reported detectable lactate C3 singlet and C3 doublet, with up to 13% PPP which they calculated using the lactate C3 singlet/doublet ratio (Bartnik et al., 2007; Bartnik et al., 2005). Endogenous lactate, which naturally contains 1.1% 13C at each position, also gives a singlet for each carbon. Therefore, unless the endogenous lactate signal is negligible, the lactate singlet C3 signal needs correcting to subtract any background contribution from natural abundance, before calculating its ratio to the C3 doublet. Endogenous extracellular lactate concentrations are usually quite high (e.g. 2–4 mM) in brain microdialysates of TBI patients (Timofeev et al., 2011), and are readily detectable, even in TBI patients without 13C labelling, by 13C NMR on the Bruker Avance 500 MHz spectrometer with a cryoprobe (Gallagher et al., 2009) (see Fig. 4). Therefore in our current ongoing lactate labelling studies using 1,2-13C2 glucose as the substrate, we are making allowance for background in evaluating the results. For further considerations about 13C natural abundance background, see Section 4.3.
A model has been developed by Lee and colleagues using 1,2-13C2 glucose as the substrate, whereby labelling patterns produced in lactate are used to calculate the fraction of glucose metabolic flux that occurs via the pentose cycle (PC), as defined (Lee et al., 1998). Some of assumptions of the model stated by Lee and colleagues include that glucose is mostly metabolised by either the Embden Meyerhof or the pentose pathway, the pentose phosphate produced is recycled to hexose phosphate, and net loss of pentose phosphate to nucleic acid synthesis is relatively small. While a full discussion of the model and all of its assumptions and limitations is outside the scope of the present article for reasons of length, some of the model’s key features are as follows. The initial 1,2-13C2 glucose study was in vitro in HepG2 (hepatoma) cells (Lee et al., 1998). This used GC–MS to measure isotopomer yields of lactate molecules, i.e. the abundances (expressed as molar fraction) of ions with no 13C (m0), one 13C (m1) and two 13C (m2), after correcting for natural abundance of 13C (see Section 4.3); note that m0 + m1 + m2 = 1. The formula PC = (m1/m2)/[3 + (m1/m2)] was derived. This model was later applied in vivo in TBI patients, with intravenous infusion of 1,2-13C2 glucose substrate and ex vivo GC–MS analysis of lactate labelling in arterial and jugular venous blood (Dusick et al., 2007); see above. GC–MS reveals how many 13C atoms are present in the molecule, but does not distinguish the intra-molecular positions of these 13C atoms. Lactate derived from 1,2-13C2 glucose via glycolysis shows m2 labelling revealed by GC–MS, due to 13C at both C2 and C3 of lactate adjacent together within the same molecule, as revealed by NMR (see above). Singly labelled lactate derived from 1,2-13C2 glucose via the PPP shows m1 labelling revealed by GC–MS. Primarily this single 13C appears at the C3 position of lactate, although recycling within the PPP may result in 13C also appearing as single labelling at C2, and as single labelling at C1, all of which would show as lactate m1 labelling on GC–MS, without distinguishing between the positions of the 13C (Lee et al., 1998). Another potential process whereby lactate single labelling may appear “scrambled” is if 3-13C pyruvate interacts with the TCA cycle via the action of malic enzyme (ME), producing lactate with a mixture of single labelling at C3 or C2 (Fig. 3).
The implications of the PPP for energy generation are still not fully understood. The PPP may be regarded as sacrificing some of the carbon atoms from the cells’ supply of glucose (which could otherwise have been used for ATP generation), for the sake of generating more reducing power (NADPH) and the ability to protect, repair or build cells. While the PPP appears upregulated by injury, it also appears up-regulated in cancer (Riganti et al., 2012). Glycolysis also appears upregulated in cancer, a phenomenon termed the Warburg effect (Warburg 1956). Tumours are often highly glycolytic producing large amounts of lactate regardless of the presence of oxygen (Bensinger and Christofk 2012; Warburg 1956). Both the PPP and the Warburg effect may represent potential therapeutic targets. Unlabelled cerebral microdialysis has been used to study brain chemistry in glioma patients (Marcus et al., 2010), and in future such studies may be extended by use of 13C-labelled microdialysis.
1.4.2. Anaplerosis
While the well-recognised main entry point into the TCA cycle is where acetyl-CoA joins with oxaloacetate to form citrate, additional entry points exist (Owen et al., 2002), termed anaplerotic reactions (meaning “filling up” or “replenishing”). For example, while the main pathway for pyruvate involves the enzyme pyruvate dehydrogenase (PDH), which converts pyruvate to acetyl CoA that enters the TCA cycle, an anaplerotic pathway involves the reaction of pyruvate with CO2 by the action of pyruvate carboxylase (PC) producing oxaloacetate, which is a TCA cycle intermediate (Fig. 3). Anaplerosis is necessary because as well as the TCA cycle generating ATP via mitochondrial oxidative phosphorylation, its intermediates are also sources of amino acids and other molecules for the cell. A notable exit point is at alpha-ketoglutarate, a TCA cycle intermediate that can be converted to glutamate, and thence to glutamine (Fig. 3). The TCA cycle thus needs replenishment, provided by anaplerosis. Fig. 3 illustrates that 13C-labelling patterns in the emerging glutamate and glutamine can differentiate between TCA cycle anaplerosis (grey arrows), with pyruvate entry via PC activity, and mainstream TCA cycle (red arrows), with pyruvate entry via PDH and acetyl CoA (Tyson et al., 2003).
2. Microdialysis as a tool for monitoring cerebral metabolism
2.1. Cerebral microdialysis in multimodal monitoring
Monitoring of severe TBI patients in neuro-critical care may include intracranial pressure, brain tissue oxygen and extracellular chemistry using microdialysis. Clinical microdialysis catheters (M Dialysis AB, Stockholm, Sweden) are often inserted through a burr-hole via a cranial access device e.g. a triple-lumen “bolt” (Technicam, Newton Abbot, UK), which allows up to 2 other probes (e.g. for intracranial pressure and brain tissue oxygen monitoring) to be inserted alongside the microdialysis catheter into brain. Microdialysis catheters can also be inserted via craniotomy, without a cranial access device. While insertion via a cranial access device orients the catheter perpendicularly into the brain, the craniotomy situation provides the option of orienting the microdialysis catheter at a shallow angle (i.e. tangentially), to target grey matter (Gallagher et al., 2009). Grey matter can also be contacted by a perpendicularly oriented catheter deeper within the brain, because of the folded nature of the cortex, although this is more difficult to target. The position of the catheter after insertion can be verified using computed tomography (by virtue of the catheter’s gold tip), or magnetic resonance imaging (MRI) (Fig. 6).
Fig. 6.

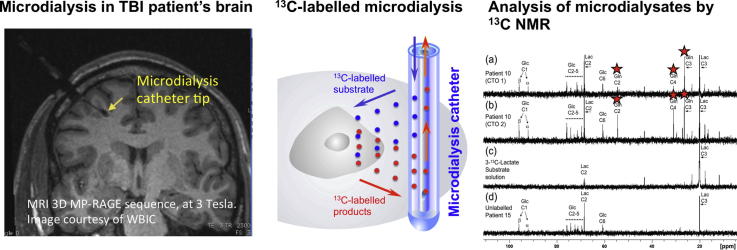
Left panel: Magnetic resonance imaging (MRI) scan, using 3D MP-RAGE sequence, at 3 Tesla, showing the brain of a TBI patient with a microdialysis catheter (via a cranial access device) in position, the catheter tip indicated by an arrow (yellow). Scale bar (green) shows centimetre divisions. Image is courtesy of the Wolfson Brain Imaging Centre, Dept. of Clinical Neurosciences, University of Cambridge. Right panel: Schematic of 13C-labelled microdialysis. (For interpretation of the references to colour in this figure legend, the reader is referred to the web version of this article.)
Clinical microdialysis catheters possess a semi-permeable membrane (nominal molecular weight cutoff either 20 or 100 kDa) that is continuously perfused with fluid, allowing molecules to diffuse across the membrane, to and from the brain’s extracellular space. For routine clinical monitoring, the catheter is perfused with a physiological salt solution e.g. CNS perfusion fluid (M Dialysis AB, Stockholm, Sweden) and the returning fluid (microdialysate) is analysed at the bedside utilising automated enzymatic colorimetric assays (CMA600 or ISCUS microdialysis analyzer, M Dialysis AB) to measure endogenous glucose, lactate, pyruvate, glutamate and glycerol. Thus, microdialysis has been used to monitor glucose delivery and the balance between aerobic and anaerobic metabolism using the L/P ratio (Timofeev et al., 2011). For our 13C labelling studies, the 13C labelled substrate (manufactured by Cambridge Isotope Laboratories Inc., Tewkesbury/Andover, MA) is formulated at an appropriate concentration in CNS perfusion fluid, in a hospital pharmacy manufacturing unit, with tests for conformity to standard pharmaceutical regulations for purity, sterility, and freedom from pyrogens. The 13C labelled substrate formulation is then analysed by high resolution 13C NMR to ensure that there are no impurities that would compromise the studies. The formulated 13C labelled substrate is then pumped through the microdialysis catheter in the usual way, and microdialysates collected for analysis (Gallagher et al., 2009).
2.2. Cerebral microdialysis for conveying molecules to and from the extracellular space
As diffusion across the microdialysis membrane is bi-directional, microdialysis can deliver molecules (“retrodialysis” e.g. 13C-labelled substrates), thereby micro-dosing a region of interest around the catheter tip, whilst simultaneously collecting the downstream products in the emerging microdialysate, for analysis in the laboratory (see Fig. 6 for schematic). In this way, we showed that infusion of 3-13C-lactate or 2-13C acetate into the brains of TBI patients via the microdialysis catheter produced 13C signals for glutamine C4, C3 and C2 in the emerging microdialysates, indicating TCA cycle operation followed by conversion of glutamate to glutamine (Gallagher et al., 2009) (Figs. 3 and 4). Microdialysis can thus be used to probe the immediate microenvironment around the catheter by adding chosen 13C-labelled metabolic substrates that enter the biochemical pathway at different steps, allowing relevant stages to be investigated. The extent of the region addressed by the microdialysis catheter is not precisely known. In a combined FDG-PET and cerebral microdialysis study (without 13C-labelling) in TBI patients, the cerebral metabolic rate of glucose measurements in a 2 cm region of interest around the microdialysis catheter tip correlated significantly with endogenous lactate and pyruvate concentrations in the microdialysates (Hutchinson et al., 2009).
3. Nuclear magnetic resonance (NMR) spectroscopy modalities for the evaluation of cerebral metabolism
3.1. Utility of NMR spectroscopy
NMR spectroscopy is well established as a powerful analytical technique for determining the structures of organic molecules. Labelling molecules, e.g. with 13C, enables their passage to be tracked along biochemical pathways, revealing the positions of the labelled atoms within metabolite molecules contained in biological samples. An example of 13C-labelled positions within molecules along metabolic pathways is illustrated in Fig. 3. Using cerebral microdialysis to deliver and collect 13C-labelled molecules in this context is a novel development (Gallagher et al., 2009).
Examples of 13C NMR spectra of brain microdialysates are illustrated in Fig. 4 (Gallagher et al., 2009). These illustrate that microdialysis perfusion with 2-13C acetate or 3-13C lactate produced 13C signals for glutamine C4, C3 and C2, indicating TCA cycle operation followed by conversion of glutamate to glutamine in TBI patients’ brains.
In our current ongoing study, microdialysis perfusion with 1,2-13C2 glucose has resulted in 13C signals clearly visible as doublets for the C3 (and C2) of lactate, indicating glycolysis as a major pathway in TBI patients’ brains as expected. Small enrichment above natural abundance 13C was measurable in the lactate C3 singlet representing PPP production of lactate in brain. The PPP pathway is shown schematically in Fig. 5. Examples of the lactate C3 doublet and singlet pattern in 13C spectra of patients’ brain microdialysates are shown in Fig. 7 (Jalloh et al., unpublished data). No lactate C3 singlet enrichment was detectable in muscle above natural abundance, though glycolysis-derived lactate (C3 doublet) was seen.
Fig. 7.

Examples of 13C NMR spectra of brain microdialysates from patients who received 1,2-13C2 glucose (4 mM) perfused via the microdialysis catheter (Jalloh et al., unpublished data). Uninjured brain is normal-appearing brain in a patient operated on for a benign tumour elsewhere in the brain. TBI brain is from a traumatic brain injury patient with diffuse injury. The part of the spectrum illustrated in each case is for the C3 carbon of lactate. Also present in this part of the spectrum is one of the signals due to the internal standard DSS (2,2-dimethyl-2-silapentane-5-sulfonate sodium salt). The remainder of the spectrum, including the main DSS signal (at 0 ppm) is not shown. The C3 doublet indicated by red stars represents lactate doubly labelled with 13C, produced by glycolysis; the C3 signal for 13C is split into 2 peaks by coupling to 13C also present at the neighbouring C2 position within the same molecule. The C3 singlet indicated by green stars represents lactate singly labelled with 13C, produced via the PPP; the singlet also contains a contribution from endogenous lactate due to the natural abundance background of 13C (1.1% of all carbon atoms).
Our novel combination of 13C-labelled microdialysis with analysis by high-resolution 13C NMR was the first direct demonstration in humans that the brain can utilise lactate via the TCA cycle (Gallagher et al., 2009), supporting the ANLS hypothesis (Pellerin and Magistretti 1994) (see Section 1.3). In our current study the 13C labelling patterns suggest that in TBI patients’ brains lactate production is mainly via glycolysis while PPP production of lactate is minor (see above). Further analyses of samples and data are ongoing in this study, which is the first direct comparison of glycolysis and PPP in human brain by 13C-labelled cerebral microdialysis. The technique will be extended to other substrates to further elucidate brain chemistry.
3.2. Ex vivo NMR of brain tissue extracts
In conventional studies of cerebral metabolism without microdialysis, 13C-labelled substrates are given intravenously to animals and then after appropriate time intervals the brains are removed and extracted (e.g. with perchloric acid) and NMR spectroscopy of the extracts (liquid solutions) is performed to determine 13C labelling in the products, either by using direct 13C-observe NMR e.g. (Bartnik et al., 2007; Bartnik et al., 2005), or indirect 1H-observe [13C-edited] NMR techniques such as spin-echo difference e.g. (Tyson et al., 2003). Analysis of brain tissue extracts ex vivo can give a global whole-brain picture of metabolism, or alternatively dissection of the brain prior to extraction can give region-specific information. Brain tissue extracts encompass both intra- and extra-cellular molecules, but are not available from humans unless they are undergoing surgery that excises portions of brain tissue (e.g. tumours, severe epilepsy), and cannot give a time-course within-subject; moreover in pre-clinical studies the animals have to be sacrificed.
NMR analysis can be performed directly on “solid” samples e.g. excised tissues (without having to extract the molecules), by high-resolution magic angle spinning NMR spectroscopy (HR-MAS NMR). By means of spinning samples at the “magic angle” (54.7° between the axis of rotation and the magnetic field), line-broadening processes such as dipole–dipole couplings, chemical shift anisotropy and magnetic susceptibility changes are significantly reduced for solid samples (Andrew et al., 1959). The tissue sample is placed in a small container termed a rotor (e.g. made of zirconium, 50 μl volume, 4 mm diameter), and is spun (e.g. at 5000 Hz) at a 54.7° angle inside the NMR magnet. This has been applied to characterise cells e.g. neuronal and glial cells grown in vitro studied by 1H HR-MAS NMR (Griffin et al., 2002), surgically excised tissue e.g. a 1H HR-MAS NMR study of human glioblastoma tissue (Piccirillo et al., 2012), and in 13C-labelling studies, e.g. a 13C HR-MAS NMR study of brain tissue (21–34 mg samples) from rats given intravenous 1,6-13C2 glucose (Risa et al., 2009).
3.3. NMR modalities: direct vs. indirect observation of 13C
NMR spectroscopy for measuring 13C-labelling can be either direct 13C-observe, or indirect 1H-observe [13C-edited]. An example of the latter is spin-echo difference spectroscopy e.g. (Tyson et al., 2003). The latter technique generates (a) a 1H NMR spectrum showing positive signals (upward-pointing peaks) from all protons, regardless of whether they are attached to 12C or 13C atoms, (b) a 1H spectrum in which protons attached to 12C give positive peaks but protons attached to 13C give inverted (negative, downward-pointing) peaks, and (c) a 1H difference spectrum, consisting of (a) minus (b) so that the peaks from protons attached to 12C are subtracted out and the peaks for protons attached to 13C appear positive.
While the indirect 1H-observe [13C-edited] spin-echo difference modality is more sensitive than the direct 13C-observe, the indirect modality is more complex to perform and interpret (see Section 3.4). An advantage of the spin-echo difference modality is that it gives information on fractional enrichment, i.e. 13C/(12C + 13C), by comparing the difference spectrum (c), which reveals protons attached to 13C, with the “all protons” spectrum (a) (see above). However, the 13C spectrum itself is unseen and there is no information on carbons without attached protons (e.g. carboxylate or ketone carbon).
For direct 13C-observe NMR, enrichments are determined by quantifying the 13C signal (by integration, i.e. measuring the peak areas, with reference to standards) and quantifying the “total” (labelled plus unlabelled) for the species of interest, either using direct 1H-observe NMR (integrating the signal with reference to standards), or by another analytical method such as HPLC or enzymatic colorimetric assays. To facilitate integrating NMR signals, peak fitting is available in NMR software packages (e.g. TopSpin and Chenomx). Reference standards consist of (a) an internal standard water-soluble reference substance, e.g. DSS (2,2-dimethyl-2-silapentane-5-sulfonate sodium salt) which provides a chemical shift reference point at zero ppm (x-axis of the spectrum) and acts as a reference for the signal response (y-axis) as it is added at a known, set concentration into every sample, and (b) an external standard calibration curve consisting of the molecular species of interest at an appropriate range of concentrations, plus DSS at the same fixed concentration as in (a). For direct 13C-observe NMR, the integrated signal intensity per 13C atom, i.e. the response factor, is not necessarily uniform (due to a natural effect termed Nuclear Overhauser Enhancement and other spin relaxation processes), so for each carbon position within each molecular species of interest, calibration has to be carried out.
The NMR modalities of direct 13C-observe, direct 1H-observe, and indirect 1H-observe [13C-edited] spin-echo difference each produce “one-dimensional” (1-D) spectra with signal response (y-axis) plotted vs. chemical shift (x-axis). Another NMR modality that is recently becoming applied to study metabolism is “two-dimensional” (2-D) NMR. For 1H-13C 2-D NMR, the analysis uses a 1H-optimised probe for acquisition with 13C-decoupling, and results are typically presented as a rectangular plot with a 1H-spectrum displayed along one axis (x or y), a 13C-spectrum along the second axis (y or x), and contours of the cross-peaks representing 1H–13C coupling in the “body” of the rectangle. Joining up the cross-peaks to the x- and y-axes establishes which carbons are connected to which protons. One type of 1H–13C 2-D spectroscopy is HSQC (heteronuclear single quantum coherence). This combines the high sensitivity of 1H spectroscopy with the high information content of 1H and 13C and their connectivity. It is more powerful than 1-D techniques for yielding unambiguous structural / identification information, largely overcoming the problems of unresolved signals that in some cases affect 1-D spectra (e.g. due to near-coincidences in chemical shift, and/or overlapping signals). 1H–13C HSQC was one of the techniques used to analyse the products of intravenous U-13C glucose in lung cancer patients, in a stable-isotope resolved metabolomics study (Fan et al., 2009). We have begun to use 2-D 1H–13C HSQC in selected cases, for additional verification of labelled products of 13C-labelled microdialysis, after routine 1-D 13C spectra and 1-D 1H spectra. We are also further interrogating the 1H spectra of the microdialysates by 2-D 1H–1H DQF-COSY (double quantum filtered correlation spectroscopy).
3.4. In vivo magnetic resonance spectroscopy
A 13C measurement technique applicable to both animals and humans is in vivo magnetic resonance spectroscopy (MRS). Though the description “nuclear” is generally not applied, the fundamental phenomenon is the same as in NMR. MRS is used in conjunction with MRI to measure the levels of metabolites in situ in chosen locations within body tissues, including regions of interest in the brain and is applied clinically to produce a “signature” which can assist diagnosis of certain disorders, e.g. tumours.
Microdialysis and MRS are complementary techniques, microdialysis focussing on the extracellular space, with MRS measuring combined extra- and intra-cellular metabolism. In addition, unlike microdialysis, which can only report on metabolic processes in the vicinity of the catheter, localised MRS can interrogate metabolism in multiple brain regions (using either natural abundance 13C MRS, or systemically administered 13C-labelled substrate). MRS could therefore allow comparison of metabolism in different tissue compartments (e.g. perilesional vs. normal appearing tissue). Comparison of extracellular chemistry in two sites within the same patient’s brain necessitates inserting a microdialysis catheter in each location, which is sometimes performed in clinical research. MRS can provide scope for non-invasive exploration of regional chemistry differences in brain.
Routine MRS on clinical MRI scanners usually measures 1H spectra in unlabelled brains. However, in research studies, direct in vivo MRS observation of 13C in brain has been performed with 1-13C glucose intravenous infusion in healthy human volunteers (Gruetter et al., 1994) and in patients (Moreno et al., 2001). These 13C-labelling studies have enabled glucose metabolism to be tracked to formation of glutamate and glutamine and in some cases TCA cycle rates have been estimated from the data e.g. (Mason et al., 1995). Also, 2-13C acetate intravenous infusions in healthy volunteers have enabled measurement, by direct 13C in vivo MRS, of astroglial metabolism to glutamate and glutamine (Lebon et al., 2002). There is much future scope for expanding the use of in vivo MRS in clinical studies utilising 13C labelling.
An alternative, indirect in vivo MRS method of detecting 13C labelling in brain utilises 1H-observe [13C-edited] spectroscopy, often abbreviated as POCE (proton observe, carbon edited) (Chen et al., 2001). It is more sensitive than directly-observed 13C MRS, since proton (1H) is inherently a more readily detectable nucleus than 13C (de Graaf et al., 2011). However design of the pulse sequences for acquisition of 1H-observe [13C-edited] spectra, and the interpretation of the data, is more complex. Also it has less scope as a screening technique - it works well for certain moieties, which need to be decided beforehand. The resultant spectra can be quite complex with incompletely resolved peaks (due to couplings) and overlapping signals within the narrow ppm scale of the proton (1H) spectrum, necessitating deconvolution by means of computation of modelled/fitted signals. An advantage of the 1H-observe [13C-edited] approach is that it directly gives 13C fractional enrichment values, i.e. the total (12C + 13C) and the 13C fraction of a given metabolite, analogous to the spin-echo difference NMR done in solution on animal brain tissue extracts ex vivo, e.g. (Tyson et al., 2003).
Another in vivo modality that has grown over the past decade is hyperpolarized 13C MRI/MRS (Brindle et al., 2011). While detailed discussion is outside the scope of the present article, some key examples can be mentioned. Until very recently, the technique was limited to pre-clinical studies, for practical reasons. Hyperpolarized 1-13C glutamate has been used to study tumour metabolism in cell cultures in vitro and in tumours in vivo in mice (Gallagher et al., 2011). Hyperpolarized 1-13C pyruvate and 2-13C pyruvate were used to study mitochondrial metabolism in vivo in normal rats treated with a putative anticancer agent, dichloroacetate that stimulates pyruvate dehydrogenase (Hu et al., 2012). Very recently, the first-in-man in vivo hyperpolarized 13C study was achieved, in prostate cancer patients, using 1-13C pyruvate (Nelson et al., 2013). Hyperpolarization, which results in a large but short-lived increase in signal-to-noise ratio, works best on 13C atoms of carboxylic acid or carbonyl functional groups (e.g. C1 or C2 of pyruvate). Because of the transient effect, the technique is best suited to study fast steps (e.g. pyruvate conversion to lactate, effected by lactate dehydrogenase) rather than long sequences of multiple steps, in metabolic pathways. Hyperpolarization appears probably too short-lived for the microdialysis timescale. However the 13C-labelled species could, in principle, be analysed conventionally after the hyperpolarization has subsided, so microdialysis could be used in a complementary role in hyperpolarization studies.
4. Strengths and limitations of 13C-labelled microdialysis
4.1. Microdialysis and NMR
Microdialysis is a continuous-flow technique, which is advantageous for monitoring patients, though its inherently low flow rates place demands on analysis, due to small samples. For our 13C studies we use 0.3 μl/min, the same as for neurocritical care microdialysis monitoring in non-labelled cases (Timofeev et al., 2011). We have not adopted higher microdialysis flow rates (e.g. 2 μl/min), as although these would produce larger volumes the samples would be more dilute, and high flow rates might theoretically perturb the tissue biochemistry. Having a low flow rate (0.3 μl/min) means better equilibration between the solution in the catheter and the brain extracellular fluid. To have sufficient material for 13C-NMR necessitates pooling the contents of multiple microdialysate collection vials. At our standard flow rate of 0.3 μl/min, we have pooled 24 h of microdialysate collection vials per NMR tube (Gallagher et al., 2009). Our NMR spectrometer is a Bruker Avance 500 MHz (11.7 Tesla magnet), thus 13C spectra are at 125.75 MHz. With the narrowest conventional NMR sample tubes (3 mm) it is possible to analyse down to a half-day of microdialysate. Inside the magnet, the NMR sample tube sits within a device termed a probe. Ours is a cryoprobe, which possesses greater sensitivity than non-cryo probe technology. In a cryoprobe, the sample is kept at ambient (room) temperature while cold helium gas is used cool the radio-frequency transmitter and receiver coils (ca. 16 K) and preamplifier (77 K), for improved signal-to-noise ratio. Cryoprobe technology enables acquisition of 13C spectra of pooled microdialysates within a reasonable timeframe. For example, our 24 h-pooled microdialysates were analysed on NMR for 4096 scans with a 3s delay between each scan (Gallagher et al., 2009), i.e. an analysis time of approximately 3.4 h. Without a cryoprobe the 13C spectrum would necessitate a day or more of NMR time to acquire, which is impractical. Recently, NMR micro-cryoprobes have become commercially available, for smaller samples (e.g. 30 μl for Bruker’s micro-cryoprobe), which would enable better time-resolution in measurements of metabolic 13C-labelling in future, making it theoretically possible to analyse 2 h pools of microdialysates.
NMR strengths are that it identifies the position of the labelled atom within the metabolite molecule, very little sample manipulation is required, it is non-destructive, and it can be used for screening, not requiring prior selection of analytes to seek. 13C-labelled microdialysis can be used safely for severe TBI patients without interrupting their standard medical care. 13C is a stable isotope and not radioactive. 13C-labelled microdialysis micro-doses a small region of the brain directly, avoiding any issues with import across the blood–brain barrier. It also avoids any possible adverse effects associated with systemic dosing, which (in humans) would necessitate intravenous administration of large, expensive amounts of 13C substrate that would be potentially complicated by metabolism by the liver and/or other non-cerebral tissues. With 13C-labelled cerebral microdialysis it is only necessary to purchase small amounts (e.g. 1 or 2 g) of the 13C-labelled substrate to make up the formulation in CNS perfusion fluid, sufficient for multiple patients, as amounts and volumes delivered are so small.
Like all microdialysis methodology, 13C-labelled microdialysis is an invasive technique. Cerebral microdialysis cannot be applied to healthy volunteers and is limited to patients monitored in neurocritical care for severe brain injury (e.g. head injury and certain types of stroke), and patients undergoing surgery (e.g. severe epilepsy, tumour resection or biopsy). There is thus a problem in finding normal brain to act as a control. The best available approximation is normal-appearing brain in patients undergoing surgery for benign tumours in a different area of the brain.
Microdialysis is limited to the extracellular pool, so may miss detecting labelled species if they are predominantly intracellular. Moreover, microdialysis is a focal technique, limited to monitoring the immediate vicinity of the catheter (Section 2.2). Information from 13C-labelled microdialysis may in future be complemented by studies with in vivo MRS that addresses the whole tissue (combined intracellular and extracellular molecules) in selected region(s) of interest (Section 3.4).
4.2. Mass spectrometry for measuring 13C-labelling in microdialysates
Mass spectrometry is an alternative to NMR for measuring 13C-labelling in microdialysates. Gas chromatography–mass spectrometry (GC–MS) was used to analyse human adipose tissue microdialysates in healthy volunteers (Gustafsson et al., 2007). In that study, 1-13C glucose was infused via the microdialysis catheter and 13C labelling measured by GC–MS in the products lactate and glycerol recovered in the microdialysates. Apart from that study, and our study (Gallagher et al., 2009), we are unaware of any other published studies that used microdialysis to both deliver 13C-labelled substrates and collect the 13C-labelled products.
GC–MS was used to analyse 13C labelling in glutamate, in brain microdialysates from rats receiving intravenous 2,5-13C2 glucose, with and without a glutamate uptake inhibitor (Kondrat et al., 2002). Another study, in rats that received an intravenous infusion sequence of 2,5-13C2 glucose, 12C glucose, and 15NH4Ac (ammonium acetate) involved in vivo 13C MRS, in vivo microdialysis, 13C NMR for ex vivo analysis of brain tissue extracts, and GC–MS for analysis of microdialysates (Kanamori et al., 2002). An advantage of mass spectrometry is that it can be used for any stable isotope label, even those not amenable to NMR analysis. For GC-MS, a disadvantage is that processing and derivatisation steps are usually required to prepare the samples for analysis, to render the molecule(s) of interest sufficiently volatile. Other “hyphenated” mass spectrometry techniques not requiring derivatisation, e.g. liquid chromatography (LC–MS, or LC–MS/MS), may be useful in future for labelled microdialysis studies.
Mass spectrometry is more sensitive than NMR for the amount of sample needed, and mass spectrometry gives a direct measure of percentage enrichment of 13C within the molecule. However, mass spectrometry usually does not give information about the position of the 13C label within the molecule, unless suitable fragment ions are generated. Tandem mass spectrometry (e.g. GC–MS/MS or LC–MS/MS) offers controlled fragmentation which, depending on the species in question, may yield positional information on labelling patterns (Antoniewicz 2013). This methodology has begun to be applied to metabolic flux analysis, and with future refinement may gain wider use in this context (Antoniewicz 2013). Position of the label, determined by NMR is the “gold standard” for verifying the biosynthetic pathway.
4.3. Limitations due to isotope background
An ultimate limitation of 13C labelling is the naturally occurring background (termed natural abundance) since 1.1% of all carbons are 13C. This limits the sensitivity of detecting low amounts of exogenously supplied label, especially when there is a substantial concentration of the endogenous molecule naturally present. This limitation is particularly marked when the molecule of interest is singly labelled with 13C, though can largely be overcome by using double labelling. Having two 13C atoms adjacent to each other in the molecule of interest produces a “signature” of doublets in the 13C NMR spectrum. The likelihood of this occurring naturally is 0.012%. However, if a biosynthetic pathway results in loss of one of the two 13C labelled atoms (as in the PPP, with 1,2-13C2 glucose substrate), which would then give a singly-labelled product, there will be a doublet background of 1.1% in the product, due to the one remaining “label” 13C atom being next to a natural background 13C atom thereby creating a “pseudo-doubly labelled” situation. Given that glycolysis is the major pathway converting 1,2-13C2 glucose into 2,3-13C2 lactate thereby showing lactate C3 (and C2) doublets that are typically strong signals, the contribution of pseudo-doubly labelled lactate to the observed C3 doublet signal may be relatively minor. However, “reimbursing” the C3 singlet PPP-derived lactate signal by adding on the pseudo-doubly labelled component of the C3 doublet may increase the estimation of the PPP.
The natural abundance background of 13C also affects mass spectrometry. The latter is inherently more sensitive than NMR, so mass spectrometry can be done with smaller amounts of sample. However, mass spectrometry has the disadvantage (mentioned earlier) that it does not usually distinguish the intra-molecular positions of enrichment and in most cases mass spectrometry just determines the ion intensity ratios of the molecular ions. Thus 13C enrichments in all positions (carbon atoms) within the molecule of interest are combined together on mass spectrometry so that the higher molecular weight of the molecule, the higher the background signal. So, for example, on mass spectrometry a molecule with 3 carbons will have a 3.3% (3 × 1.1%) background contribution to singly labelled molecular ion (M+1, where M is the molecular weight of the unlabelled molecule) due to natural abundance 13C. Furthermore, derivatisation procedures employed for GC–MS analysis also contribute to background since the derivatised form of the molecule contains extra atoms. In contrast, NMR signals are specific to each individual carbon position so the background stays at 1.1%. On mass spectrometry, the background at singly labelled molecular ion (M+1) is further increased by the contributions of the naturally-occurring stable isotopes 2H, 17O and 15N with natural abundances 0.015%, 0.039% and 0.366% respectively, each multiplied by the number of H, O and N atoms respectively per molecule then added onto the 13C background on mass spectrometry. These non-13C isotopes do not contribute to the background on the 13C NMR spectrum. For doubly-labelled molecular ion (M+2) the natural abundance of 18O (0.201%), multiplied by the number of O atoms per molecule, contributes a background on mass spectrometry. Background contributions to M+1 and M+2 from isotopes of silicon will affect silyl-derivatised molecules on GC–MS, e.g. due to 29Si (4.67%) and 30Si (3.1%). Adoption of sufficiently high-resolution mass spectrometry may be able to discriminate the “isobars” component of background in the molecular ion due to non-13C isotopes, but the component of background due to natural abundance 13C would of course remain present.
A further consideration of natural abundance background 13C is that each step of a biosynthetic pathway may introduce progressive dilution with endogenous molecules, depending on the pathway and pool size, and any competing, branching, or following-on pathways that would “lose” molecules. Also, self-dilution occurs if a molecule labelled at one end breaks into two as part of a pathway – e.g. in glycolysis, one 1-13C glucose molecule produces one 3-13C pyruvate and one unlabelled pyruvate. For microdialysates, some labelled species may be missed if they are predominantly intracellular (e.g. glutamate). Such considerations may help explain why 13C-labelling was negligible in glutamate or glutamine in cerebral microdialysates resulting from perfusion of TBI patients’ brains with 1-13C glucose (2 mM, 99% enriched) via the microdialysis catheter (Gallagher et al., 2009). Dilution and losses can be partly offset by starting with a high concentration of labelled substrate, at high% enrichment (e.g. 99%), although increasing the absolute concentration (regardless of label) risks perturbing the biochemistry. 13C label might theoretically affect some reaction rates, but the relative mass difference (13C vs. 12C) is so small that any effect is usually deemed negligible.
5. Conclusions and future directions
Using microdialysis to both deliver and collect 13C-labelled molecules to and from the brain extracellular fluid enables site-specific information from patients in a local micro-dosing regimen. For analysing the microdialysates, NMR spectroscopy is the “gold standard” powerful tool for tracking 13C labelling, revealing not only which molecular species are labelled, but also precisely which intra-molecular position(s) the label is in, enabling the biosynthetic pathway(s) to be deduced. 13C NMR is ideally suited to energy metabolism studies, where the levels of molecules of interest are often relatively large, of the millimol/L order, though in principle NMR is applicable to other biosynthetic pathways. Future adoption of NMR micro-cryoprobe technology would permit smaller samples, enabling better time-resolution for the microdialysates by reducing requirements for pooling. Further downscaling of the microdialysate sample size requirements is possible with analysis by mass spectrometry, though at the expense of at least some of the detailed information on precise intra-molecular position of label. Even so, mass spectrometry has the potential to track labelling in smaller time-resolved samples and into low-concentration intermediates/metabolites that are too low for NMR. Overall, 13C-labelled microdialysis methodology, with analysis by high-resolution NMR and mass spectrometry, widens the scope of microdialysis for use in clinical studies of energy metabolism, drugs and other therapeutic interventions.
Acknowledgements
We gratefully acknowledge financial support as follows. Study support (cerebral energy metabolism): Medical Research Council (Grant No. G1002277 ID 98489); support for microdialysis: Medical Research Council (Grant Nos. G9439390 ID 65883 and G0600986 ID 79068) and the National Institute for Health Research Biomedical Research Centre, Cambridge. Authors’ support: KLHC – National Institute for Health Research Biomedical Research Centre, Cambridge (Neuroscience Theme; Brain Injury and Repair Theme), and the Medical Research Council (Acute Brain Injury Programme Grant); IJ – Medical Research Council and the National Institute for Health Research Biomedical Research Centre, Cambridge; CNG – Canadian Institute of Health Research; IT – Evelyn Trust; AH – Medical Research Council and Royal College of Surgeons Clinical Research Training Fellowship; DKM and JDP – National Institute for Health Research Senior Investigator Awards; PJH – National Institute for Health Research Biomedical Research Centre, Cambridge (Neuroscience Theme; Brain Injury and Repair Theme) and Academy of Medical Sciences/Health Foundation Senior Surgical Scientist Fellowship.
Footnotes
This is an open-access article distributed under the terms of the Creative Commons Attribution License, which permits unrestricted use, distribution, and reproduction in any medium, provided the original author and source are credited.
References
- Andrew E.R., Bradbury A., Eades R.G. Removal of dipolar broadening of nuclear magnetic resonance spectra of solids by specimen rotation. Nature. 1959;183:1802–1803. [Google Scholar]
- Antoniewicz M.R. Tandem mass spectrometry for measuring stable-isotope labeling. Curr. Opin. Biotechnol. 2013;24:48–53. doi: 10.1016/j.copbio.2012.10.011. [DOI] [PubMed] [Google Scholar]
- Bartnik B.L., Sutton R.L., Fukushima M., Harris N.G., Hovda D.A., Lee S.M. Upregulation of pentose phosphate pathway and preservation of tricarboxylic acid cycle flux after experimental brain injury. J. Neurotrauma. 2005;22:1052–1065. doi: 10.1089/neu.2005.22.1052. [DOI] [PubMed] [Google Scholar]
- Bartnik B.L., Lee S.M., Hovda D.A., Sutton R.L. The fate of glucose during the period of decreased metabolism after fluid percussion injury: a 13C NMR study. J. Neurotrauma. 2007;24:1079–1092. doi: 10.1089/neu.2006.0210. [DOI] [PubMed] [Google Scholar]
- Bellander B.M., Cantais E., Enblad P., Hutchinson P., Nordstrom C.H., Robertson C., Sahuquillo J., Smith M., Stocchetti N., Ungerstedt U., Unterberg A., Olsen N.V. Consensus meeting on microdialysis in neurointensive care. Intensive Care Med. 2004;30:2166–2169. doi: 10.1007/s00134-004-2461-8. [DOI] [PubMed] [Google Scholar]
- Bensinger S.J., Christofk H.R. New aspects of the Warburg effect in cancer cell biology. Semin. Cell Dev. Biol. 2012;23:352–361. doi: 10.1016/j.semcdb.2012.02.003. [DOI] [PubMed] [Google Scholar]
- Brindle K.M., Bohndiek S.E., Gallagher F.A., Kettunen M.I. Tumor imaging using hyperpolarized 13C magnetic resonance spectroscopy. Magn. Reson. Med. 2011;66:505–519. doi: 10.1002/mrm.22999. [DOI] [PubMed] [Google Scholar]
- Chen W., Zhu X.H., Gruetter R., Seaquist E.R., Adriany G., Ugurbil K. Study of tricarboxylic acid cycle flux changes in human visual cortex during hemifield visual stimulation using 1H-{13C} MRS and fMRI. Magn. Reson. Med. 2001;45:349–355. doi: 10.1002/1522-2594(200103)45:3<349::aid-mrm1045>3.0.co;2-8. [DOI] [PubMed] [Google Scholar]
- de Graaf R.A., Rothman D.L., Behar K.L. State of the art direct 13C and indirect 1H–[13C] NMR spectroscopy in vivo. A practical guide. NMR Biomed. 2011;24:958–972. doi: 10.1002/nbm.1761. [DOI] [PMC free article] [PubMed] [Google Scholar]
- Dusick J.R., Glenn T.C., Lee W.N., Vespa P.M., Kelly D.F., Lee S.M., Hovda D.A., Martin N.A. Increased pentose phosphate pathway flux after clinical traumatic brain injury: a [1,2–13C2]glucose labeling study in humans. J. Cereb. Blood Flow Metab. 2007;27:1593–1602. doi: 10.1038/sj.jcbfm.9600458. [DOI] [PubMed] [Google Scholar]
- Fan T.W., Lane A.N., Higashi R.M., Farag M.A., Gao H., Bousamra M., Miller D.M. Altered regulation of metabolic pathways in human lung cancer discerned by 13C stable isotope-resolved metabolomics (SIRM) Mol. Cancer. 2009;8:41. doi: 10.1186/1476-4598-8-41. [DOI] [PMC free article] [PubMed] [Google Scholar]
- Gallagher C.N., Carpenter K.L., Grice P., Howe D.J., Mason A., Timofeev I., Menon D.K., Kirkpatrick P.J., Pickard J.D., Sutherland G.R., Hutchinson P.J. The human brain utilizes lactate via the tricarboxylic acid cycle: a 13C-labelled microdialysis and high-resolution nuclear magnetic resonance study. Brain. 2009;132:2839–2849. doi: 10.1093/brain/awp202. [DOI] [PubMed] [Google Scholar]
- Gallagher F.A., Kettunen M.I., Day S.E., Hu D.E., Karlsson M., Gisselsson A., Lerche M.H., Brindle K.M. Detection of tumor glutamate metabolism in vivo using 13C magnetic resonance spectroscopy and hyperpolarized [1-13C]glutamate. Magn. Reson. Med. 2011;66:18–23. doi: 10.1002/mrm.22851. [DOI] [PubMed] [Google Scholar]
- Griffin J.L., Bollard M., Nicholson J.K., Bhakoo K. Spectral profiles of cultured neuronal and glial cells derived from HRMAS 1H NMR spectroscopy. NMR Biomed. 2002;15:375–384. doi: 10.1002/nbm.792. [DOI] [PubMed] [Google Scholar]
- Gruetter R., Novotny E.J., Boulware S.D., Mason G.F., Rothman D.L., Shulman G.I., Prichard J.W., Shulman R.G. Localized 13C NMR spectroscopy in the human brain of amino acid labeling from D-[1-13C]glucose. J. Neurochem. 1994;63:1377–1385. doi: 10.1046/j.1471-4159.1994.63041377.x. [DOI] [PubMed] [Google Scholar]
- Gustafsson J., Eriksson J., Marcus C. Glucose metabolism in human adipose tissue studied by 13C-glucose and microdialysis. Scand. J. Clin. Lab. Invest. 2007;67:155–164. doi: 10.1080/00365510600995259. [DOI] [PubMed] [Google Scholar]
- Hillered L., Vespa P.M., Hovda D.A. Translational neurochemical research in acute human brain injury: the current status and potential future for cerebral microdialysis. J. Neurotrauma. 2005;22:3–41. doi: 10.1089/neu.2005.22.3. [DOI] [PubMed] [Google Scholar]
- Hillered L., Persson L., Nilsson P., Ronne-Engstrom E., Enblad P. Continuous monitoring of cerebral metabolism in traumatic brain injury: a focus on cerebral microdialysis. Curr. Opin. Crit. Care. 2006;12:112–118. doi: 10.1097/01.ccx.0000216576.11439.df. [DOI] [PubMed] [Google Scholar]
- Hu S., Yoshihara H.A., Bok R., Zhou J., Zhu M., Kurhanewicz J., Vigneron D.B. Use of hyperpolarized [1-13C]pyruvate and [2-13C]pyruvate to probe the effects of the anticancer agent dichloroacetate on mitochondrial metabolism in vivo in the normal rat. Magn. Reson. Imaging. 2012;30:1367–1372. doi: 10.1016/j.mri.2012.05.012. [DOI] [PMC free article] [PubMed] [Google Scholar]
- Hutchinson P.J., O’Connell M.T., Seal A., Nortje J., Timofeev I., Al-Rawi P.G., Coles J.P., Fryer T.D., Menon D.K., Pickard J.D., Carpenter K.L. A combined microdialysis and FDG-PET study of glucose metabolism in head injury. Acta Neurochir. (Wien) 2009;151:51–61. doi: 10.1007/s00701-008-0169-1. (discussion 61) [DOI] [PubMed] [Google Scholar]
- Jalloh I., Helmy A., Shannon R.J., Gallagher C.N., Menon D.K., Carpenter K.L., Hutchinson P.J. Lactate uptake by the injured human brain – evidence from an arterio-venous gradient and cerebral microdialysis study. J. Neurotrauma. 2013;30:2031–2037. doi: 10.1089/neu.2013.2947. [DOI] [PMC free article] [PubMed] [Google Scholar]
- Kaibara T., Sutherland G.R., Colbourne F., Tyson R.L. Hypothermia: depression of tricarboxylic acid cycle flux and evidence for pentose phosphate shunt upregulation. J. Neurosurg. 1999;90:339–347. doi: 10.3171/jns.1999.90.2.0339. [DOI] [PubMed] [Google Scholar]
- Kanamori K., Ross B.D., Kondrat R.W. Glial uptake of neurotransmitter glutamate from the extracellular fluid studied in vivo by microdialysis and 13C NMR. J. Neurochem. 2002;83:682–695. doi: 10.1046/j.1471-4159.2002.01161.x. [DOI] [PubMed] [Google Scholar]
- Kolias A.G., Guilfoyle M.R., Helmy A., Allanson J., Hutchinson P.J. Traumatic brain injury in adults. Pract. Neurol. 2013;13:228–235. doi: 10.1136/practneurol-2012-000268. [DOI] [PubMed] [Google Scholar]
- Kondrat R.W., Kanamori K., Ross B.D. In vivo microdialysis and gas-chromatography/mass-spectrometry for 13C-enrichment measurement of extracellular glutamate in rat brain. J. Neurosci. Methods. 2002;120:179–192. doi: 10.1016/s0165-0270(02)00201-7. [DOI] [PubMed] [Google Scholar]
- Lebon V., Petersen K.F., Cline G.W., Shen J., Mason G.F., Dufour S., Behar K.L., Shulman G.I., Rothman D.L. Astroglial contribution to brain energy metabolism in humans revealed by 13C nuclear magnetic resonance spectroscopy: elucidation of the dominant pathway for neurotransmitter glutamate repletion and measurement of astrocytic oxidative metabolism. J. Neurosci. 2002;22:1523–1531. doi: 10.1523/JNEUROSCI.22-05-01523.2002. [DOI] [PMC free article] [PubMed] [Google Scholar]
- Lee W.N., Boros L.G., Puigjaner J., Bassilian S., Lim S., Cascante M. Mass isotopomer study of the nonoxidative pathways of the pentose cycle with [1,2-13C2]glucose. Am. J. Physiol. 1998;274:E843–E851. doi: 10.1152/ajpendo.1998.274.5.E843. [DOI] [PubMed] [Google Scholar]
- Marcus H.J., Carpenter K.L., Price S.J., Hutchinson P.J. In vivo assessment of high-grade glioma biochemistry using microdialysis: a study of energy-related molecules, growth factors and cytokines. J. Neurooncol. 2010;97:11–23. doi: 10.1007/s11060-009-9990-5. [DOI] [PubMed] [Google Scholar]
- Mason G.F., Gruetter R., Rothman D.L., Behar K.L., Shulman R.G., Novotny E.J. Simultaneous determination of the rates of the TCA cycle, glucose utilization, alpha-ketoglutarate/glutamate exchange, and glutamine synthesis in human brain by NMR. J. Cereb. Blood Flow Metab. 1995;15:12–25. doi: 10.1038/jcbfm.1995.2. [DOI] [PubMed] [Google Scholar]
- Menon D.K., Coles J.P., Gupta A.K., Fryer T.D., Smielewski P., Chatfield D.A., Aigbirhio F., Skepper J.N., Minhas P.S., Hutchinson P.J., Carpenter T.A., Clark J.C., Pickard J.D. Diffusion limited oxygen delivery following head injury. Crit. Care Med. 2004;32:1384–1390. doi: 10.1097/01.ccm.0000127777.16609.08. [DOI] [PubMed] [Google Scholar]
- Moreno A., Bluml S., Hwang J.H., Ross B.D. Alternative 1-13C glucose infusion protocols for clinical 13C MRS examinations of the brain. Magn. Reson. Med. 2001;46:39–48. doi: 10.1002/mrm.1158. [DOI] [PubMed] [Google Scholar]
- Nelson S.J., Kurhanewicz J., Vigneron D.B., Larson P.E., Harzstark A.L., Ferrone M., van Criekinge M., Chang J.W., Bok R., Park I., Reed G., Carvajal L., Small E.J., Munster P., Weinberg V.K., Ardenkjaer-Larsen J.H., Chen A.P., Hurd R.E., Odegardstuen L.I., Robb F.J., Tropp J., Murray J.A. Metabolic imaging of patients with prostate cancer using hyperpolarized [1-13C]pyruvate. Sci. Trans. Med. 2013;5:198ra108. doi: 10.1126/scitranslmed.3006070. [DOI] [PMC free article] [PubMed] [Google Scholar]
- Owen O.E., Kalhan S.C., Hanson R.W. The key role of anaplerosis and cataplerosis for citric acid cycle function. J. Biol. Chem. 2002;277:30409–30412. doi: 10.1074/jbc.R200006200. [DOI] [PubMed] [Google Scholar]
- Parkin M., Hopwood S., Jones D.A., Hashemi P., Landolt H., Fabricius M., Lauritzen M., Boutelle M.G., Strong A.J. Dynamic changes in brain glucose and lactate in pericontusional areas of the human cerebral cortex, monitored with rapid sampling on-line microdialysis: relationship with depolarisation-like events. J. Cereb. Blood Flow Metab. 2005;25:402–413. doi: 10.1038/sj.jcbfm.9600051. [DOI] [PubMed] [Google Scholar]
- Pellerin L., Magistretti P.J. Glutamate uptake into astrocytes stimulates aerobic glycolysis: a mechanism coupling neuronal activity to glucose utilization. Proc. Natl. Acad. Sci. USA. 1994;91:10625–10629. doi: 10.1073/pnas.91.22.10625. [DOI] [PMC free article] [PubMed] [Google Scholar]
- Persson L., Hillered L. Chemical monitoring of neurosurgical intensive care patients using intracerebral microdialysis. J. Neurosurg. 1992;76:72–80. doi: 10.3171/jns.1992.76.1.0072. [DOI] [PubMed] [Google Scholar]
- Persson L., Valtysson J., Enblad P., Warme P.E., Cesarini K., Lewen A., Hillered L. Neurochemical monitoring using intracerebral microdialysis in patients with subarachnoid hemorrhage. J. Neurosurg. 1996;84:606–616. doi: 10.3171/jns.1996.84.4.0606. [DOI] [PubMed] [Google Scholar]
- Piccirillo S.G., Dietz S., Madhu B., Griffiths J., Price S.J., Collins V.P., Watts C. Fluorescence-guided surgical sampling of glioblastoma identifies phenotypically distinct tumour-initiating cell populations in the tumour mass and margin. Br. J. Cancer. 2012;107:462–468. doi: 10.1038/bjc.2012.271. [DOI] [PMC free article] [PubMed] [Google Scholar]
- Riganti C., Gazzano E., Polimeni M., Aldieri E., Ghigo D. The pentose phosphate pathway: an antioxidant defense and a crossroad in tumor cell fate. Free Radic. Biol. Med. 2012;53:421–436. doi: 10.1016/j.freeradbiomed.2012.05.006. [DOI] [PubMed] [Google Scholar]
- Risa O., Melo T.M., Sonnewald U. Quantification of amounts and 13C content of metabolites in brain tissue using high-resolution magic angle spinning 13C NMR spectroscopy. NMR Biomed. 2009;22:266–271. doi: 10.1002/nbm.1317. [DOI] [PubMed] [Google Scholar]
- Timofeev I., Carpenter K.L., Nortje J., Al-Rawi P.G., O’Connell M.T., Czosnyka M., Smielewski P., Pickard J.D., Menon D.K., Kirkpatrick P.J., Gupta A.K., Hutchinson P.J. Cerebral extracellular chemistry and outcome following traumatic brain injury: a microdialysis study of 223 patients. Brain. 2011;134:484–494. doi: 10.1093/brain/awq353. [DOI] [PubMed] [Google Scholar]
- Tyson R.L., Gallagher C., Sutherland G.R. 13C-Labeled substrates and the cerebral metabolic compartmentalization of acetate and lactate. Brain Res. 2003;992:43–52. doi: 10.1016/j.brainres.2003.08.027. [DOI] [PubMed] [Google Scholar]
- Warburg O. On the origin of cancer cells. Science. 1956;123:309–314. doi: 10.1126/science.123.3191.309. [DOI] [PubMed] [Google Scholar]