

ABSTRACT
We observed previously that after long-term suppression of luteinizing hormone (LH) and thus of Leydig cell steroidogenesis, restimulation of the Leydig cells by LH resulted in significantly higher testosterone production than by age-matched cells from control rats. These studies suggest that stimulation over time may elicit harmful effects on the steroidogenic machinery, perhaps through alteration of the intracellular oxidant-to-antioxidant balance. Herein we compared the effects of LH stimulation on stress response genes, formation of intracellular reactive oxygen species (ROS), and ROS-induced damage to ROS-susceptible macromolecules (DNA) in young and in aged cells. Microarray analysis indicated that LH stimulation resulted in significant increases in expression of genes associated with stress response and antiapoptotic pathways. Short-term LH treatment of primary Leydig cells isolated from young rats resulted in transiently increased ROS levels compared to controls. Aged Leydig cells also showed increased ROS soon after LH stimulation. However, in contrast to the young cells, ROS production peaked later and the time to recovery was increased. In both young and aged cells, treatment with LH resulted in increased levels of DNA damage but significantly more so in the aged cells. DNA damage levels in response to LH and the levels of intracellular ROS were highly correlated. Taken together, these results indicate that LH stimulation causes increased ROS production by young and aged Leydig cells and that while DNA damage occurs in cells of both ages, there is greater damage in the aged cells.
Keywords: aging, DNA damage, DNA repair, Leydig cell, ROS
By increasing reactive oxygen species (ROS) production over time in aging Leydig cells, luteinizing hormone (LH) contributes to age-related reduced testosterone production and to age-related DNA damage.
INTRODUCTION
Aging in Brown Norway rats, as in men, is associated with reduced serum testosterone concentration [1]. Previous studies have demonstrated that reduced steroid production by the Leydig cells, rather than loss of the cells, is the likely cause of reduced serum testosterone [2]. Leydig cell steroidogenic function is regulated in part by luteinizing hormone (LH). LH binds to G protein-coupled receptors, thereby initiating a cascade of events that include activation of adenylate cyclase, increased intracellular cAMP levels, activation of cAMP-dependent protein kinase, phosphorylation of proteins, and ultimately, transfer of cholesterol to the inner mitochondrial membrane [3, 4].
Superoxide and other reactive oxygen species (ROS) are produced by the mitochondrial electron transport chain during the process of oxidative phosphorylation [5]. Leydig cells, in addition, contain cytochrome P450 enzymes that catalyze the oxidation of metabolic intermediates in the steroidogenic pathway and in doing so can leak electrons and serve as a source of free radical generation [6]. Cells contain enzymes (e.g., superoxide dismutase, catalase, glutathione peroxidase, glutathione reductase) and other molecules (e.g., ascorbic acid, α-tocopherol, β-carotene) that can neutralize or scavenge ROS [7]. Alterations to the oxidant/antioxidant balance can result in increased ROS and, as a consequence, accumulation of oxidative damage to various intracellular molecules, including proteins, lipids, and DNA [8].
An altered redox environment is characteristic of the aging of many cell types, including Leydig cells, and may contribute to functional deficits that accompany aging [9]. Although the mechanisms by which age-related deficits occur in the Leydig cell steroidogenic pathway remains uncertain, there is correlative evidence that alteration in the oxidant/antioxidant status of the cells is involved. Thus, the antioxidant defense molecules superoxide dismutase-1 and -2, glutathione peroxidase, and glutathione (GSH) are significantly reduced as Leydig cells age [10, 11]. Additionally, the superoxide content of mitochondria of aging Leydig cells is significantly increased compared with that of young Leydig cells [12], as is lipid peroxidation [11]. Previous studies have indicated that generation of ROS has an inhibitory effect on steroidogenesis [13–15]. These observations, taken together, suggest that an alteration in the redox environment of aged Leydig cells may be involved in the reduced steroidogenesis that characterizes these cells.
As yet, little is known about the regulatory mechanisms involved in the generation of superoxide and other ROS in Leydig cells or the possible relationship of intracellular ROS production to damage to Leydig cell macromolecules. In an earlier study, we showed that the long-term suppression of LH prevented age-related reduction in testosterone production by rat Leydig cells [16], suggesting that LH, although a physiologically relevant molecule that normally stimulates steroidogenesis in Leydig cells, might play an important role in the diminished steroid production that characterizes aging.
The present study was conducted to begin to understand the possible role of long-term exposure to LH in Leydig cell aging. The major hypothesis that we address is that LH stimulation of Leydig cells creates potentially damaging free radicals that may affect steroid formation as well as essential molecules including DNA. We further hypothesize that the resulting altered redox environment in response to LH is particularly damaging to aged steroidogenic cells because of their reduced repair capacity.
MATERIALS AND METHODS
Chemicals
l-Buthionine-sulfoximine (BSO) all-rac-α-tocopherols (vitamin E) were from Sigma. Bovine lipoprotein was from MP Biomedicals Inc.. M-199 medium was from Invitrogen. Type III collagenase was from Worthington. Bovine LH (USDA-bLH-B-6) was provided by the U.S. Department of Agriculture Animal Hormone Program.
Animals
Young (4-mo-old) and aged (24-mo-old) male Brown Norway rats were obtained through the National Institute on Aging, supplied by Harlan Sprague Dawley, Inc.. Rats were housed in animal facilities of the Johns Hopkins Medical Institutions under conditions of controlled light (14L:10D) and temperature (22°C) and with free access to rat chow and water. All procedures were performed in accordance with the National Institutes of Health Guide for the Care and Use of Laboratory Animals, according to protocols approved by the Johns Hopkins Animal Care and Use Committee.
Leydig Cell Isolation
Leydig cells were isolated from rat testes as previously described [17]. Briefly, the testicular artery was cannulated, and testes were perfused with type III collagenase (1 mg/ml) in dissociation buffer (M-199 medium with 2.2 g/L HEPES, 1.0 g/L bovine serum albumin [BSA], 25 mg/L trypsin inhibitor, 0.7 g/L sodium bicarbonate [pH 7.4]) to clear testicular blood. Testes then were decapsulated and digested in collagenase (0.25 mg/ml, 34°C) with slow shaking (90 cycles/min, 30 min). The dissociated cells were purified by Percoll (Sigma-Aldrich, St. Louis, MO) and BSA gradient centrifugations.
Differential Gene Expression
Leydig cells were isolated from 4-mo-old Brown Norway rats and incubated for 2 h with bovine LH (100 ng/ml). Total RNA was purified by TRIzol (Invitrogen) extraction and an RNeasy column (Qiagen). For all samples, RNA quantity was determined by absorbance at 260 nm (NanoDrop), and quality was determined using a Bioanalyzer (Agilent). All samples were treated with DNase on the column and eluted with water. Labeled cRNA was hybridized to Rat Gene ST 1.0 microarray (Affymetrix), representing greater than 27 000 transcripts. The raw data of each array from the Affymetrix GCOS software (.CEL extension format) were imported into FlexArray software, a statistical data analysis software for gene expression microarrays (version 1.61; http://genomequebec.mcgill.ca/FlexArray) and then preprocessed using Affymetrix Power Tools (APT) with normalization by robust multiarray average (RMA). Significance analysis of microarrays (SAM) and analysis of variance (ANOVA) were used for selection of statistically significant genes with a P value equal to or less than 0.05. Differential expression of each gene network or pathways was determined using 1.2-fold change or more from the average value of each meta-probeset (each gene) and then visualized by using Gene Microarray Pathway Prolifer (GenMAPP; http://www.GenMAPP.org) [18]. The whole gene set of the microarray was imported into the program, and GenMAPP was used to illustrate pathways containing the differentially expressed genes. The defined gene sets or statistically differential regulated gene pathways were screened by using gene set enrichment analysis [19]. The selected gene/protein lists were transformed into biological meaning by DAVID Bioinformatics Resources version 6.7, an integrated biological knowledgebase and analytic tools [20].
Effects of BSO and Vitamin E
Leydig cells were isolated from 4-mo-old rats and cultured in M-199 medium supplemented with 2.2 g/L NaHCO3, 2.4 g/L HEPES, 0.1% BSA, 0.25 g/L bovine lipoprotein, and 25 mg/L gentamicin (pH 7.4) for 48 h. Cells were maintained at 34°C in 5% CO2. BSO (0–100 μM) was added to the medium. Some of the cells incubated with 100 μM BSO also were incubated with vitamin E (all-rac-α-tocopherol; 2.5–40 μg/ml). Following the initial culture period, cells were incubated in fresh medium with maximally stimulating bovine LH (100 ng/ml). In these and in all other cell culture experiments, there were 3–5 separate replicates.
MA-10 Cell Culture
The MA-10 mouse Leydig tumor cell line was a generous gift from Dr. Mario Ascoli (University of Iowa, Iowa City, IA). The cells were cultured in Waymouth MB/752 medium containing 15% horse serum and 5% CO2 at 34°C [21]. To deplete intracellular GSH, cells at 70% confluence were treated with BSO (100 μM).
Analysis of Intracellular ROS Concentrations
Intracellular ROS concentrations were assessed by measuring the ability of the cells to oxidize the redox-sensitive dye 2,7-dichlorodihydrofluorescein diacetate (DCF). Briefly, the cells were cultured in black 96-well florescence assay plates (BD Falcon). After treatment with LH for various lengths of time, the cells were incubated in 200 μl of M199 medium containing 20 μM DCF for 30 min. After cells were washed three times with phosphate-buffered saline (PBS), 50 μl of PBS was added to the plates, which were read by a DTX800 multimode detector (Beckman Coulter) with excitation of 485 nm and emission of 535 nm.
Analysis of DNA Damage
The Comet assay was performed under alkaline conditions according to the procedure of Singh et al. [22]. Briefly, MA-10 and primary Leydig cells were incubated with LH (100 ng/ml), BSO (100 nM overnight), and vitamin E (all-rac-α-tocopherol; 20 μg/ml). The cells were mixed with low-melting agarose, placed on a treated slide (Trevigen Inc.), and lysed to unwind DNA. Samples were stained with intercalating dye and visualized after electrophoresis at 23 V for 20–40 min. Images were obtained with an Eclipse 800 model microscope (Nikon) equipped with a 5-MHz cooled charge-coupled device camera (Princeton Instruments), a custom-built color rendering index color filter, and digital image analysis software (IP-Lab; Scanalytics Inc., Fairfax, VA). All photos were taken at the same magnifications and exposure times. Images were then assessed to determine levels of damage within cell populations given various treatments and age.
Statistical Analyses
Data are means ± SEM. Group means were evaluated by one-way ANOVA and chi-square test for variance. If group differences were revealed by ANOVA (P < 0.05), differences between individual groups were determined by using the Student-Newman-Keuls test or pairwise Tukey test with SigmaStat software (Systat Software Inc.). Values were considered significant at a P value of <0.05.
RESULTS
Effect of LH Stimulation on Gene Expression
Using microarray analysis, we examined the changes in gene expression occurring in Leydig cells of young adult rats incubated with LH for 2 h. Of the 29 170 genes (meta-probesets) of the Rat Gene ST 1.0 microarray platform, 959 were found to be differentially regulated (P ≤ 0.05) in response to LH treatment (Fig. 1). Supplemental Table S1 (available online at www.biolreprod.org) provides a list of all genes significantly regulated by LH. We selected 415 up-regulated and 219 down-regulated genes (cut-off value of 1.2-fold) for functional annotation clustering assay using DAVID Bioinformatics Resources version 6.7 (http://david.abcc.ncifcrf.gov). As would be expected, genes involved in G protein-coupled receptor activation pathways were up-regulated by LH stimulation (Table 1). Highly up-regulated genes included Rgs2 and Fam13c, both involved in the G protein-coupled response and GTPase activation [23, 24]. The cAMP response element modulator (Crem) gene was significantly up-regulated as well. Many of the regulated genes were involved in the regulation of stress response, including antiapoptotic, cell survival, and antioxidant genes (Table 1, Fig. 2A). Among up-regulated genes were the transcription factors Junb and Fos, which make up the AP-1 complex involved in redox regulation [25]. These genes have been implicated in ROS-mediated up-regulation of signaling molecules as well as in the repression of steroidogenic enzymes [13]. Also up-regulated were Pcna, Pold1, Ube2a, and Smarca5 (Fig. 2B), each of which is involved in DNA repair [26]; and Nr4a1/2, which belongs to a family of nuclear receptor/transcription factors that are closely associated with transcription of steroidogenic enzymes [27, 28] and which is implicated in stress response regulation, including protection against potentially harmful free radicals [29].
FIG. 1.
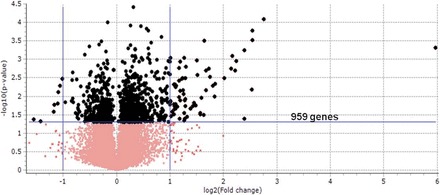
Volcano plot of differentially expressed genes from microarray ANOVA analysis. The log10 P values from the ANOVA of microarray data analysis were plotted against log 2-fold changes in all the gene expression. P values <0.05 were used as the cutoff for selected genes for further pathway analysis (black). Genes (959, including noncoding RNAs) from 1046 meta-probeset were used.
TABLE 1.
Significantly upregulated relevant genes.*
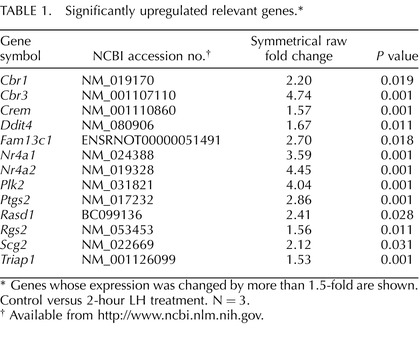
Genes whose expression was changed by more than 1.5-fold are shown. Control versus 2-hour LH treatment. N = 3.
Available from http://www.ncbi.nlm.nih.gov.
FIG. 2.
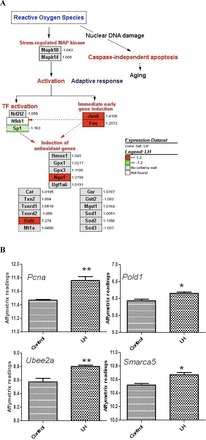
ROS-mediated redox response pathway and DNA repair genes. A) Oxidative response to increased ROS. Fold changes are indicated at each right side of the gene boxes. B) Affymetrix readings of the genes (Pcna, Pold1, Ube2a) involved in the error-free mode of bypass DNA repair before and after the LH-treatment, as well as one gene, Smarca5, involved in global DNA instability repair. *P ≤ 0.01 and **P ≤ 0.05 (n = 3, ANOVA).
A number of additional genes involved in stress response also were found to be up-regulated, including Ptgs2, Plk2, Rasd1, Cbr1 and Cbr3 (Table 1). Ptgs2 (cyclo-oxygenase 2 [COX-2]) plays a significant role in stress response and anti-inflammation, and is associated with COX-2-dependent electrophile oxo-derivative (EFOX), the product of which activates Nrf2 and thereby many genes associated with intracellular antioxidant response [30]. Polo-like kinase 2 (Plk2) acts to help regulate the cellular response to DNA damage and is known to bind directly to p53 under stressful cellular conditions, including increased reactive oxygen [31]. Dexamethasone-induced Ras-related protein 1 (Rasd1) recently has been implicated in limiting the potential damage of nitric oxide (NO) signaling by docking NO synthases to potential target proteins [32]. Cbr1 and Cbr3 are oxidoreductase enzymes involved in metabolizing quinones, which undergo redox cycling with molecular oxygen, thus initiating and sustaining ROS production [33].
Up-regulated genes also included some involved in protection against cell death (Table 1). Among these were DNA damage inducible transcript 4 (Ddit4), which protects cells from hypoxia and from H2O2-triggered apoptosis [34]; secretogranin II (Scg2), an AP-1-regulated protein that protects against NO-induced apoptosis [35]; and TP53 regulated inhibitor of apoptosis (Triap1), which acts in a p53-dependent manner in response to low levels of DNA damage and prevents induction of apoptosis by inhibition of caspase-9 [36]. Regulation of apoptosis is of critical importance when a cell is exposed to increased ROS and DNA damage.
Effect of LH Stimulation on Leydig Cells' ROS Production
The significant increases in the expression of genes related to stress response suggested that LH stimulation might increase intracellular oxidative stress which, in turn, would result in cellular damage. To address this, we first determined the effect of LH stimulation on ROS production in MA-10 Leydig tumor cells. The cells were incubated for increasing time periods (0–120 min) in the presence or absence of maximally stimulating LH (100 ng/ml), and intracellular ROS was measured by DCF. As seen in Figure 3A, ROS were generated rapidly in response to LH stimulation, increasing significantly in only 5 min. The ROS levels remained relatively high through 30 min, then decreased significantly by 45 min and remained low through 120 min despite the continued presence of LH in the culture media.
FIG. 3.
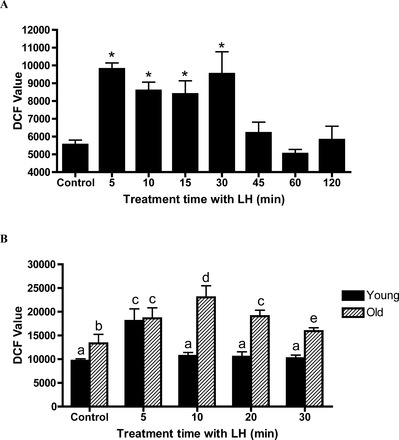
Effects of LH stimulation on ROS generation. A) MA-10 Leydig cells were incubated for increasing lengths of time in the presence of maximally stimulating LH (100 ng/ml). B) Leydig cells were isolated from 4- and 24-mo-old Brown Norway rats stimulated with 100 ng/ml LH for various times and incubated with DCF for 30 min. DCF values were expressed as fluorescence units. Each bar represents the mean ± SEM from three experiments. Values with different letters are significantly different at P < 0.05.
As with MA-10 cells, stimulation of young adult Leydig cells with LH resulted in significantly increased ROS levels by 5 min (Fig. 3B). However, in contrast to MA-10 cells, recovery to control ROS levels in the presence of LH in the culture medium occurred only 5 min after ROS had reached peak values. In the case of Leydig cells isolated from aged rats, there also was significant elevation of ROS in response to LH in 5 min (Fig. 3B). However, the peak ROS production in aged Leydig cells required 10 min, longer than with young cells, and ROS recovery to control levels also took considerably longer (>30 min).
Effect of LH Stimulation on Leydig Cell DNA Damage
To determine the effect of increased levels of LH-induced ROS on macromolecules within steroidogenic cells, Comet assays were used to assess the levels of DNA damage. Figure 4A shows a field of cells after their incubation with LH for 2 h. Cells were scored as “intact” or “DNA damage,” with a range of comet “tails” in the latter category. Figure 4B quantifies the percentage of MA-10 cells with DNA damage resulting from incubating the cells with LH for 2, 12 or 24 h. Incubation of the cells for 2 h with LH resulted in a significant increase in DNA-damaged cells, and at 12 h the percentage was greater. Interestingly, the percentage of damaged cells after a 24-hour incubation with LH was not different from controls, indicating that the cells repaired the damage over time despite the continued presence of LH. To determine whether the LH-induced increase in DNA damage was related to increased ROS in response to LH stimulation, MA-10 cells were incubated with LH alone for 2 h, or with LH plus the antioxidant tocopherol (vitamin E). As seen in Figure 4C, the increase in DNA damage with LH treatment was suppressed when the cells were also incubated with vitamin E, suggesting that the DNA damage resulting from LH stimulation was a consequence of ROS generation within the cells.
FIG. 4.
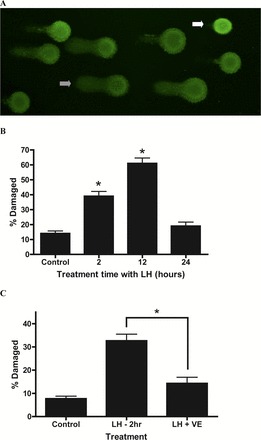
Effects of LH stimulation on DNA damage in Leydig cells. A) Leydig cells were isolated from and 24 mo-old Brown Norway rats stimulated with 100 ng/ml LH for 2 h and analyzed by Comet assay. Open arrow indicates a representative cell with very little or no damage. Dashed arrow indicates a cell with damaged DNA. Original magnification ×10. B) MA-10 cells were stimulated with 100 ng/ml LH for increasing times and analyzed by Comet assay. *Significantly different from control value, P < 0.05. C) Effects of vitamin E (VE) treatment on LH-induced DNA damage in MA-10 cells. MA-10 cells were stimulated with 100 ng/ml LH in the presence of 20 μM VE and analyzed by Comet assay. DNA damage was assessed by single-cell electrophoresis, with single cells determined to be damaged or not. DNA damage values are expressed as a percentage of total cells counted. *Significantly different from control cells incubated without LH, P < 0.05.
The responses of young and aged primary cells to LH (2 h) were then assessed (Fig. 5A). The percentage of untreated cells that had some level of DNA damage was significantly greater in old than in young cells. Incubation of young cells with LH for 2 h had no effect on the percentage of cells with DNA damage. In striking contrast, the percentage of old cells with DNA damage increased significantly with a 2-hour LH exposure compared to old control cells. Figure 5B compares the effects of LH treatment for 2 and 24 h on young and old Leydig cells. The percentage of young cells with measurable DNA damage did not increase with 24 h of LH exposure. In contrast, the percentage of damaged old cells increased further when the cells were stimulated with LH for 24 h.
FIG. 5.
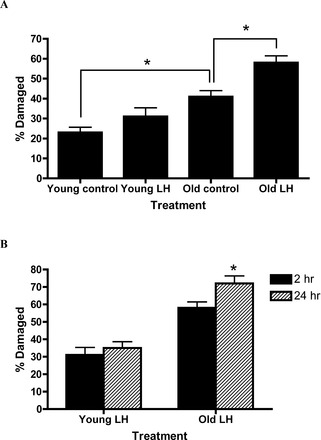
A) Primary young and aged cells stimulated with 100 ng/ml LH for 2 h. B) Primary young and aged cells stimulated with 100 ng/ml LH for 2 and 24 h. DNA damage was assessed by single-cell electrophoresis, with cells determined to be damaged or not. DNA damage values are expressed as a percentage of total cells counted. *Significantly different from the values obtained from young and old control cells incubated without LH, P < 0.05.
Effect of GSH Depletion with BSO on Leydig Cell DNA Damage
To further understand the possible effect of the redox environment on LH-stimulated genome integrity, young Leydig cells were incubated with BSO overnight to reduce intracellular glutathione, a major antioxidant in Leydig cells [37]. As seen in Figure 6, treatment of young cells with LH for 2 h did not result in significantly increased percentages of DNA-damaged cells in comparison to cells that had not been treated with LH. Incubation of young Leydig cells with BSO resulted in significant increases in the percentages of DNA-damaged cells in comparison to controls. With incubation of the BSO-treated cells with LH for 2 h, the percentages of damage cells was even higher.
FIG. 6.
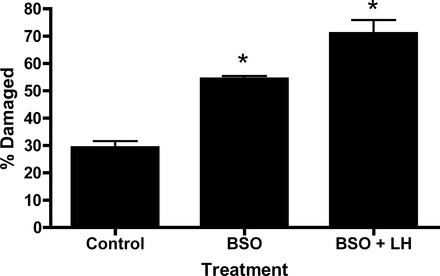
Effects of LH stimulation on DNA damage in young rat Leydig cells. Leydig cells isolated from young Brown Norway rats were incubated with 100 μM BSO alone or co-incubated with BSO and 100 ng/ml LH for 2 h in order to deplete GSH. Cells then were analyzed by Comet assay. DNA damage values are expressed as a percentage of total cells counted. *Significantly different from the values obtained from cells incubated without LH at P < 0.05.
DISCUSSION
Stimulation by LH is critical for normal Leydig cell steroidogenic function. Thus, acting chronically, LH maintains the normal expression of Leydig cell steroidogenic enzymes [38]. Acting acutely, LH stimulates cholesterol transfer to the inner mitochondrial membrane where it is metabolized to pregnenolone by the cytochrome P450 cholesterol side-chain cleavage enzyme (CYP11A1) [38]. Although serum levels of LH do not decline with aging in Brown Norway rats, Leydig cell steroidogenic function declines such that the cells from aged rats produce 50% less testosterone than cells from young rats [2]. In a previous study, we observed that after the long-term suppression of LH in rats from middle age to old age, the restimulation of the aged cells with LH resulted in production of testosterone by the aged cells at the level of young cells [16]. These studies suggested that stimulation by LH over a long period of time may play a role in the steroidogenic decline that is characteristic of Leydig cell aging.
These previous results led us to ask in the present studies whether and how, over time, LH might exert negative effects on Leydig cell function. Short-term (2-hour) incubation of young Leydig cells with LH was found to result in the increased expression of a number of genes involved in stress response, DNA repair, and antiapoptotic protective pathways. Of particular interest were Ptgs2, Plk2, JunB, Fos, and Nr4a, the protein products of which are involved in the induction or activation of Nrf2, a master regulator of the antioxidant response throughout the cell. Other upregulated genes included those associated with the regulation of apoptosis, including Ddit4, Scg2, and Triap1 [34–36], and those associated with DNA repair, including Pcna, Pold1, Ubee2a, and Smarca5. The upregulation of such genes in response to LH is consistent with the hypotheses that LH stimulation may result in a shift in the redox environment of the cells, and that this, in turn, induces the cells to protect against the potentially damaging effects of this environment.
Previous studies indicated that a shift in the redox state of a cell can lead to DNA, protein, and/or lipid damage, and thus to functional changes [39]. In steroidogenic cells, ROS production would be expected to be particularly high because, in addition to the mitochondrial electron transport chain, steroid hydroxylation by the cytochrome P450 enzymes can generate ROS [6]. We [12, 37, 40] and others [13] have reported that with increased ROS conditions, there are reductions in steroidogenic enzymes and ultimately in steroid production. Additionally, it has been shown that steroid production by cultured Leydig cells is increased under conditions of reduced oxygen tension [41–44]. These observations, taken together, led us to hypothesize that LH might cause increases in ROS production which, over time, might damage macromolecules in aging Leydig cells. Indeed, we found that LH stimulation causes significantly increased generation of ROS in both MA-10 and primary Leydig cells, as well as increased DNA damage. The results with the MA-10 and primary Leydig cells confirm previous reports that hCG and cAMP can increase mitochondria-derived ROS in Leydig cells [45–49]. The observation that treating cells with the antioxidant vitamin E reduced DNA damage is consistent with the idea that increased ROS in response to LH was responsible for the DNA damage.
The antioxidant defense molecules superoxide dismutase-1 and -2, glutathione peroxidase, and GSH have been shown to decrease in aged compared to young Leydig cells [10, 11]. Lipid peroxidation has been shown to increase with Leydig cell aging [10], perhaps as a consequence of changes in the redox environment of aging Leydig cells. Previously we have shown that alterations in the redox environment within Leydig cells, elicited by experimentally depleting glutathione, increased the susceptibility of the cells to acute stress [40]. Based on their reduced levels of antioxidant molecules [10, 11] and thus presumably their reduced capacity to counter the effects of potentially damaging oxidative stress compared to young cells, we hypothesized that although both young and aged Leydig cells would be expected to respond to LH by producing ROS, aged cells would be less able to recover to normal ROS levels than young cells. We reasoned that if this was true, there might be greater damage to macromolecules in old versus young cells. We found that stimulation with LH resulted in significantly increased levels of ROS in both young and old Leydig cells, but in greater levels in old cells. Even in the face of continued LH stimulation, levels of ROS returned to those before LH exposure in both young and old cells, but did so more rapidly in the young cells. Additionally, damage to DNA was greater in old than in young cells. Finally, when young cells were treated with BSO to deplete the GSH pool and thus alter the intracellular redox environment, the levels of DNA damage in these cells in response to LH were similar to the levels in LH-treated old cells.
Taken together, these results indicate that LH stimulation can cause increased ROS production and DNA damage in both young and aged Leydig cells, with greater effects in the aged cells. It seems likely, therefore, that the observation made previously [16], that the long-term suppression of LH prevents age-related reduction in testosterone production by aged cells, results from LH-induced oxidative stress in combination with the lesser ability of aged cells to prevent or repair the resultant damage. There are translational ramifications of these findings. It is possible, for example, that treatment of young men with LH-suppressive hormones would provide contraception when it is needed, and later, when contraception no longer is needed, the reductions in Leydig cell testosterone production that would have accompanied aging will not have occurred, thereby delaying or preventing the adverse consequences of reduced testosterone (osteoporosis, reduced muscle mass, reduced libido, mood swings, and other consequences).
Supplementary Material
Footnotes
Supported by National Institute of Child Health and Human Development training grant T32 HD07276 to M.B., Canadian Institutes of Health Research grant MOP102647 to V.P., Canada Research Chair in biochemical pharmacology to V.P., and National Institutes of Health grant R37 AG21092 to B.R.Z.
REFERENCES
- Vermeulen A, Kaufman JM. Ageing of the hypothalamo-pituitary-testicular axis in men. Horm Res 1995; 43: 25 28. [DOI] [PubMed] [Google Scholar]
- Chen H, Hardy MP, Huhtaniemi I, Zirkin BR. Age-related decreased Leydig cell testosterone production in the Brown Norway rat. J Androl 1994; 15: 551 557. [PubMed] [Google Scholar]
- Puett D, Li Y, DeMars G, Angelova K, Fanelli F. A functional transmembrane complex: The luteinizing hormone receptor with bound ligand and G protein. Mol Cell Endocrinol 2007; 260–263: 126 136. [DOI] [PMC free article] [PubMed] [Google Scholar]
- Rone M, Fan J, Papadopoulos V. Cholesterol transport in steroid biosynthesis: Role of protein–protein interactions and implications in disease states. Biochim Biophys Acta 2009; 1791: 646 658. [DOI] [PMC free article] [PubMed] [Google Scholar]
- Raha S, Robinson BH. Mitochondria, oxygen free radicals, disease and ageing. Trends Biochem Sci 2000; 25: 502 508. [DOI] [PubMed] [Google Scholar]
- Hanukoglu I. Antioxidant protective mechanisms against reactive oxygen species (ROS) generated by mitochondrial p450 systems in steroidogenic cells. Drug Metab Rev 2006; 38: 171 196. [DOI] [PubMed] [Google Scholar]
- Andreyev AY, Kushnareva YE, Starkov AA. Mitochondrial metabolism of reactive oxygen species. Biochemistry 2005; 70: 246 264. [DOI] [PubMed] [Google Scholar]
- Ames BN, Shigenaga MK, Hagen TM. Oxidants, antioxidants, and the degenerative diseases of aging. Proc Nat Acad Sci U S A 1993; 90: 7915 7922. [DOI] [PMC free article] [PubMed] [Google Scholar]
- Rebrin I, Sohal RS. Pro-oxidant shift in glutathione redox state during aging. Adv Drug Deliv Rev 2008; 60: 1545 1552. [DOI] [PMC free article] [PubMed] [Google Scholar]
- Luo L, Chen H, Trush MA, Show MD, Anway MD, Zirkin BR. Aging and the brown Norway rat Leydig cell antioxidant defense system. J Androl 2006; 27: 240 247. [DOI] [PubMed] [Google Scholar]
- Cao L, Leers-Sucheta S, Azhar S. Aging alters the functional expression of enzymatic and non-enzymatic anti-oxidant defense systems in testicular rat Leydig cells. J Steroid Biochem Mol Biol 2004; 88: 61 67. [DOI] [PubMed] [Google Scholar]
- Chen H, Cangello D, Benson S, Folmer J, Zhu H, Trush MA, Zirkin BR. Age-related increase in mitochondrial superoxide generation in the testosterone-producing cells of Brown Norway rat testes: relationship to reduced steroidogenic function? Exp Gerontol 2001; 36: 1361 1373. [DOI] [PubMed] [Google Scholar]
- Lee SY, Gong EY, Hong CY, Kim KH, Han JS, Ryu JC, Chae HZ, Yun CH, Lee K. ROS inhibit the expression of testicular steroidogenic enzyme genes via the suppression of Nur77 transactivation. Free Radic Biol Med 2009; 47: 1591 1600. [DOI] [PubMed] [Google Scholar]
- Yacobi K, Tsafriri A, Gross A. Luteinizing hormone-induced caspase activation in rat preovulatory follicles is coupled to mitochondrial steroidogenesis. Endocrinology 2007; 148: 1717 1726. [DOI] [PubMed] [Google Scholar]
- Vega M, Carrasca I, Castillo T, Troncoso JL, Videla IA, Devoto L. Functional luteolysis in respons.e to hydrogen peroxide in human luteal cells. Endocrinology 1995; 147: 177 182. [DOI] [PubMed] [Google Scholar]
- Chen H, Zirkin BR. Long-term suppression of Leydig cell steroidogenesis prevents Leydig cell aging. Proc Nat Acad Sci U S A 1999; 96: 14877 14881. [DOI] [PMC free article] [PubMed] [Google Scholar]
- Klinefelter GR, Hall PF, Ewing LL. Effect of luteinizing hormone deprivation in situ on steroidogenesis of rat Leydig cells purified by a multistep procedure. Biol Reprod 1987; 36: 769 783. [DOI] [PubMed] [Google Scholar]
- Dahlquist KD, Salomonis N, Vranizan K, Lawlor SC, Conklin BR. GenMAPP, a new tool for viewing and analyzing microarray data on biological pathways. Nat Genet 2002; 31: 19 20. [DOI] [PubMed] [Google Scholar]
- Subramanian A, Tamayo P, Mootha VK, Mukherjee S, Ebert BL, Gillette MA, Paulovich A, Pomeroy SL, Golub TR, Lander ES, Mesirov JP. Gene set enrichment analysis: A knowledge-based approach for interpreting genome-wide expression profiles. Proc Nat Acad Sci U S A 2005; 102: 15545 15550. [DOI] [PMC free article] [PubMed] [Google Scholar]
- Huang da W, Sherman BT, Lempicki RA. Systematic and integrative analysis of large gene lists using DAVID bioinformatics resources. Nat Protoc 2009; 4: 44 57. [DOI] [PubMed] [Google Scholar]
- Ascoli M. Characterization of several clonal lines of cultured Leydig tumor cells: gonadotropin receptors and steroidogenic responses. Endocrinology 1981; 108: 88 95. [DOI] [PubMed] [Google Scholar]
- Singh N, McCoy M, Tice R, Schneider E. A simple technique for quantification of low levels of DNA damage in individual cells. Exp Cell Res 1988; 175: 184 191. [DOI] [PubMed] [Google Scholar]
- Hollinger S, Hepler JR. Cellular regulation of RGS proteins: modulators and integrators of G protein signaling. Pharmacol Rev 2002; 54: 527 559. [DOI] [PubMed] [Google Scholar]
- Cohen M, Reichenstein M. Everts-van der Wind A, Heon-Lee J, Shani M, Lewin H, Weller JI, Ron M, Seroussi E. Cloning and characterization of FAM13A1—a gene near a milk protein QTL on BTA6: evidence for population-wide linkage disequilibrium in Israeli Holsteins. Genomics 2004; 84: 374 383. [DOI] [PubMed] [Google Scholar]
- Rao G, Katki K, Madamanchi N, Wu Y. JunB forms the majority of AP-1 complex and is a target for redox regulation by receptor tyrosine kinase and g protein-coupled receptor agonist in smooth muscle cells. J Biol Chem 1999; 274: 6003 6010. [DOI] [PubMed] [Google Scholar]
- Swaminathan S. Post-replication repair: ubiquitin throws the switch. Nat Cell Biol 2004; 6: 578. [Google Scholar]
- Song KH, Park JI, Lee MO, Soh J, Lee K, Choi HS. LH induces orphan nuclear receptor Nur77 gene expression in testicular Leydig cells. Endocrinology 2001; 142: 5116 5123. [DOI] [PubMed] [Google Scholar]
- Fernandez PM, Brunel F, Jimenez MA, Saez JM, Cereghini S, Zakin MM. Nuclear receptors Nor1 and NGFI-B/Nur77 play similar, albeit distinct, roles in the hypothalamo-pituitary-adrenal axis. Endocrinology 2000; 141: 2392 2400. [DOI] [PubMed] [Google Scholar]
- Volakakis N, Kadkhodai B, Joodmardi E, Wallis K, Panman L, Silvaggi J, Spiegelman BM, Perlmann T. NR4A orphan nuclear receptors as mediators of CREB-dependent neuroprotection. Proc Nat Acad Sci U S A 2010; 107: 12317 12322. [DOI] [PMC free article] [PubMed] [Google Scholar]
- Luo C, Urgard E, Vooder T, Metspalu A. The role of COX-2 and Nrf2/ARE in ani-inflammation and antioxidative stress: aging and anti-aging. Med Hypotheses 2011; 77: 174 178. [DOI] [PubMed] [Google Scholar]
- Matthew EM, Hart LS, Astrinidis A, Navaraj A, Dolloff NG, Dicker DT, Henske EP, El-Deiry WS. The p53 target Plk2 interacts with TSC proteins impacting mTOR signaling, tumor growth and chemosensitivity under hypoxic conditions. Cell Cycle 2009; 8: 4168 4175. [DOI] [PMC free article] [PubMed] [Google Scholar]
- Fang M, Jaffrey SR, Sawa A, Ye K, Luo X, Snyder SH. Dexras1: A G protein specifically coupled to neuronal nitric oxide synthase via CAPON. Neuron 2000; 28: 183 193. [DOI] [PubMed] [Google Scholar]
- Oppermann U. Carbonyl reductases: the complex relationships of mammalian carbonyl- and quinine-reducing enzymes and their role in physiology. Annu. Rev. Pharmacol Toxicol 2007; 47: 293 322. [DOI] [PubMed] [Google Scholar]
- Shoshani T, Faerman A, Mett I, Zelin E, Tenne T, Gorodin S, Moshel Y, Elbaz S, Budanov A, Feinstein E. Identification of a novel hypoxia-inducible factor 1-responsive gene, RTP801, involved in apoptosis. Mol Cell Biol 2002; 22: 2283 2293. [DOI] [PMC free article] [PubMed] [Google Scholar]
- Li L, Hung AC, Porter AG. Secretogranin II: a key AP-1-regulated protein that mediates neuronal differentiation and protection from nitric oxide-induced apoptosis of neuroblastoma cells. Cell Death Differ 2008; 15: 879 888. [DOI] [PubMed] [Google Scholar]
- Park WR, Nakamura Y. p53CSV, a novel p53-inducible gene involved in the p53-dependent cell-survival pathway. Cancer Res 2005; 65: 1197 1206. [DOI] [PubMed] [Google Scholar]
- Chen H, Pechenino AS, Liu J, Beattie MC, Brown T, Zirkin B. Effect of glutathione depletion on Leydig cell steroidogenesis in young and old Brown Norway rats. Endocrinology 2008; 149 (5): 2612 2619. [DOI] [PMC free article] [PubMed] [Google Scholar]
- Haider SG. Cell biology of the Leydig cells in the testis. Int Rev Cytol 2004; 233: 181 241. [DOI] [PubMed] [Google Scholar]
- Cooke MS, Evans MD, Dizdaroglu M, Lunec J. Oxidative DNA damage: mechanisms, mutation, and disease. FASEB J 2003; 17: 1195 214. [DOI] [PubMed] [Google Scholar]
- Chen H, Zhou L, Lin CY, Beattie MB, Liu J, Zirkin BR. Effect of glutathione redox state on Leydig cell susceptibility to acute oxidative stress. Mol Cell Endocrinol 2010; 323: 147 154. [DOI] [PMC free article] [PubMed] [Google Scholar]
- Myers RB, Abney TO. The effects of reduced O2 and antioxidants on steroidogenic capacity of cultured rat Leydig cells. J Steroid Biochem 1988; 31: 305 309. [DOI] [PubMed] [Google Scholar]
- Perkins LM, Hall PF, Payne AH. Testosterone-enhanced oxygen-mediated degradation of P-450(17) alpha in mouse Leydig cell cultures. Endocrinology 1988; 122: 2257 2264. [DOI] [PubMed] [Google Scholar]
- Georgiou M, Perkins LM, Payne AH. Steroid synthesis-dependent, oxygen-mediated damage of mitochondrial and microsomal cytochrome P-450 enzymes in rat Leydig cell cultures. Endocrinology 1987; 121: 1390 1399. [DOI] [PubMed] [Google Scholar]
- Klinefelter GR, Ewing LL. Maintenance of testosterone production by purified adult rat Leydig cells for 3 days in vitro. In Vitro Cell Dev Biol 1989; 25: 283 8. [DOI] [PubMed] [Google Scholar]
- Delavoie F, Li H, Hardwick M, Robert JC, Giatzakis C, Péranzi G, Yao ZX, Maccario J, Lacapère JJ, Papadopoulos V. In vivo and in vitro peripheral-type benzodiazepine receptor polymerization: functional significance in drug ligand and cholesterol binding. Biochemistry 2003; 42: 4506 4519. [DOI] [PubMed] [Google Scholar]
- Aggarwal A, Misro MM, Maheshwari A, Sehgal N. Differential modulation of apoptotic gene expression by N-acetyl-L-cysteine in Leydig cells stimulated persistently with hCG in vivo. Mol Cell Endocrinol 2012; 348: 155 164. [DOI] [PubMed] [Google Scholar]
- Aggarwal A, Misro MM, Maheshwari A, Sehgal N, Nandan D. N-acetylcysteine counteracts oxidative stress and prevents hCG-induced apoptosis in rat Leydig cells through down regulation of caspase-8 and JNK. Mol Reprod Dev 2010; 77: 900 909. [DOI] [PubMed] [Google Scholar]
- Aggarwal A, Misro MM, Maheshwari A, Sehgal N, Nandan D. Adverse effects associated with persistent stimulation of Leydig cells with hCG in vitro. Mol Reprod Dev 2009; 76: 1076 1083. [DOI] [PubMed] [Google Scholar]
- Tai P, Ascoli M. Reactive oxygen species (ROS) play a critical role in the cAMP-induced activation of Ras and the phosphorylation of ERK1/2 in Leydig cells. Mol Endocrinol 2011; 25: 885 893. [DOI] [PMC free article] [PubMed] [Google Scholar]
Associated Data
This section collects any data citations, data availability statements, or supplementary materials included in this article.