Abstract
Thoroughbred horses are seasonal mating animals, raised in northern regions or countries. Foals born yearly in spring generally show a typical seasonal compensatory growth pattern, in which their growth rate declines in the first winter and increases in the next spring. In this study, a new empirical adjustment approach is proposed to adjust for this compensatory growth when growth curve equations are estimated, by using 1,633 male body weights of Thoroughbreds as an illustrating example. Based on general Richards growth curve equation, a new growth curve equation was developed and fit to the weight-age data. The new growth curve equation had a sigmoid sub-function that can adjust the compensatory growth, combined with the Richards biological parameter responsible for the maturity of animals. The unknown parameters included in the equations were estimated by SAS NLMIXED procedure. The goodness of fit was examined by using Akaike’s Information Criterion (AIC). The AIC values decreased from 13,053 (general Richards equation) to 12,794 (the newly developed equation), indicating the better fit of the new equation to the weight-age data. The shape of the growth curve was improved during the period of compensatory growth. The proposed method is one of the useful approaches for adjusting seasonal compensatory growth in growth curve estimations for Thoroughbreds, and for their management during the compensatory period. Based on this approach, the optimal growth curve equations can be estimated also for female body weight of Thoroughbreds or other growth traits affected by seasonal compensatory growth.
Keywords: body weight, compensatory growth, growth curve, sigmoid function, Thoroughbred colt
Thoroughbred horses are seasonal breeders, and engage in their mating activities during early spring so that their foals born 340 days later can take advantage of the milder temperatures and abundant forage in the next spring. Due to the seasonal mating, young Thoroughbred foals experience their first winter season almost simultaneously. They exhibit seasonal compensatory growth that is characterized by a reduced growth rate in the first winter and an accelerated growth rate in the following spring.
The seasonal compensatory growth is clearly found in the change of body weight or average daily gain of yearling Thoroughbreds especially in northern areas or countries [1]. Until now, there have been many studies investigating the seasonal change of horses’ growth rate [2, 6, 13, 14] or determining the appropriate growth curve for the surveyed horses [8, 11]. However, empirical growth curve equations adjusted for the compensatory growth have not been estimated so far.
Careful feeding management during the period of compensatory growth, based on useful standard growth curves, is important to secure the development of young Thoroughbred horses. The objective of this study was to estimate the single growth curve equation empirically adjusted for seasonal compensatory growth for male body weight of Thoroughbreds by using sigmoid sub-functions. In this study, the male body weight was only analyzed in order to illustrate an example for this approach.
Materials and Methods
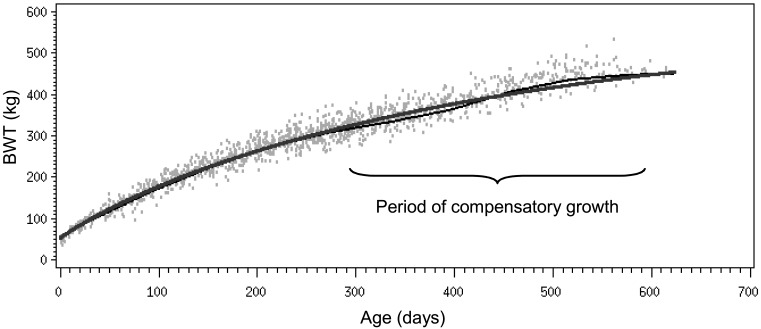
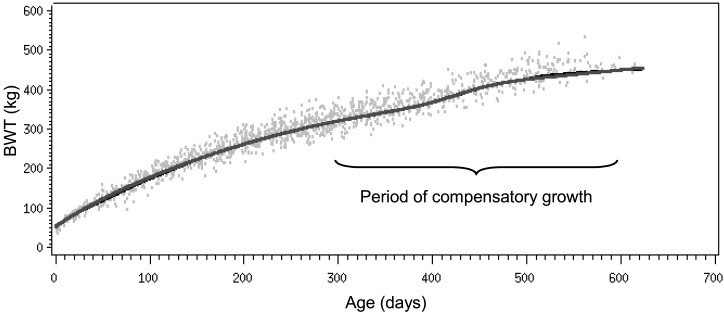
A total of 1,633 male body weight (BWT) and age measurements, for 232 Thoroughbred colts, were collected by the Japan Bloodhorse Breeders’ Association (JBBA) between 2005 and 2009. The data with extreme values over ± 4 residual standard deviations were preliminary analyzed by using Logistic growth curve equation, and removed from this study. The scatterplot of the weight-age data is shown with gray dots in Fig. 1. In the figure, the tendency of the seasonal compensatory growth can be recognized between about 300 and 600 days, which is the period of compensatory growth.
Fig. 1.
Scatterplot of the 1,633 male body weight (BWT) data of Thoroughbred colts (light gray dots). Thin black line indicates expected (actual) data averages of BWT, and the thick gray line indicates estimated Richards growth curve (i.e., Equation 2).
Seven sigmoid growth curve equations (Logistic, Gompertz, von Bertalanffy, Brody, Richards, Bridges and Janoscheck; see [7]) were fit to the weight-age data. The best-fit equation based on Akaike’s Information Criterion (AIC) was the Richards equation [10] as follows:
 |
(Equation 1)
In this “general” Richards equation (Equation 1), body weight (BWT, kg) is described as a function of age (t, day). The biological interpretations of the four parameters (A, B, k and m) have been discussed previously [13]. Briefly, A is the asymptotic limit for BWT as t approaches infinity; B is a scaling parameter that defines the degree of maturity; k is a rate constant that determines the spread of the curve along the time axis; m is the point of inflection in the sigmoid curve in relation to age.
These unknown parameters were estimated by the SAS NLMIXED procedure [12]. The estimated Richards equation using the weight-age data was as follows:
 |
(Equation 2)
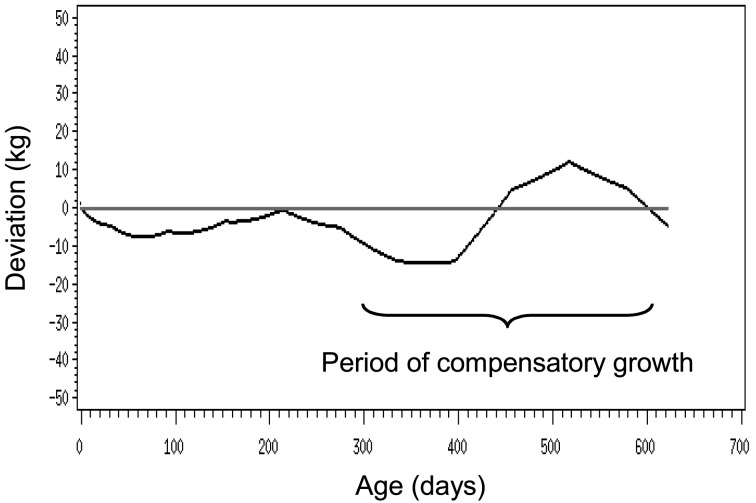
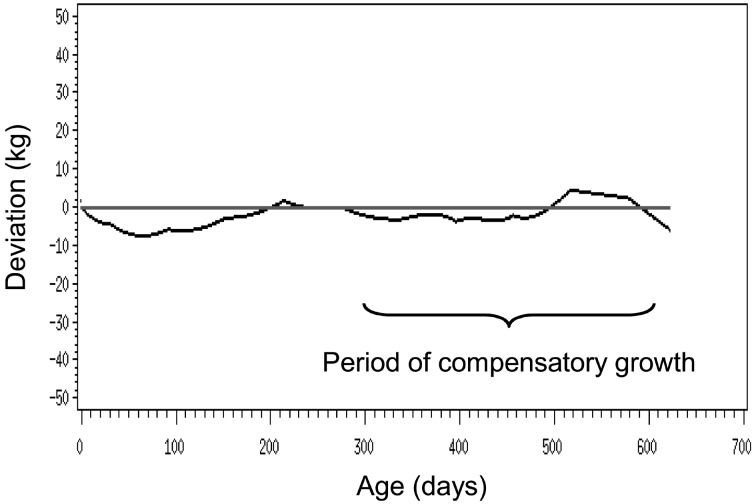
In Fig. 1, the thick gray line indicates the estimated Richards growth curve listed on Equation 2, and the thin black line is a plot of the expected (actual) data averages of the BWT, where the averages were computed based on the monthly averages of the BWT data and their monthly daily gain. This thin black line is identical to that published in the Japanese Feeding Standard for Horses [4]. The deviation of the thin black line (expected data averages) from the thick gray line (Richards growth curve) is clear between about 300 and 600 days. The deviation of the expected data averages from the Richards growth curve is shown in Fig. 2, where the largest deviations are recognized during the period of compensatory growth.
Fig. 2.
Deviation of the expected (actual) data averages of the male body weight (BWT) from the estimated Richards growth curve (i.e., Equation 2).
To adjust for the deviation caused by compensatory growth shown in Fig. 2, a sigmoid sub-function was designed as follows. A general sigmoid function f(t) is expressed as:
 |
(Equation 3)
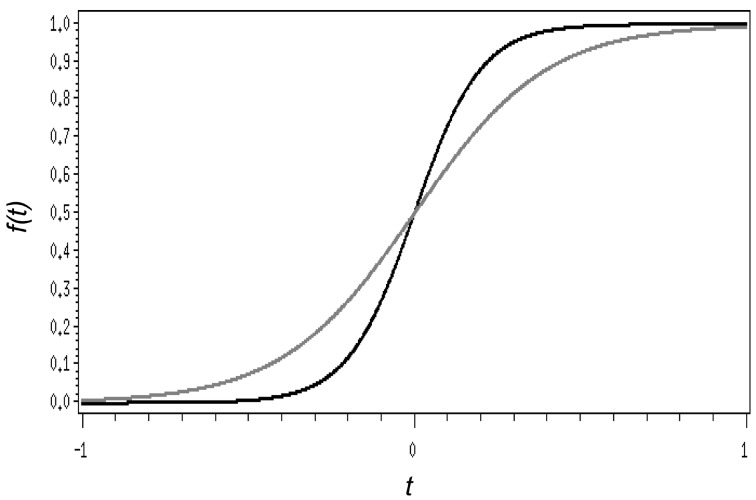
where e is the base of the natural logarithm, t is time, where –∞ < t < ∞, and 0 ≤ f(t) ≤ 1. A sigmoid function is a monotonous increase function, and the shapes of the function depend on the α values. We chose α values of 5 and 10. The results around –1 ≤ t ≤ 1 are shown in Fig. 3.
Fig. 3.
Sigmoid curve with two different values of α. Black and gray lines are with α=10.0 and α=5.0, respectively.
The subtraction between two sigmoid functions with different α values leads to a function having only a single wave (down and up wave) at t=0. By using this subtraction and application of several modifications around the t parameter, the following sigmoid sub-function f’(t) can be obtained:
 |
(Equation 4)
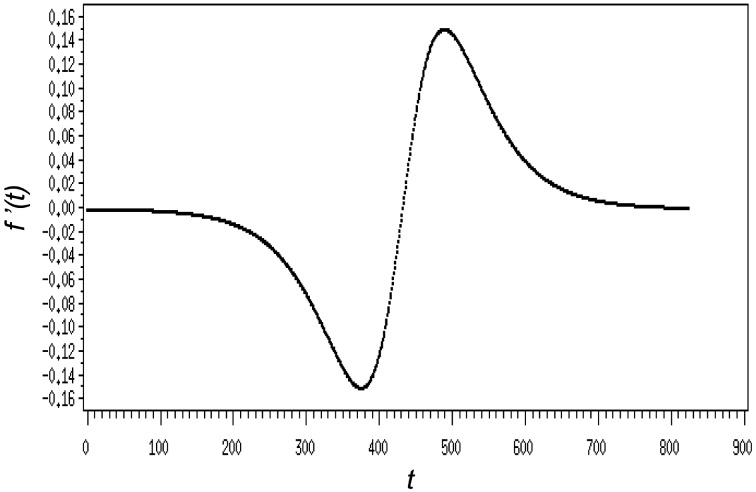
and the shape of the sub-function is shown in Fig. 4. This sub-function curve crosses the x axis at 432 days with the wave length (i.e., distance between the starting and ending point of the wave) of 268.49*2. This sub-function has zero value when t = –∞ or ∞. Only when t is around 432 days, do the non-zero f’(t) values appear. This characteristic of the sub-function is like the shape of the deviation shown in Fig. 2 especially for the period of compensatory growth. Therefore, it was assumed that the f’(t) sub-function can empirically adjust the deviation caused by compensatory growth. In the original Richards equation (Equation 1) the maturity related parameter is B, and the newly developed f’(t) sub-function can be used for the adjustment of the B parameter.
Fig. 4.
Constructed sigmoid sub-function f’(t) for adjustment of seasonal compensatory growth.
Results and Discussion
In general, the newly developed f’(t) sigmoid sub-function can be added to the B parameter in Equation 1. Specifically, this leads to the replacement of “–0.94513” by “–0.94513 + β*f’(t)” in Equation 2 where β is a coefficient of f’(t). With this replacement and combination of Equation 2 and Equation 4, the growth curve equation adjusting for the seasonal compensatory growth was obtained as:
 |
(Equation 5)
The optimal coefficient value of 0.3582 (i.e., β, the coefficient of f’(t)) and also the optimal wave length of 268.49 were estimated again by using the weight-age data and SAS NLMIXED procedure. Equation 5 looks complicated but is a single function of age t in days. The insertion of f’(t) in Equation 5 affects the BWT only when t is within about 432 ± 268.49 days. The growth curve of this new Richards equation (Equation 5) combined with the sigmoid sub-function is shown with thick gray line in Fig. 5, where the black line and dots are the same as in Fig. 1. As shown in Fig. 5, the shapes of the two lines were almost identical in the period of compensatory growth. By using this approach, the AIC value decreased from 13,053 (Equation 2) to 12,794 (Equation 5), indicating the better fit of Equation 5 to the weight-age data than Equation 2.
Fig. 5.
Scatterplot of the 1,633 male body weight (BWT) data of Thoroughbred colts (light gray dots). Thin black line indicates expected (actual) data averages of BWT, and thick gray line indicates estimated Richards growth curve with the developed sigmoid sub-function (i.e., Equation 5).
The deviation of the expected data averages from the new Richards growth curve adjusting for compensatory growth is shown in Fig. 6. The deviation in the period of compensatory growth is clearly reduced when compared to the case of non-adjusted (Fig. 2). These results suggest the usefulness of this proposed approach for handling compensatory growth typical in Thoroughbred horses.
Fig. 6.
Deviation of the expected (actual) data averages of the male body weight (BWT) from the estimated Richards growth curve with the developed sub-function (i.e., Equation 5).
As Richards [10] noted, some researchers may consider that the parameter B is unimportant biologically. We can choose an alternative approach to adjust parameter k by the sub-function. If k was adjusted by the f’(t) sub-function, the combined equation became more complicated and difficult in numerical computation for parameter estimation because parameter k is the one used in the exponential. We aimed at simplicity for the combined equation, and chose B parameter to be adjusted in the f’(t) sub-function.
Accounting for compensatory growth in Thoroughbreds, Staniar et al. [13] assumed that their growth rate consists of baseline and systematic deviation components. Even though they did not propose any unique growth curve equations handling compensatory growth, their idea shows a similarity to our approach of using both standard Richards function as the baseline and sigmoid sub-function as the systematic deviation. France et al. [5] showed a biphasic growth curve equation by combining two different equations with different phases (i.e., two different periods of age), and this may be an alternative approach to handle the compensatory growth because it has generally two different phases. Recently, Wan et al. [15] and Yin et al. [16] proposed their new sigmoidal growth curve functions but these equations seem not to be applicable for handling compensatory growth.
Concerning developmental orthopaedic disease in horses, Donabedian et al. [3] investigated the relationship between nutrient intake and growth rate, and Raub [9] discussed the making of a durable equine. The standard growth curve equation handling compensatory growth would be useful for such experiments that relate secure development of Thoroughbred horses in winter and spring time.
In conclusion, the proposed method in this study is one of the useful approaches for adjusting seasonal compensatory growth in growth curve estimations for Thoroughbreds. Based on this approach, the optimal growth curve equations can be estimated also for female BWT data of Thoroughbreds or another growth traits such as body height or entire width of chest that are considered to be also affected by seasonal compensatory growth. Further studies are also awaited for these traits. This approach is easily applicable to the general sigmoidal growth curve equation families such as those having biological parameters (e.g. A, B and k parameters in Richards equation).
Acknowledgements
We would like to thank the Racehorse Breeding Promotion Program (2005–2010) organized by the National Association of Racing (NAR), through which the Japan Bloodhorse Breeders’ Association was able to conduct its equine nutrition consulting study program as part of the Bloodstock Industry Business Management Training Program, and also the Japan Racing Association (JRA) Hidaka Yearling Training Farm, for providing growth data of horses as study material for this research. We also would like to thank Dr. Malcolm Fitz-Earle, Capilano University, Canada for revisions to this manuscript.
References
- 1.Brown-Douglas C.G., Pagan J.D.2006. Body weight, wither height and growth rates in Thoroughbreds raised in America, England, Australia, New Zealand and India. pp.213–220. In: Advances in Equine Nutrition, Vol. IV 2004–2008, Kentucky Equine Research.
- 2.Brown-Douglas C.G., Parkinson T.J., Firth E.C., Fennessy P.F.2005. Bodyweights and growth rates of spring- and autumn-born Thoroughbred horses raised on pasture. N. Z. Vet. J. 53: 326–331 [DOI] [PubMed] [Google Scholar]
- 3.Donabedian M., Fleurance G., Perona G., Robert C., Lepage O., Trillaud-Geyl C., Leger S., Ricard A., Bergero D., Martin-Rosset W.2006. Effect of fast vs. moderate growth rate related to nutrient intake on developmental orthopaedic disease in the horse. Anim. Res. 55: 471–486 [Google Scholar]
- 4.Equine Research Institute 2004. Japanese Feeding Standard for Horses ( 2004). pp.11–14. In: Equine Research Institute, Japan Racing Association (JRA). Utsunomiya.
- 5.France J., Dijkstra J., Thornley J.H.M., Dhanoa M.S.1996. A simple but flexible growth function. Growth Dev. Aging 60: 71–83 [PubMed] [Google Scholar]
- 6.Hintz H.F., Hintz R.L., Van Vleck L.D.1979. Growth rate of Thoroughbreds. Effects of age of dam, year and month of birth, and sex of foal. J. Anim. Sci. 48: 480–487 [DOI] [PubMed] [Google Scholar]
- 7.Köhn F., Sharifi A.R., Simianer H.2007. Modeling the growth of the Goettingen minipig. J. Anim. Sci. 85: 84–92 [DOI] [PubMed] [Google Scholar]
- 8.Morel P.C.H., Bokor A., Rogers C.W., Firth E.C.2007. Growth curves from birth to weaning for Thoroughbred foals raised on pasture. N. Z. Vet. J. 55: 319–325 [DOI] [PubMed] [Google Scholar]
- 9.Raub R.H.2010. Growing more durable equine athletes. Comp. Exerc. Physiol. 7: 49–56 [Google Scholar]
- 10.Richards F.J.1959. A flexible growth function for empirical use. J. Exp. Bot. 10: 290–300 [Google Scholar]
- 11.Santos S.A., Souza G.S., Oliveira M.R., Sereno J.R.1999. Using nonlinier models to describe curves in Pantaneiro horses. Pesquisa Agropecu. Bras. 34: 1133–1138 [Google Scholar]
- 12.SAS Institute Inc2008. SAS/STAT user’s guide, version 9.2 edition. SAS Institute Inc., Cary, North Carolina. [Google Scholar]
- 13.Staniar W.B., Kronfeld D.S., Treiber K.H., Splan R.K., Harris P.A.2004. Growth rate consists of baseline and systematic deviation components in Thoroughbreds. J. Anim. Sci. 82: 1007–1015 [DOI] [PubMed] [Google Scholar]
- 14.Staniar W.B., Kronfeld D.S., Treiber K.H., Splan R.K., Harris P.A.2005. Thoroughbred growth characterized by a baseline and systematic deviation. pp.61–63. In: The Growing Horse: Nutrition and Prevention of Growth Disorders. European Association for Animal Production publication, 114.
- 15.Wan X., Zhong W., Wang M.1998. New flexible growth function and its application to the growth of small mammals. Growth Dev. Aging 62: 27–35 [PubMed] [Google Scholar]
- 16.Yin X., Goudriaan J., Lantinga E.A., Vos J., Spiertz H.J.2003. A flexible sigmoid function of determinate growth. Ann. Bot. (Lond.) 91: 361–371 [DOI] [PMC free article] [PubMed] [Google Scholar]


