

Abstract
Hamsters will spontaneously ‘split’ and exhibit two rest–activity cycles each day when housed in constant light (LL). The suprachiasmatic nucleus (SCN) is the locus of a brain clock organizing circadian rhythmicity. In split hamsters, the right and left SCN oscillate 12 h out of phase with each other, and the twice-daily locomotor bouts alternately correspond to one or the other. This unique configuration of the circadian system is useful for investigation of SCN communication to efferent targets. To track phase and period in the SCN and its targets, we measured wheel-running and FOS expression in the brains of split and unsplit hamsters housed in LL or light–dark cycles. The amount and duration of activity before splitting were correlated with latency to split, suggesting behavioral feedback to circadian organization. LL induced a robust rhythm in the SCN core, regardless of splitting. Whereas the split hamsters’ SCNs exhibited 24-h rhythms of FOS that cycled in antiphase between left and right and between core and shell subregions, the medial preoptic area, paraventricular nucleus of the hypothalamus, dorsomedial hypothalamus and orexin-A neurons all exhibited 12-h rhythms of FOS expression, in-phase between hemispheres, but with detectable right–left differences in amplitude. Importantly, in all conditions studied, the onset of FOS expression in targets occurred at a common phase reference point of the SCN oscillation, suggesting that each SCN may signal these targets once daily. Finally, the transduction of 24-h SCN rhythms to 12-h extra-SCN rhythms indicates that each SCN signals both ipsilateral and contralateral targets.
Keywords: entrainment, locomotor activity, orexin, oscillator, suprachiasmatic nucleus
Introduction
Circadian rhythms of physiology and behavior are synchronized by a master clock in the suprachiasmatic nucleus (SCN) and by oscillators distributed throughout the brain and body (Dibner et al., 2010). The circadian system is plastic, and adopts different configurations of period and phase depending on environmental conditions. Constant light (LL) can induce ‘splitting’ in hamsters, such that the 24-h circadian day doubles in frequency to create 12-h days. In split animals, activity, body temperature and hormone secretion rhythms peak twice per day instead of once (Pittendrigh & Daan, 1976; Pickard et al., 1984; Swann & Turek, 1985). During splitting, the left and right sides of the SCN are uncoupled and resynchronize 12 h apart in antiphase. In this dramatic example of lateralization of function, one side of the SCN shows day-typical elevation of Period1 expression, whereas the other side shows night-typical elevation of Bmal1 expression (de la Iglesia et al., 2000; Ohta et al., 2005). Furthermore, antiphase oscillations of FOS and PERIOD1 (PER1) occur between functionally distinct core and shell subregions within each side of the SCN (Tavakoli-Nezhad & Schwartz, 2005; Yan et al., 2005).
The characteristic antiphase oscillations in the split brain clock provide a unique model with which to explore how the SCN sets phase in its target areas. The SCN projects to diencephalic regions that subserve rhythmic physiology and behavior (Watts et al., 1987; Kalsbeek et al., 1993; Kriegsfeld et al., 2004), but when the SCN communicates phase remains poorly understood. Previously, the SCN-to-target relationship in split hamsters was addressed by assessing lateralization in extra-SCN areas at one or two time points, and the left–right differences detected were small (de la Iglesia et al., 2003; Tavakoli-Nezhad & Schwartz, 2005; Yan et al., 2005; Gibson et al., 2008). Nevertheless, it is not known whether extra-SCN areas remain rhythmic, and, if they do, what their phase and period may be.
The SCN may signal various target areas at different times of day, by target-specific phase-setting cues (Kalsbeek et al., 2006; Butler & Silver, 2009). If this were so, target regions would vary in phase, and in split hamsters there would be a 12-h phase difference between hemispheres. In the present study, we identified four candidate target areas to test this – medial preoptic area (MPOA), paraventricular nucleus of the hypothalamus (PVN), dorsomedial nucleus (DMH), and lateral hypothalamic orexin-A (ORX) neurons. These regions and neurons within these regions are rhythmic (Estabrooke et al., 2001; Christian et al., 2005; Girotti et al., 2009; Guilding et al., 2009), are innervated by SCN efferents (Morin et al., 1994; Abrahamson et al., 2001), and are important components of reproductive and arousal systems that split (Swann & Turek, 1985; de la Iglesia et al., 2003; Mochizuki et al., 2004). To control for the effects of light, we also studied unsplit animals in a light–dark cycle and LL. In addition to empirical evidence of the effects of LL, theoretical models suggest that feedback from the periphery may contribute to splitting (Carpenter & Grossberg, 1985). We therefore monitored wheel-running activity to identify novel behavioral characteristics that may predict splitting.
Materials and methods
Animals and behavior
Male Syrian hamsters (Mesocricetus auratus, strain LVG), aged 6–8 weeks, were obtained from Charles River (Wilmington, MA, USA) and allowed to acclimate in our facility in a 14-h : 10-h light-dark cycle for 1 week. Hamsters were housed individually in clear polycarbonate cages (45 × 24 × 19 cm), equipped with a running wheel (15 cm in diameter). Food (LabDiet 5001; PMI Nutrition, Brentwood, MO, USA) and water were available ad libitum. Hamsters were then either exposed to a 12-h : 12-h light–dark cycle (LD) or constant light (LL) for 1–3 months. There were three experimental groups: LD unsplit (n = 32), LL unsplit (n = 36), and LL split (n = 25). LD unsplit hamsters were humanely killed at 3-h intervals, beginning at zeitgeber time (ZT)12 (time of lights-off) after 3 weeks in LD. After 1–3 months in LL, split and unsplit hamsters were killed at activity onset [circadian time (CT)] and at intervals of three circadian hours (period/24 thereafter. Note that LD and LL result in similar phenotypes, as 3 weeks in a 12-h photoperiod is not sufficient to elicit seasonal changes in activity and reproductive function (Larkin et al., 2002). In addition to the LL unsplit hamsters analyzed here, some behaviorally unsplit hamsters had split SCN FOS expression, as previously observed (de la Iglesia et al., 2003; Yan et al., 2005). Owing to the small number of animals (n = 11) and uneven representation across time points, these animals were not analyzed. All procedures were approved by the Columbia University Institutional Animal Care and Use Committee.
Locomotor activity
Wheel-running activity was monitored remotely with Vitalview (Mini Mitter, Bend, OR, USA), with counts collected in 10-min bins. For all LL hamsters, period and phase of the free-running rhythms were determined by a regression line fit to activity onsets over the last 7–10 days of activity (ClockLab; Actimetrics, Wilmette, IL, USA). In addition, period, amount, and duration (alpha) of activity at baseline (days 9–18 of LL) were measured for all hamsters (n = 28) for which we had full activity records from initial transfer to LL until splitting. This baseline interval was selected because activity rhythms are stable with no evidence of transients from prior LD. Activity onset and offset were calculated from the 10-day average daily activity profile (mean counts per 10 min plotted against CT), after correcting for free-running period. Onset was scored as the first point that was greater than mean activity, after which this level was sustained in three of the following six bins. Similarly, offset was the last point greater than the mean, before which activity had exceeded this threshold in three of six bins (Butler et al., 2008). Duration was offset minus onset.
Immunohistochemistry
Hamsters were injected intraperitoneally with a lethal dose of sodium pentobarbital (200 mg/kg), and then perfused transcardially with 100 mL of 0.9% saline, followed by 150 mL of 4% freshly depolymerized paraformaldehyde in 0.1 M phosphate buffer (PB, pH 7.4). The brains were removed, post-fixed for 12–24 h in 4% paraformaldehyde, and then cryoprotected in 20% sucrose in PB. The left side of the brain was marked by a cut in the cortex, and sections were then cut at 40 μm through the hypothalamus in three series on a cryostat (Microm HM 500 M; Thermo-Scientific, Walldorf, Germany). In cases where processing was to follow immediately, sections were collected in PB; otherwise, sections were collected in antifreeze (30% w/v sucrose, 1% w/v PVP-40, 30% v/v ethylene glycol, in PB with 0.9% NaCl) and stored at −20 °C until processed, as previously described (Yan et al., 2005).
For immunohistochemistry, sections were washed in PB, treated with 0.5% H2O2 if the signal was to be developed with diaminobenzidene (DAB), washed in PB with 0.1% Triton-X, blocked in 2% normal serum (goat or donkey to match the secondary antibody) in PB with 0.3% Triton-X, and then incubated for 48 h at 4 °C with primary antibody diluted in PB with 0.3% Triton-X. After the primary antibody step, sections were incubated with either fluorophore-conjugated or biotinylated secondary antibodies. In the latter case, the signal was amplified with avidin biotin complex (Vector Laboratories, Burlingame, CA, USA), and visualized with NiSO4-enhanced DAB (Sigma Aldrich, St Louis, MO, USA). Sections were washed thoroughly in PB with 0.1% Triton-X 0.1 between each step. After staining, sections were washed again in PB, mounted on gelatin-subbed slides, dehydrated through alcohols, cleared in xylenes, and cover-slipped with Permount (Fisher, Pittsburgh, PA, USA) or Krystalon for fluorescent sections (EMD Chemicals, Gibbstown, NJ, USA).
Immunohistochemistry was performed with the following primary antibodies: rabbit anti-FOS (1: 10 000, sc-52; Santa Cruz Biotechnology, Santa Cruz, CA, USA), goat anti-PER1 (1: 4000, gift of M. Lehman, University of Michigan), guinea pig anti-arginine vasopressin (AVP) (1: 5000, T-5048; Peninsula Laboratories, San Carlos, CA, USA), and goat anti-ORX (1: 5000, sc-8070; Santa Cruz Biotechnology). Secondary antibodies were used at 1: 200 [biotinylated, made in goat (Vector Laboratories); Cy2-conjugated, Cy3-conjugated, or Cy5-conjugated, made in donkey (Jackson Laboratories, West Grove, PA, USA)].
Quantification
Gray-scale images were captured with a Nikon Eclipse E800 microscope (Nikon, Tokyo, Japan) equipped with a cooled CCD camera (Retiga Exi; Q-Imaging, Surrey, Canada), with Q-CAPTURE PRO software (Q-Imaging). Images were standardized by adjusting the minimum and maximum brightness to the ends of the optical density distribution (levels function, PHOTOSHOP; Adobe Systems, Mountain View, CA, USA).
Regions of interest were identified by anatomical landmarks according to Morin and Wood (2001). The areas scored are shown in Fig. 1, and were delineated as follows.
Fig. 1.
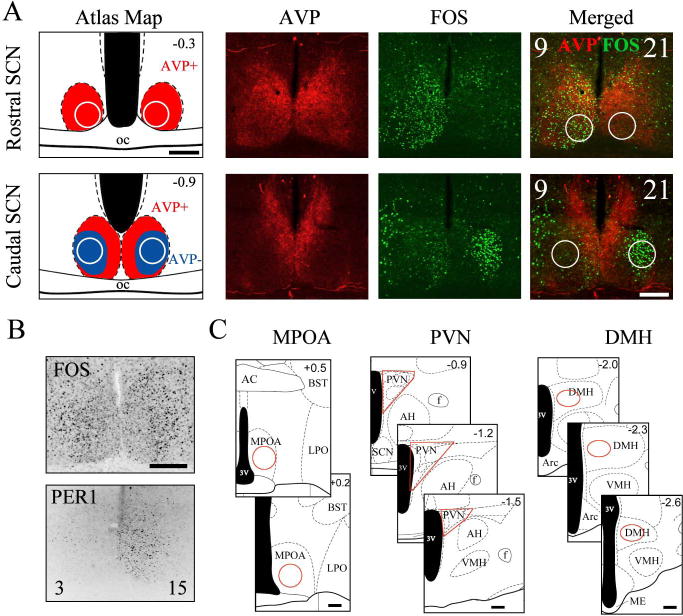
Areas examined. (A) Circles delineate areas used to quantify FOS in the shell (red, AVP-positive region) and core (blue, AVP-negative region). Representative double-labeled photomicrographs from a split hamster show the counting areas against AVP and FOS expression. CTs for the left and right sides of the brain are shown in the merged panel. (B) Subjective day and night were confirmed in CT3/CT15 hamsters by high PER1 immunoreactivity on the CT15 side. (C) Red outlines delineate counting areas in extra-SCN regions. All coronal schematics from Morin and Wood (2001); position relative to bregma (mm) is shown in the corner of each panel. AC, anterior commissure; AH; Arc, arcuate; BST, bed nucleus of the stria terminalis; f, fornix; LPO, lateral preoptic area; ME, median eminence; oc, optic chiasm; VMH, ventromedial hypothalamus. Scale bar: 200 μm.
SCN shell: a 150-μm-diameter circle placed along the edge of the optic chiasm in the rostral SCN (bregma −0.3 mm). This falls within the region containing AVP-immunoreactive cells and fibers as observed in adjacent sections (Fig. 1A).
SCN core: a 150-μm-diameter circle placed 100 μm laterally from the midline and 80 μm above the optic chiasm in the caudal SCN (bregma −0.9 mm). This area lacks AVP expression. In some split hamsters killed 3 h after activity onset (CT3/CT15), assigning day and night to the left and right sides was ambiguous on the basis of FOS expression alone. For these, the subjective night side (CT15) was determined by high PER1 immunoreactivity in the shell (Fig. 1B) (Yan et al., 2005).
MPOA: a 350-μm-diameter circle, placed 80 μm from both the midline and the optic chiasm. The numbers of FOS cells were averaged over two or three sections (Fig. 1C; left and right sides were averaged for unsplit hamsters; bregma +0.2 to +0.5 mm).
PVN: PVN boundaries were set with DAB-stained sections: in this material, the PVN can be distinguished by its greater cell density than in surrounding regions. The number of FOS-positive cells was scored in three or four sections (bregma −0.9 to −1.5 mm).
DMH: an ellipse (400 × 350 μm) was centered in the DMH, and the number of FOS-positive cells was scored in three or four sections (bregma −2.0 to −2.6 mm).
ORX neurons: total ORX-labeled and ORX/FOS-colabeled neurons were counted in a 525 × 425-μm rectangle in the lateral hypothalamus centered on the region containing the greatest number of ORX neurons.
For scoring of FOS, the areas to be counted were overlaid on photomicrographs with Adobe PHOTOSHOP. To score the numbers of ORX-immunoreactive neurons and the fraction containing FOS, gray-scale images of each were pseudocolored and overlaid with Adobe PHOTOSHOP. ORX-positive and FOS-positive cells were counted by two observers blind to experimental group. Inter-rater reliability was assessed by Pearson correlation (R = 0.96).
Laterality
Sections of split hamsters were oriented such that the subjective day side of the SCN was on the left. For analysis, the degree of laterality in FOS expression was calculated as the percentage of the total number of FOS cells that were on one side.
Statistics
t-Tests were used to detect differences in activity parameters between the LL split and LL unsplit groups. One hamster from the unsplit group was removed because his free-running period was more than two standard deviations above the mean (z-score = 2.55); this did not affect the conclusions. Regression analysis was used to calculate the relationship of baseline activity parameters with splitting latency. Two-way ANOVA was used to determine the effects of time of day and photic condition in LD and LL unsplit hamsters, followed by Tukey–Kramer tests where appropriate. For LL split hamsters, the effects of time were assessed by one-way ANOVA, treating the four subjective day time points (CT0, CT3, CT6, and CT9) and the contralateral subjective night time points (CT12, CT15, CT18, and CT21) as a single sequence of eight consecutive points (CT0–CT21). Repeated measures ANOVA was used to determine the effects of time of day (unpaired factor) and side of brain (paired) on FOS expression, assessed as a series of time points comparing the CT3–CT12 sides against the contralateral CT15–CT0 sides. Paired t-tests at individual time points were used when an overall significant lateralization was detected by ANOVA (STATVIEW; SAS Institute, Cary, NC, USA). Cosinor analysis was used to further test for 24-h and 12-h periodicity in the data series (Nelson et al., 1979). Data were fit to the function f(t) = yo + a cos(2πt + b) + c cos(4πt + d), with SIGMAPLOT 12.0 (Systat Software, Chicago, IL, USA). Goodness of fit was assessed by sum of squares and ANOVA, first for the combined model, and then separately for the 24-h and 12-h components, by setting a and c to 0, respectively, with Excel (Microsoft, Redmond, WA, USA). Results were considered significant at P < 0.05.
Results
Wheel-running activity
A representative record of a split hamster is shown in Fig. 2A. Over the course of 3 months, 17 of the 28 hamsters with complete activity records split (61%; Fig. 2B). Latency to split was inversely correlated with amount and duration of baseline wheel-running activity in LL (Fig. 2C and E; amount, R2 = 0.45, F1,16 = 12.2, P < 0.01; duration, R2 = 0.28, F1,16 = 5.75, P < 0.05) but not with period (Fig. 2G; R2 = 0.06, F1,16 = 0.97, P = 0.34). On average, hamsters that split in LL had a longer period and a trend towards longer duration than those that did not split in LL (Fig. 2D, F, and H; amount, t25 = 1.05, P = 0.30; duration, t25 = 1.91, P = 0.07; period, t25 = 1.71, P = 0.03).
Fig. 2.
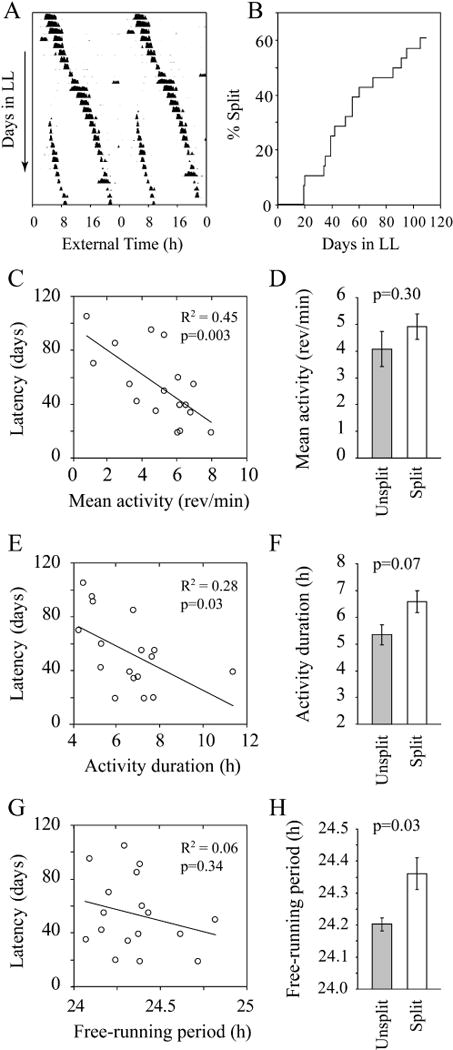
Splitting latency and activity measures. (A) Double-plotted actogram of a representative split hamster in LL. (B) Splitting latency cumulative distribution (n = 28). (C–H) The left panels show the relationship between baseline activity, duration, and period measures and splitting latency with the best fit regression line. The right panels show means (± standard error) for each of these measures divided by whether the hamsters split or not.
SCN FOS expression
Photomicrographs of FOS in the rostral and caudal SCN at 3-h intervals are shown in Fig. 3. In both LD (n = 32) and LL (n = 31) unsplit hamsters, there was high expression in the SCN shell region from CT3 to CT12. Whether or not the hamsters had split, LL housing resulted in high FOS expression in the core from CT15 to CT0. In the LL split group, FOS expression was high on one side in the rostral SCN, and on the contralateral side in the caudal SCN core (Fig. 3, right panels).
Fig. 3.
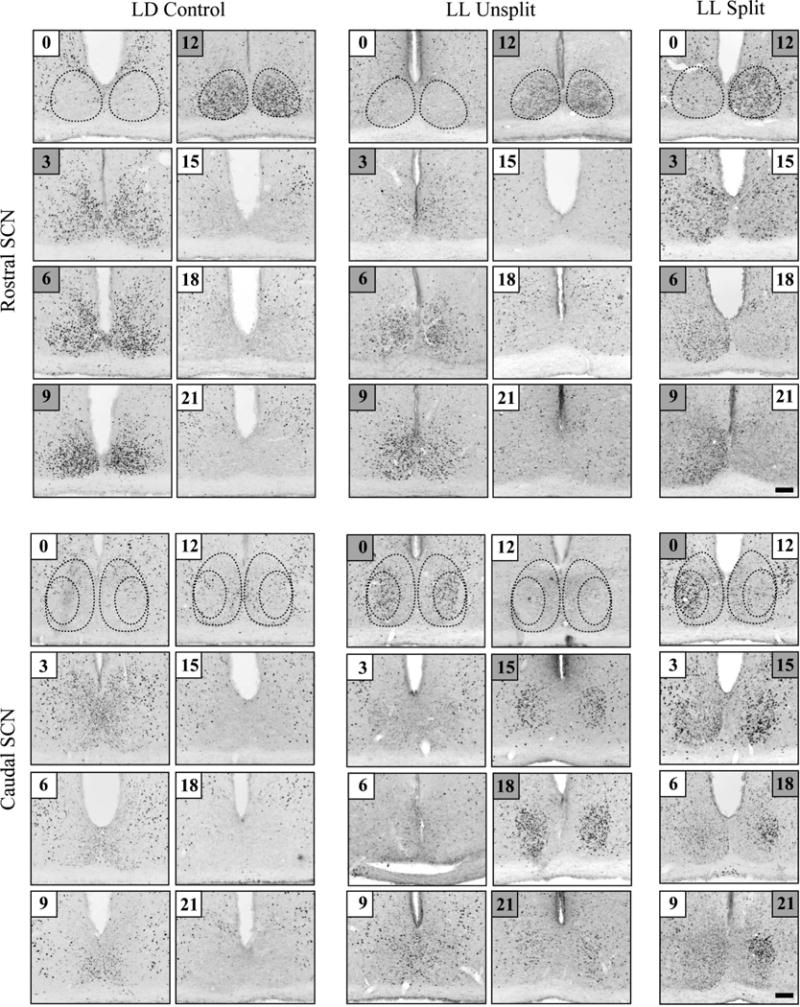
FOS expression in the rostral (top) and caudal SCN (bottom) in three groups. Dotted lines delineate the SCN shell rostrally, and the core and shell caudally, on the basis of AVP immunoreactivity. The time sampled (zeitgeber or circadian) is boxed in each image. Time points with high FOS expression are indicated by gray shading (3–12 in the rostral SCN shell in LD and LL unsplit hamsters, and 15–0 in the core of LL unsplit hamsters). Times were assigned to the split SCN by matching the high-expression and low-expression sides to the corresponding high and low time points in the unsplit control animals. Scale bar: 100 μm.
In each split hamster, the left and right sides of the brain were identified as CT0–CT9 or CT12–CT21 by matching the FOS expression pattern to the patterns observed in unsplit hamsters, as done previously with PER1 (Yan et al., 2005).
Laterality
In the SCN, FOS expression was not lateralized in unsplit hamsters (Fig. 4, left and middle columns). In contrast, lateralization was detected in the core and shell SCN of split hamsters, such that as much as 90% of the total FOS of core and shell was expressed on one side (Fig. 4, right column: shell, time, F3,20 = 0.04, P = 0.99; shell, side, F1,20 = 120, P < 0.001; interaction, F3,20 = 2.2, P = 0.13; core, time, F3,21 = 0.4, P = 0.8; core, side, F1,21 = 110, P < 0.001; interaction, F3,21 = 2.7, P = 0.07). The directions of laterality for the core and shell were opposite, as previously reported (Yan et al., 2005). In extra-SCN regions, FOS expression was significantly lateralized in the PVN and DMH, and was close to significant in the MPOA (MPOA, time, F3,20 = 3.1, P < 0.05; MPOA, side, F1,20 = 4.2, P = 0.053; interaction, F3,20 = 0.6, P = 0.6; PVN, time, F3,22 = 2.9, P = 0.06; PVN, side, F1,22 = 12.6, P < 0.01; interaction, F3,20 = 1.6, P = 0.2; DMH, time, F3,20 = 2.7, P = 0.07; DMH, side, F1,20 = 9.5, P < 0.01; interaction, F3,20 = 0.9, P = 0.5). For all three regions, there was more FOS on the side of the brain with high SCN core FOS (i.e. the subjective night side). In contrast to the large right–left differences seen within the SCN, outside the SCN the amount of FOS on one side never exceeded 59% of the total.
Fig. 4.
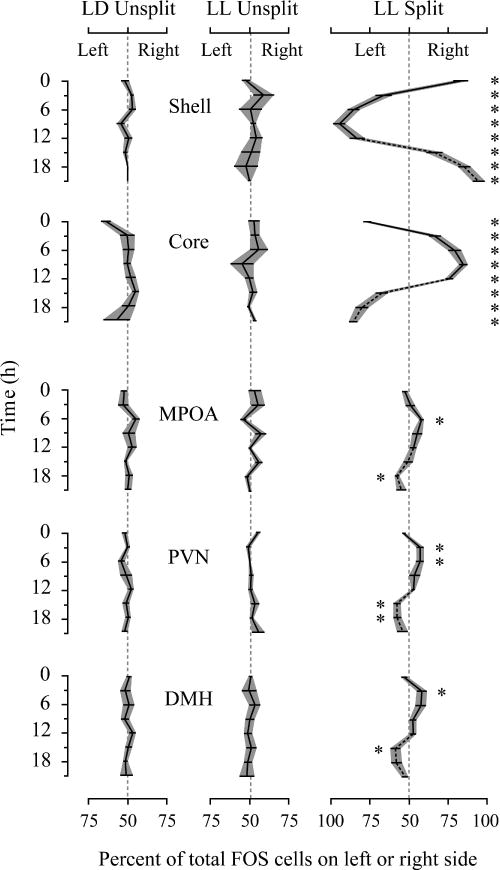
Lateralization. Each panel shows the extent to which FOS is expressed preferentially on the left or right sides of the brain. Gray shading indicates standard error. On the x-axis, 50% designates equal numbers on the left and right sides of the brain, and deviations left and right indicate laterality to the left or right (100% represents all FOS cells on one side). *Paired t-test, P < 0.05 for left vs. right, calculated after repeated measures ANOVA revealed a significant main effect of hemisphere. For LL split hamsters, the reciprocal data are plotted for CT12–CT21 for better visualization. When fewer than five FOS-positive cells were detected in a region for a particular hamster, its laterality score was set to 50%. LD unsplit, n = 32, LL unsplit, n = 31 (3–5/time point). Split, n = 24 (5–7/time point).
Cosinor analysis of 24-h and 12-h rhythmicity
Splitting behavior is associated with a change from 24-h to 12-h rhythmicity in all extra-SCN brain areas studied (ANOVA, effect of time, all P < 0.01). To identify the period and phase of FOS expression rhythms, the data were fit by cosinor analysis combining 24-h and 12-h components (Fig. 5). In both the SCN and the extra-SCN areas, the data were best fit by the combined 2-h + 12-h model (Table 1). Next, the relative strengths of the 24-h and 12-h components of the rhythm were determined by separately testing the fit of each component independently. The SCN exhibited significant 24-h rhythmicity in all groups (R2 ≥ 0.35), with no significant 12-h component (R2 ≤ 0.03) (Fig. 5, top two rows). Extra-SCN areas cycled with a significant 24-h rhythm in LD and LL unsplit hamsters (R2 ≥ 0.27), again without a significant 12-h component (R2 ≤ 0.17) (Fig. 5, columns 1 and 2). In stark contrast, extra-SCN areas in LL split hamsters exhibited 12-h rhythmicity exclusively (R2 ≥ 0.22) (Table 1; Fig. 5, column 3).
Fig. 5.

First three columns: mean (± standard error) number of FOS cells per counting area over time. The curves are cosinor fits to the data for LD unsplit (black), LL unsplit (blue), and LL split on one side (purple) and on the contralateral side (gold) to underscore the side-to-side differences. Extra-SCN areas in split hamsters are characterized by a bimodal 12-h rhythm on each side of the brain. Right column: the cosinor fits are normalized to constant amplitude and are plotted together. The white and hatched bar at the bottom indicates subjective day and night. The vertical gray bar highlights the concordance of the falling phase of the SCN shell, low expression in the core and the rising phase of the SCN target areas in all three conditions.
Table 1.
Sample sizes, R2-values and P-values for cosinor fits incorporating both 24-h and 12-h components, or 24-h and 12-h components independently
| Model
|
|||||
|---|---|---|---|---|---|
| 24 h + 12 h | 24 h | 12 h | |||
|
|
|||||
| Region | Group | n | R2 (P) | R2 (P) | R2 (P0 |
| SCN shell | LD | 32 | 0.81 (0.001) |
0.78 (0.001) |
0.02 (0.71) |
| LL unsplit | 32 | 0.83 (0.001) |
0.78 (0.001) |
0.03 (0.51) |
|
| Split | 48 | 0.54 (0.001) |
0.54 (0.001) |
0.00 (0.99) |
|
|
| |||||
| SCN core | LD | 31 | 0.36 (0.02) |
0.35 (0.003) |
0.02 (0.85) |
| LL unsplit | 33 | 0.64 (0.001) |
0.59 (0.001) |
0.15 (0.32) |
|
| Split | 50 | 0.55 (0.001) |
0.55 (0.001) |
0.01 (0.86) |
|
|
| |||||
| MPOA | LD | 32 | 0.61 (0.001) |
0.51 (0.001) |
0.10 (0.22) |
| LL unsplit | 36 | 0.38 (0.005) |
0.23 (0.02) |
0.17 (0.06) |
|
| Split | 48 | 0.37 (0.001) | 0.002 (0.65) |
0.36 (0.001) |
|
|
| |||||
| PVN | LD | 32 | 0.57 (0.001) |
0.48 (0.001) |
0.09 (0.28) |
| LL unsplit | 36 | 0.39 (0.004) |
0.25 (0.02) |
0.17 (0.07) |
|
| Split | 52 | 0.27 (0.005) | 0.05 (0.22) |
0.22 (0.003) |
|
|
| |||||
| DMH | LD | 32 | 0.64 (0.001) |
0.56 (0.001) |
0.09 (0.28) |
| LL unsplit | 36 | 0.46 (0.001) |
0.40 (0.001) |
0.09 (0.35) |
|
| Split | 48 | 0.29 (0.005) | 0.01 (0.54) |
0.27 (0.001) |
|
Significant fits (P < 0.05) are shown in bold; trends (0.05 < P < 0.1) are shown in italics.
Importantly, there was a consistent relationship between the phases of the SCN and extra-SCN areas, seen when the cosinor curves were normalized to a constant amplitude (Fig. 5, column 4). Specifically, in the PVN, MPOA and DMH in all three experimental groups, the rise times from trough to peak occurred just after FOS expression peaked in the shell SCN and had reached a trough in the core. Representative photomicrographs show trough and peak FOS expression in the MPOA, PVN, and DMH (Fig. S1).
Comparison of LD and LL unsplit hamsters indicates that LL blunted the amplitude of the FOS expression rhythm as compared with LD in the SCN shell, but induced a previously unseen rhythm of high FOS amplitude in the core (effect of light in shell, F1,48 = 4.2, P < 0.05; effect of light in core, F1,49 = 18.7, P < 0.001). As with the shell, rhythm amplitude was reduced in the MPOA and PVN, but not in the DMH (effect of light in: MPOA, F1,52 = 8.2, P < 0.01; PVN, F1,52 = 4.4, P < 0.05; DMH, F1,52 = 2.3, P > 0.05).
Rhythms of FOS/ORX coexpression
To determine rhythmicity in a peptidergic neuronal population directly innervated by the SCN, FOS expression was examined in ORX neurons (Abrahamson et al., 2001). Photomicrographs show low FOS/ORX colocalization during the day and high colocalization at night in LD hamsters (Fig. 6A). In these hamsters, left–right differences were absent (Fig. 6C), but there was a high-amplitude 24-h rhythm (Fig. 6E: time, F7,8 = 4.6, P < 0.05; side, F1,8 = 3.3, P = 0.1; interaction, F7,8 = 1.1, P = 0.5). In LL split hamsters, photomicrographs show bilaterally symmetric FOS/ORX colocalization at peak times and little colocalization at trough times (Fig. 6B). As in LD hamsters, coexpression was bilaterally symmetric in LL split hamsters (Fig. 6D), but exhibited a 12-h rhythm with two peaks per day at CT3 and CT15 (Fig. 6F: time, F3,8 = 9.5, P < 0.01; side, F1,8 = 0.7, P = 0.4; interaction, F3,8 = 0.3, P = 0.8). There was no circadian variation in the number of ORX neurons in either group (Fig. 6E and F: P > 0.5).
Fig. 6.

FOS/ORX colocalization. (A) Representative photomicrographs of nuclear FOS expression (green) in ORX neurons (red) on the left and right sides of the branis of LD hamsters killed at ZT9 (top panels, trough) or ZT15 (bottom panels, peak). Times are indicated in each panel. Scale bar: 100 μm. High-magnification insets of the boxed areas show the FOS (f), ORX (o) and merged (m) signals. Scale bar: 20 μm. (B) Photomicrographs showing trough FOS/ORX expression in a split hamster in which the left and right sides of the brain correspond to CT9 and CT21 (top), and peak expression bilaterally in a split hamster in which the left and right sides of the brain correspond to CT3 and CT15 (bottom). (C and D) FOS/ORX coexpression in unsplit (C) and split (D) hamsters was bilaterally symmetric and did not deviate significantly from 50% [gray shading shows standard error (SE), as in Fig. 4]. (E and F) Mean (± SE) number of cells expressing ORX (open circles) and, of those, the number coexpressing FOS (closed circles).
Discussion
The comparison of oscillation in the left and right monosynaptic efferent targets of the SCN revealed several novel aspects of SCN signaling. First, in LL split animals, the target brain regions studied each have 12-h rhythms of oscillation in-phase between left and right, whereas the sides of the SCN maintain a 24-h rhythm in antiphase between left and right. Second, there is a detectable right–left difference in extra-SCN regions, with higher-amplitude FOS expression on the side where the SCN is in subjective night. Third, in all experimental groups, whether split or unsplit, LD-housed or LL-housed, the phase of increasing FOS expression in target areas coincided with decreasing SCN shell activity and low core activity corresponding to the day–night transition. This phase-locking points to a time at which the SCN signals these targets. Finally, the behavioral data indicate that hamsters that split had a longer free-running period than those that did not, and the amount and duration of activity were inversely correlated with the latency to split. Taken together, the data allow for several SCN-to-target phase-setting pathways, and suggest that particular behavioral phenotypes are associated with the tendency of hamsters to split.
Bilateral 12-h rhythms in SCN targets
FOS is a good marker for temporal variation in neural activity in circadian studies because of its autoinhibition and short expression time (Cullinan et al., 1995; Kovacs, 2008). The frequent sampling used here allowed us to resolve ultradian periodicity in extra-SCN targets. Split hamsters exhibited 12-h rhythms of FOS expression in all brain regions examined, as well as in a peptidergically identified SCN target, the ORX neurons (Abrahamson et al., 2001). Thus, whereas each SCN has a 24-h rhythm, its direct targets have 12-h rhythms, indicating that target regions receive input from both the ipsilateral and contralateral sides of the SCN.
In unsplit hamsters, the 24-h rhythm of FOS/ORX colocalization matches previous data in rats housed in light–dark cycles and DD (Estabrooke et al., 2001). In contrast, in split hamsters, 12-h rhythms of FOS expression in ORX neurons were observed, showing a concordance between neural and behavioral correlates of arousal. In split hamsters, ORX neurons may play a role in transducing 24-h SCN rhythms to 12-h rhythmic outputs on each side of the brain, as orexins promote waking, arousal, and energy utilization (Saper et al., 2005). Additionally, ORX neurons project to the SCN, and may contribute to conveying behavioral/arousal feedback to the SCN (Date et al., 1999).
Twenty-four-hour rhythms in the SCN core
We observed a high-amplitude rhythm of FOS expression in the SCN core of hamsters in LL. The pattern of FOS expression during subjective night is qualitatively similar to that after an acute light pulse, but may occur in different cells. In LL, FOS is not expressed in calbindin cells (Tavakoli-Nezhad & Schwartz, 2005), whereas, after a light pulse, FOS is colocalized with calbindin (Silver et al., 1996b). Furthermore, in LL, FOS expression in the core is not always accompanied by PER1 expression, as would be predicted from exposure to light pulses. Here, we observed FOS rhythms in the SCN core regardless of splitting, whereas PER1 is expressed in the SCN core of LL-housed hamsters that are split, but not in those that are unsplit (Yan et al., 2005). Light can also induce FOS expression without PER1 expression in ultradian light–dark/light–dark cycles (Yan et al., 2010).
Laterality of expression
Lateralized expression of FOS in split hamsters was observed in all brain regions (although often of low amplitude), suggesting weak lateralized input from the split SCN, as observed in some peripheral tissues (Mahoney et al., 2010). In previous experiments on target laterality, split female hamsters were tested at one time point corresponding to ovulation time. In that paradigm, FOS expression was lateralized in gonadotropin-releasing hormone cells in the POA (de la Iglesia et al., 2003) and gonadotropin-inhibiting hormone cells in the DMH (Gibson et al., 2008). In contrast, we did not detect significant right–left differences in FOS/ORX expression at any of the time points studied. Perhaps various peptidergic cell groups exhibit different phase and period relationships to the SCN, based on their unique inputs, even when they share direct innervation from the SCN.
Timing of an SCN output signal
The mechanism by which clocks are synchronized remains an outstanding question in chronobiology, with major health implications (Wulff et al., 2010). The SCN and numerous extra-SCN areas are rhythmic (Yamazaki et al., 1998; Abe et al., 2002). The SCN may communicate with these via both neural and diffusible outputs (Silver et al., 1996a; Meyer-Bernstein et al., 1999). Both relative phase and period inform our understanding of when and how the SCN may signal its targets.
Anatomically, SCN outputs are well described (Watts & Swanson, 1987; Watts et al., 1987; Leak et al., 1999; Kriegsfeld et al., 2004), but these give no indication of when these pathways may be activated. We and others have shown variation in phase of oscillator oscillation among neurons of the SCN, suggesting the possibility of multiple, temporally spaced outputs to the brain and body (Quintero et al., 2003; Yamaguchi et al., 2003; Kalsbeek et al., 2006; Yan & Silver, 2008; Butler & Silver, 2009; Schwartz et al., 2009; Evans et al., 2011; Foley et al., 2011). Thus, it was surprising to find that phase-locking between the SCN and its targets was consistent, and independent of photic and splitting condition. At the transition from subjective day to night, there is a concordance between the falling phase of SCN shell FOS expression, low core expression, and the rising phase of expression in target areas (Fig. 7). These temporal relationships suggest that the targets that we examined receive a signal at day’s end. The nature of such a cue remains elusive, but most SCN neurons contain GABA, suggesting that SCN output to its targets is primarily inhibitory (Moore & Speh, 1993). One possibility is the day–night shift in the relative strengths of glutamatergic and GABAergic outputs to targets (Sun et al., 2001; Perreau-Lenz et al., 2003; Kalsbeek et al., 2008).
Fig. 7.
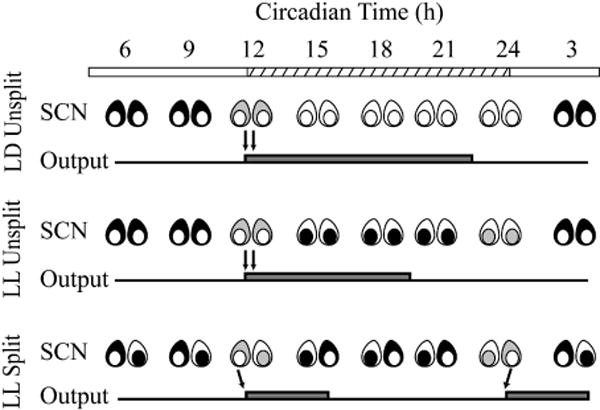
Schematic showing a common pattern of SCN shell and core activity in LD and LL unsplit and split hamsters, coinciding with the start of activity – measured either by wheel-running or by FOS expression in SCN targets (black, high activity; gray, decreasing activity; white, low activity). Note that, in all groups, the change occurs at the day to night (or subjective day to night) transition, as shown by the arrows.
SCN outputs are both neural and diffusible (Stephan et al., 1981; Silver et al., 1996a; Meyer-Bernstein et al., 1999; Kriegsfeld et al., 2004). If diffusible SCN signals reach ipsilateral and contralateral targets, this could account for the bilateral 12-h rhythms observed here. Nevertheless, diffusible factors do not restore all circadian rhythms (e.g. Meyer-Bernstein et al., 1999), and because of source–target distance, diffusible factors are more likely to act on more immediate targets (LeSauter et al., 1997). Neural SCN outputs are predominantly ipsilateral, but contralateral fibers are also observed (Kriegsfeld et al., 2004).
The juxtaposition of lateralized 24-h SCN clocks with bilateral 12-h rhythms in targets suggests several possible entrainment pathways. First, each side of the SCN may signal both contralateral and ipsilateral targets once per day, either directly (Watts & Swanson, 1987; Morin et al., 1994; Kriegsfeld et al., 2004) or indirectly via the reciprocal innervation between the left and right SCN (Pickard, 1982; Buijs et al., 1994; Leak et al., 1999), PVN (Sawchenko & Swanson, 1983), and DMH (ter Horst & Luiten, 1986; Thompson et al., 1996). Reciprocal innervation of the left and right MPOA has not been observed (Conrad & Pfaff, 1976; Simerly & Swanson, 1988). Second, each side of the SCN may signal its ipsilateral targets twice per day, once from the shell and once from the core. Bilateral 12-h rhythms in SCN electrical activity have been recorded in split animals (Siberian hamsters) (Zlomanczuk et al., 1991). Such data imply that each side of the SCN might be able to support 12-h rhythms, but studies of unilateral SCN lesions testing this possibility have shown inconsistent results (Pickard & Turek, 1982; 1983; Davis & Gorski, 1984). Third, 12-h rhythms may be entrained by the animal’s physiology and/or behavior. Split hamsters exhibit 12-h rhythms in activity, feeding, ORX neural activity, and glucocorticoid secretion, each of which may provide feedback to the brain (Gooley et al., 2006; Segall et al., 2009; Lilley et al., 2011; Mistlberger & Antle, 2011). The foregoing mechanisms are not mutually exclusive, and each may contribute to normal physiology.
Two other animal models manifest 12-h rhythms in brain and behavior, but without left–right phase differences: CS mice that split in constant darkness, and Syrian hamsters that split in short light–dark/light–dark cycles (7 h of light and 5 h of dark) (Abe et al., 2001; Watanabe et al., 2003; Yan et al., 2010). Therefore, 12-h rhythms in extra-SCN targets may be a common configuration in animals with two activity bouts, independently of how the SCN oscillators are configured.
Behavior and arousal correlates of splitting
We confirmed that hamsters that split have longer free-running periods than those that do not (Pickard et al., 1993), and we also observed that the latency to split is inversely correlated with the amount and duration of activity. These results suggest that endogenous rhythm patterns may predispose hamsters to rhythm splitting. In support of this, wheel-running and vigilance state modulate SCN electrical activity in rats and monkeys in vivo (Yamazaki et al., 1998; Schaap & Meijer, 2001; Deboer et al., 2003). A role for peripheral feedback, modeled as ‘fatigue’, has been predicted to contribute to splitting in quantitative models of SCN function (Carpenter & Grossberg, 1985; Indic et al., 2008). The gated dipole model developed by Carpenter and Grossberg (1985) includes two functionally discrete components that differ in their response to light (on-cells and off-cells) that are conceptually similar to the light-sensitive and light-insensitive neurons of the SCN (Karatsoreos et al., 2004). Extending this model to multiple oscillators may help to predict interactions among the SCN and its targets.
Conclusion
The present study reveals 12-h rhythms in the brains of split animals, and suggests several different within-brain entrainment pathways. The correlations between activity and splitting latency suggest that activity may alter intra-SCN oscillator coupling and contribute to the plastic reorganization of oscillators in LL. We found phase-locking between the SCN and all target regions examined in both split and unsplit conditions, and in LL-housed and LD-housed animals. This consistent phase-locking of the SCN and the targets that we examined suggests a discrete temporal window for SCN output to these regions.
Supplementary Material
Representative photomicrographs of the MPOA, PVN, and DMH showing peak and trough FOS expression in LD unsplit and LL split hamsters.
Acknowledgments
We thank Drs Lily Yan and Joseph LeSauter for their advice on the development of these experiments, Dr Nico Foley for helpful discussions regarding quantitative models of splitting, Dr Lance Kriegsfeld for suggestions on preparation of the manuscript, and the comments of anonymous reviewers. This work was supported by grants MH075045 (to R. Silver) and T32DK07328 (to M. P. Butler).
Abbreviations
- AVP
arginine vasopressin
- CT
circadian time
- DAB
diaminobenzidene
- DMH
dorsomedial hypothalamus
- LD
12-h: 12-h light–dark cycle
- LL
constant light
- MPOA
medial preoptic area
- ORX
orexin-A
- PB
phosphate buffer
- PER1
PERIOD1
- PVN
paraventricular nucleus of the hypothalamus
- SCN
suprachiasmatic nucleus
- ZT
zeitgeber time
References
- Abe H, Honma S, Namihira M, Masubuchi S, Honma K. Behavioural rhythm splitting in the CS mouse is related to clock gene expression outside the suprachiasmatic nucleus. Eur J Neurosci. 2001;14:1121–1128. doi: 10.1046/j.0953-816x.2001.01732.x. [DOI] [PubMed] [Google Scholar]
- Abe M, Herzog ED, Yamazaki S, Straume M, Tei H, Sakaki Y, Menaker M, Block GD. Circadian rhythms in isolated brain regions. J Neurosci. 2002;22:350–356. doi: 10.1523/JNEUROSCI.22-01-00350.2002. [DOI] [PMC free article] [PubMed] [Google Scholar]
- Abrahamson EE, Leak RK, Moore RY. The suprachiasmatic nucleus projects to posterior hypothalamic arousal systems. Neuroreport. 2001;12:435–440. doi: 10.1097/00001756-200102120-00048. [DOI] [PubMed] [Google Scholar]
- Buijs RM, Hou YX, Shinn S, Renaud LP. Ultrastructural evidence for intra- and extranuclear projections of GABAergic neurons of the suprachiasmatic nucleus. J Comp Neurol. 1994;340:381–391. doi: 10.1002/cne.903400308. [DOI] [PubMed] [Google Scholar]
- Butler MP, Paul MJ, Turner KW, Park JH, Driscoll JR, Kriegsfeld LJ, Zucker I. Circadian rhythms of photorefractory Siberian hamsters remain responsive to melatonin. J Biol Rhythms. 2008;23:160–169. doi: 10.1177/0748730407312949. [DOI] [PMC free article] [PubMed] [Google Scholar]
- Butler MP, Silver R. Basis of robustness and resilience in the suprachiasmatic nucleus: individual neurons form nodes in circuits that cycle daily. J Biol Rhythms. 2009;24:340–352. doi: 10.1177/0748730409344800. [DOI] [PMC free article] [PubMed] [Google Scholar]
- Carpenter GA, Grossberg S. A neural theory of circadian rhythms: split rhythms, after-effects and motivational interactions. J Theor Biol. 1985;113:163–223. doi: 10.1016/s0022-5193(85)80083-7. [DOI] [PubMed] [Google Scholar]
- Christian CA, Mobley JL, Moenter SM. Diurnal and estradiol-dependent changes in gonadotropin-releasing hormone neuron firing activity. Proc Natl Acad Sci USA. 2005;102:15682–15687. doi: 10.1073/pnas.0504270102. [DOI] [PMC free article] [PubMed] [Google Scholar]
- Conrad LC, Pfaff DW. Efferents from medial basal forebrain and hypothalamus in the rat. I An autoradiographic study of the medial preoptic area. J Comp Neurol. 1976;169:185–219. doi: 10.1002/cne.901690205. [DOI] [PubMed] [Google Scholar]
- Cullinan WE, Herman JP, Battaglia DF, Akil H, Watson SJ. Pattern and time course of immediate early gene expression in rat brain following acute stress. Neuroscience. 1995;64:477–505. doi: 10.1016/0306-4522(94)00355-9. [DOI] [PubMed] [Google Scholar]
- Date Y, Ueta Y, Yamashita H, Yamaguchi H, Matsukura S, Kangawa K, Sakurai T, Yanagisawa M, Nakazato M. Orexins, orexigenic hypothalamic peptides, interact with autonomic, neuroendocrine and neuroregulatory systems. Proc Natl Acad Sci USA. 1999;96:748–753. doi: 10.1073/pnas.96.2.748. [DOI] [PMC free article] [PubMed] [Google Scholar]
- Davis FC, Gorski RA. Unilateral lesions of the hamster suprachiasmatic nuclei – evidence for redundant control of circadian-rhythms. J Comp Physiol. 1984;154:221–232. [Google Scholar]
- de la Iglesia HO, Meyer J, Carpino A, Jr, Schwartz WJ. Antiphase oscillation of the left and right suprachiasmatic nuclei. Science. 2000;290:799–801. doi: 10.1126/science.290.5492.799. [DOI] [PubMed] [Google Scholar]
- de la Iglesia HO, Meyer J, Schwartz WJ. Lateralization of circadian pacemaker output: activation of left- and right-sided luteinizing hormone-releasing hormone neurons involves a neural rather than a humoral pathway. J Neurosci. 2003;23:7412–7414. doi: 10.1523/JNEUROSCI.23-19-07412.2003. [DOI] [PMC free article] [PubMed] [Google Scholar]
- Deboer T, Vansteensel MJ, Detari L, Meijer JH. Sleep states alter activity of suprachiasmatic nucleus neurons. Nat Neurosci. 2003;6:1086–1090. doi: 10.1038/nn1122. [DOI] [PubMed] [Google Scholar]
- Dibner C, Schibler U, Albrecht U. The mammalian circadian timing system: organization and coordination of central and peripheral clocks. Annu Rev Physiol. 2010;72:517–549. doi: 10.1146/annurev-physiol-021909-135821. [DOI] [PubMed] [Google Scholar]
- Estabrooke IV, McCarthy MT, Ko E, Chou TC, Chemelli RM, Yanagisawa M, Saper CB, Scammell TE. Fos expression in orexin neurons varies with behavioral state. J Neurosci. 2001;21:1656–1662. doi: 10.1523/JNEUROSCI.21-05-01656.2001. [DOI] [PMC free article] [PubMed] [Google Scholar]
- Evans JA, Leise TL, Castanon-Cervantes O, Davidson AJ. Intrinsic regulation of spatiotemporal organization within the suprachiasmatic nucleus. PLoS One. 2011;6:e15869. doi: 10.1371/journal.pone.0015869. [DOI] [PMC free article] [PubMed] [Google Scholar]
- Foley NC, Tong TY, Foley D, Lesauter J, Welsh DK, Silver R. Characterization of orderly spatiotemporal patterns of clock gene activation in mammalian suprachiasmatic nucleus. Eur J Neurosci. 2011;33:1851–1865. doi: 10.1111/j.1460-9568.2011.07682.x. [DOI] [PMC free article] [PubMed] [Google Scholar]
- Gibson EM, Humber SA, Jain S, Williams WP, 3rd, Zhao S, Bentley GE, Tsutsui K, Kriegsfeld LJ. Alterations in RFamide-related peptide expression are coordinated with the preovulatory luteinizing hormone surge. Endocrinology. 2008;149:4958–4969. doi: 10.1210/en.2008-0316. [DOI] [PMC free article] [PubMed] [Google Scholar]
- Girotti M, Weinberg MS, Spencer RL. Diurnal expression of functional and clock-related genes throughout the rat HPA axis: system-wide shifts in response to a restricted feeding schedule. Am J Physiol. 2009;296:E888–897. doi: 10.1152/ajpendo.90946.2008. [DOI] [PMC free article] [PubMed] [Google Scholar]
- Gooley JJ, Schomer A, Saper CB. The dorsomedial hypothalamic nucleus is critical for the expression of food-entrainable circadian rhythms. Nat Neurosci. 2006;9:398–407. doi: 10.1038/nn1651. [DOI] [PubMed] [Google Scholar]
- Guilding C, Hughes AT, Brown TM, Namvar S, Piggins HD. A riot of rhythms: neuronal and glial circadian oscillators in the mediobasal hypothalamus. Mol Brain. 2009;2:28. doi: 10.1186/1756-6606-2-28. [DOI] [PMC free article] [PubMed] [Google Scholar]
- Indic P, Schwartz WJ, Paydarfar D. Design principles for phase-splitting behaviour of coupled cellular oscillators: clues from hamsters with ‘split’ circadian rhythms. J R Soc Interface. 2008;5:873–883. doi: 10.1098/rsif.2007.1248. [DOI] [PMC free article] [PubMed] [Google Scholar]
- Kalsbeek A, Foppen E, Schalij I, Van Heijningen C, van der Vliet J, Fliers E, Buijs RM. Circadian control of the daily plasma glucose rhythm: an interplay of GABA and glutamate. PLoS One. 2008;3:e3194. doi: 10.1371/journal.pone.0003194. [DOI] [PMC free article] [PubMed] [Google Scholar]
- Kalsbeek A, Perreau-Lenz S, Buijs RM. A network of (autonomic) clock outputs. Chronobiol Int. 2006;23:521–535. doi: 10.1080/07420520600651073. [DOI] [PubMed] [Google Scholar]
- Kalsbeek A, Teclemariam-Mesbah R, Pevet P. Efferent projections of the suprachiasmatic nucleus in the golden hamster (Mesocricetus auratus) J Comp Neurol. 1993;332:293–314. doi: 10.1002/cne.903320304. [DOI] [PubMed] [Google Scholar]
- Karatsoreos IN, Yan L, LeSauter J, Silver R. Phenotype matters: identification of light-responsive cells in the mouse suprachiasmatic nucleus. J Neurosci. 2004;24:68–75. doi: 10.1523/JNEUROSCI.1666-03.2004. [DOI] [PMC free article] [PubMed] [Google Scholar]
- Kovacs KJ. Measurement of immediate-early gene activation – c-fos and beyond. J Neuroendocrinol. 2008;20:665–672. doi: 10.1111/j.1365-2826.2008.01734.x. [DOI] [PubMed] [Google Scholar]
- Kriegsfeld LJ, Leak RK, Yackulic CB, LeSauter J, Silver R. Organization of suprachiasmatic nucleus projections in Syrian hamsters (Mesocricetus auratus): an anterograde and retrograde analysis. J Comp Neurol. 2004;468:361–379. doi: 10.1002/cne.10995. [DOI] [PMC free article] [PubMed] [Google Scholar]
- Larkin JE, Jones J, Zucker I. Temperature dependence of gonadal regression in Syrian hamsters exposed to short day lengths. Am J Physiol. 2002;282:R744–752. doi: 10.1152/ajpregu.00299.2001. [DOI] [PubMed] [Google Scholar]
- Leak RK, Card JP, Moore RY. Suprachiasmatic pacemaker organization analyzed by viral transynaptic transport. Brain Res. 1999;819:23–32. doi: 10.1016/s0006-8993(98)01317-1. [DOI] [PubMed] [Google Scholar]
- LeSauter J, Romero P, Cascio M, Silver R. Attachment site of grafted SCN influences precision of restored circadian rhythm. J Biol Rhythms. 1997;12:327–338. doi: 10.1177/074873049701200405. [DOI] [PubMed] [Google Scholar]
- Lilley TR, Wotus C, Taylor D, Lee JM, de la Iglesia HO. Circadian regulation of cortisol release in behaviorally split golden hamsters. Endocrinology. 2011 doi: 10.1210/en.2011-1624. [DOI] [PMC free article] [PubMed] [Google Scholar]
- Mahoney CE, Brewer D, Costello MK, Brewer JM, Bittman EL. Lateralization of the central circadian pacemaker output: a test of neural control of peripheral oscillator phase. Am J Physiol Regul Integr Comp Physiol. 2010;299:R751–761. doi: 10.1152/ajpregu.00746.2009. [DOI] [PMC free article] [PubMed] [Google Scholar]
- Meyer-Bernstein EL, Jetton AE, Matsumoto SI, Markuns JF, Lehman MN, Bittman EL. Effects of suprachiasmatic transplants on circadian rhythms of neuroendocrine function in golden hamsters. Endocrinology. 1999;140:207–218. doi: 10.1210/endo.140.1.6428. [DOI] [PubMed] [Google Scholar]
- Mistlberger RE, Antle MC. Entrainment of circadian clocks in mammals by arousal and food. Essays Biochem. 2011;49:119–136. doi: 10.1042/bse0490119. [DOI] [PubMed] [Google Scholar]
- Mochizuki T, Crocker A, McCormack S, Yanagisawa M, Sakurai T, Scammell TE. Behavioral state instability in orexin knock-out mice. J Neurosci. 2004;24:6291–6300. doi: 10.1523/JNEUROSCI.0586-04.2004. [DOI] [PMC free article] [PubMed] [Google Scholar]
- Moore RY, Speh JC. GABA is the principal neurotransmitter of the circadian system. Neurosci Lett. 1993;150:112–116. doi: 10.1016/0304-3940(93)90120-a. [DOI] [PubMed] [Google Scholar]
- Morin LP, Goodless-Sanchez N, Smale L, Moore RY. Projections of the suprachiasmatic nuclei, subparaventricular zone and retrochiasmatic area in the golden hamster. Neuroscience. 1994;61:391–410. doi: 10.1016/0306-4522(94)90240-2. [DOI] [PubMed] [Google Scholar]
- Morin LP, Wood RI. A Stereotaxic Atlas of the Golden Hamster Brain. Academic Press; San Diego: 2001. [Google Scholar]
- Nelson W, Tong YL, Lee JK, Halberg F. Methods for cosinor-rhythmometry. Chronobiologia. 1979;6:305–323. [PubMed] [Google Scholar]
- Ohta H, Yamazaki S, McMahon DG. Constant light desynchronizes mammalian clock neurons. Nat Neurosci. 2005;8:267–269. doi: 10.1038/nn1395. [DOI] [PubMed] [Google Scholar]
- Perreau-Lenz S, Kalsbeek A, Garidou ML, Wortel J, van der Vliet J, van Heijningen C, Simonneaux V, Pevet P, Buijs RM. Suprachiasmatic control of melatonin synthesis in rats: inhibitory and stimulatory mechanisms. Eur J Neurosci. 2003;17:221–228. doi: 10.1046/j.1460-9568.2003.02442.x. [DOI] [PubMed] [Google Scholar]
- Pickard GE. The afferent connections of the suprachiasmatic nucleus of the golden hamster with emphasis on the retinohypothalamic projection. J Comp Neurol. 1982;211:65–83. doi: 10.1002/cne.902110107. [DOI] [PubMed] [Google Scholar]
- Pickard GE, Kahn R, Silver R. Splitting of the circadian rhythm of body temperature in the golden hamster. Physiol Behav. 1984;32:763–766. doi: 10.1016/0031-9384(84)90191-4. [DOI] [PubMed] [Google Scholar]
- Pickard GE, Turek FW. Splitting of the circadian rhythm of activity is abolished by unilateral lesions of the suprachiasmatic nuclei. Science. 1982;215:1119–1121. doi: 10.1126/science.7063843. [DOI] [PubMed] [Google Scholar]
- Pickard GE, Turek FW. The suprachiasmatic nuclei: two circadian clocks? Brain Res. 1983;268:201–210. doi: 10.1016/0006-8993(83)90486-9. [DOI] [PubMed] [Google Scholar]
- Pickard GE, Turek FW, Sollars PJ. Light intensity and splitting in the golden hamster. Physiol Behav. 1993;54:1–5. doi: 10.1016/0031-9384(93)90035-e. [DOI] [PubMed] [Google Scholar]
- Pittendrigh CS, Daan S. A functional analysis of circadian pacemakers in nocturnal rodents. V Pacemaker structure: a clock for all seasons. J Comp Physiol [A] 1976;106:333–355. [Google Scholar]
- Quintero JE, Kuhlman SJ, McMahon DG. The biological clock nucleus: a multiphasic oscillator network regulated by light. J Neurosci. 2003;23:8070–8076. doi: 10.1523/JNEUROSCI.23-22-08070.2003. [DOI] [PMC free article] [PubMed] [Google Scholar]
- Saper CB, Scammell TE, Lu J. Hypothalamic regulation of sleep and circadian rhythms. Nature. 2005;437:1257–1263. doi: 10.1038/nature04284. [DOI] [PubMed] [Google Scholar]
- Sawchenko PE, Swanson LW. The organization of forebrain afferents to the paraventricular and supraoptic nuclei of the rat. J Comp Neurol. 1983;218:121–144. doi: 10.1002/cne.902180202. [DOI] [PubMed] [Google Scholar]
- Schaap J, Meijer JH. Opposing effects of behavioural activity and light on neurons of the suprachiasmatic nucleus. Eur J Neurosci. 2001;13:1955–1962. doi: 10.1046/j.0953-816x.2001.01561.x. [DOI] [PubMed] [Google Scholar]
- Schwartz MD, Wotus C, Liu T, Friesen WO, Borjigin J, Oda GA, de la Iglesia HO. Dissociation of circadian and light inhibition of melatonin release through forced desynchronization in the rat. Proc Natl Acad Sci USA. 2009;106:17540–17545. doi: 10.1073/pnas.0906382106. [DOI] [PMC free article] [PubMed] [Google Scholar]
- Segall LA, Milet A, Tronche F, Amir S. Brain glucocorticoid receptors are necessary for the rhythmic expression of the clock protein, PERIOD2, in the central extended amygdala in mice. Neurosci Lett. 2009;457:58–60. doi: 10.1016/j.neulet.2009.03.083. [DOI] [PubMed] [Google Scholar]
- Silver R, LeSauter J, Tresco PA, Lehman MN. A diffusible coupling signal from the transplanted suprachiasmatic nucleus controlling circadian locomotor rhythms. Nature. 1996a;382:810–813. doi: 10.1038/382810a0. [DOI] [PubMed] [Google Scholar]
- Silver R, Romero MT, Besmer HR, Leak R, Nunez JM, LeSauter J. Calbindin-D28K cells in the hamster SCN express light-induced Fos. Neuroreport. 1996b;7:1224–1228. doi: 10.1097/00001756-199604260-00026. [DOI] [PubMed] [Google Scholar]
- Simerly RB, Swanson LW. Projections of the medial preoptic nucleus: a Phaseolus vulgaris leucoagglutinin anterograde tract-tracing study in the rat. J Comp Neurol. 1988;270:209–242. doi: 10.1002/cne.902700205. [DOI] [PubMed] [Google Scholar]
- Stephan FK, Berkley KJ, Moss RL. Efferent connections of the rat suprachiasmatic nucleus. Neuroscience. 1981;6:2625–2641. doi: 10.1016/0306-4522(81)90108-1. [DOI] [PubMed] [Google Scholar]
- Sun X, Whitefield S, Rusak B, Semba K. Electrophysiological analysis of suprachiasmatic nucleus projections to the ventrolateral preoptic area in the rat. Eur J Neurosci. 2001;14:1257–1274. doi: 10.1046/j.0953-816x.2001.0001755.x. [DOI] [PubMed] [Google Scholar]
- Swann JM, Turek FW. Multiple circadian oscillators regulate the timing of behavioral and endocrine rhythms in female golden hamsters. Science. 1985;228:898–900. doi: 10.1126/science.4001926. [DOI] [PubMed] [Google Scholar]
- Tavakoli-Nezhad M, Schwartz WJ. c-Fos expression in the brains of behaviorally ‘split’ hamsters in constant light: calling attention to a dorsolateral region of the suprachiasmatic nucleus and the medial division of the lateral habenula. J Biol Rhythms. 2005;20:419–429. doi: 10.1177/0748730405278443. [DOI] [PMC free article] [PubMed] [Google Scholar]
- ter Horst GJ, Luiten PG. The projections of the dorsomedial hypothalamic nucleus in the rat. Brain Res Bull. 1986;16:231–248. doi: 10.1016/0361-9230(86)90038-9. [DOI] [PubMed] [Google Scholar]
- Thompson RH, Canteras NS, Swanson LW. Organization of projections from the dorsomedial nucleus of the hypothalamus: a PHA-L study in the rat. J Comp Neurol. 1996;376:143–173. doi: 10.1002/(SICI)1096-9861(19961202)376:1<143::AID-CNE9>3.0.CO;2-3. [DOI] [PubMed] [Google Scholar]
- Watanabe T, Yoshimura T, McMahon DG, Ebihara S. Unimodal circadian rhythm in the suprachiasmatic nucleus of behaviorally splitting mice. Neurosci Lett. 2003;345:49–52. doi: 10.1016/s0304-3940(03)00484-1. [DOI] [PubMed] [Google Scholar]
- Watts AG, Swanson LW. Efferent projections of the suprachiasmatic nucleus: II. Studies using retrograde transport of fluorescent dyes and simultaneous peptide immunohistochemistry in the rat. J Comp Neurol. 1987;258:230–252. doi: 10.1002/cne.902580205. [DOI] [PubMed] [Google Scholar]
- Watts AG, Swanson LW, Sanchez-Watts G. Efferent projections of the suprachiasmatic nucleus: I. Studies using anterograde transport of Phaseolus vulgaris leucoagglutinin in the rat. J Comp Neurol. 1987;258:204–229. doi: 10.1002/cne.902580204. [DOI] [PubMed] [Google Scholar]
- Wulff K, Gatti S, Wettstein JG, Foster RG. Sleep and circadian rhythm disruption in psychiatric and neurodegenerative disease. Nat Rev Neurosci. 2010;11:589–599. doi: 10.1038/nrn2868. [DOI] [PubMed] [Google Scholar]
- Yamaguchi S, Isejima H, Matsuo T, Okura R, Yagita K, Kobayashi M, Okamura H. Synchronization of cellular clocks in the suprachiasmatic nucleus. Science. 2003;302:1408–1412. doi: 10.1126/science.1089287. [DOI] [PubMed] [Google Scholar]
- Yamazaki S, Kerbeshian MC, Hocker CG, Block GD, Menaker M. Rhythmic properties of the hamster suprachiasmatic nucleus in vivo. J Neurosci. 1998;18:10709–10723. doi: 10.1523/JNEUROSCI.18-24-10709.1998. [DOI] [PMC free article] [PubMed] [Google Scholar]
- Yan L, Foley NC, Bobula JM, Kriegsfeld LJ, Silver R. Two antiphase oscillations occur in each suprachiasmatic nucleus of behaviorally split hamsters. J Neurosci. 2005;25:9017–9026. doi: 10.1523/JNEUROSCI.2538-05.2005. [DOI] [PMC free article] [PubMed] [Google Scholar]
- Yan L, Silver R. Day-length encoding through tonic photic effects in the retinorecipient SCN region. Eur J Neurosci. 2008;28:2108–2115. doi: 10.1111/j.1460-9568.2008.06493.x. [DOI] [PMC free article] [PubMed] [Google Scholar]
- Yan L, Silver R, Gorman M. Reorganization of suprachiasmatic nucleus networks under 24-h LDLD conditions. J Biol Rhythms. 2010;25:19–27. doi: 10.1177/0748730409352054. [DOI] [PMC free article] [PubMed] [Google Scholar]
- Zlomanczuk P, Margraf RR, Lynch GR. In vitro electrical activity in the suprachiasmatic nucleus following splitting and masking of wheel-running behavior. Brain Res. 1991;559:94–99. doi: 10.1016/0006-8993(91)90291-3. [DOI] [PubMed] [Google Scholar]
Associated Data
This section collects any data citations, data availability statements, or supplementary materials included in this article.
Supplementary Materials
Representative photomicrographs of the MPOA, PVN, and DMH showing peak and trough FOS expression in LD unsplit and LL split hamsters.