

Abstract
The purpose of the present work was to investigate the effects of variable projection-view (PV) and angular dose (AD) distributions on the reconstructed image quality for improving microcalcification detection. The PV densities at central and peripheral sites were varied through the distribution of 21 PVs acquired over ±25° angular range. To vary the AD distribution, 7 PVs in the central region were targeted with two, four and six times the peripheral dose, and the number of central PVs receiving four times the peripheral dose was increased from 3 to 11. The contrast-to-noise ratio (CNR) for in-focus plane quality and the full width at half maximum (FWHM) of artifact spread function (ASF) for resolution in the z-direction were used. Although the ASF improved with increasing PV densities at two peripheral sites, the CNRs were inferior to those obtained with other subsets. With increasing PV density in the central area, the vertical resolution decreased but the CNR increased. Although increasing the central PV or AD concentrations improved image quality, excessive central densities reduced image quality by increasing noise in peripheral views.
Keywords: digital breast tomosynthesis, microcalcification, projection view distribution, angular dose distribution
INTRODUCTION
The conventional mammogram used in breast cancer screening and diagnosis [1] provides high sensitivity and specificity for the early detection of non-palpable lesions associated with breast cancer. Full field digital mammography (FFDM) may improve image quality through advances in flat panel detector technology and image processing techniques [2, 3]. New flat panel detectors offer extremely high quantum efficiency and high resolution. However, both film and screen mammography and FFDM provide only 2D imaging; and in the projection of 2D images from 3D anatomical structures, overlapping structures produce shadows and artifacts. This leads to a high false positive rate [4] and an excess of mammography recalls and biopsies, with non-trivial morbidity risks [5].
Digital breast tomosynthesis (DBT) is an emerging 3D imaging technique that may resolve some limitations of conventional mammography. In DBT, a form of limited-angle cone-beam computed tomography (CT) [6, 7], a restricted number of 2D projections are acquired within a limited angle. This is generally accomplished by moving the X-ray tube along an arc in the conventional mammography projection geometry. The 3D volume of the breast is reconstructed from 2D projections using various reconstruction algorithms. Since DBT is adapted for angular undersampling, insufficient for 3D reconstruction of the breast, efforts to optimize reconstruction methods, detector performance, acquisition geometry and acquisition parameters have multiplied. Wu et al. developed a parallel reconstruction method based on a maximum-likelihood expectation maximization (MLEM) iterative algorithm [8], and also compared reconstruction algorithms [9]. Bissonnette et al. described a prototype DBT system using an amorphous selenium (a-Se) flat-panel detector [10]. Zhao et al. studied the detector performance of an a-Se detector with a pixel size of 85 µm and found great potential for a-Se detectors in DBT systems [11]. The geometrical parameters of image acquisition in DBT, including the number of projection views (PVs) and the total angular range, are not accessible in conventional mammography, and therein resides the power of DBT. The work of Sechopoulos et al. shows that maximizing the total angular range increases the vertical resolution, and increasing the number of PVs improves the contrast-to-noise ratio (CNR) for soft tissue lesions; specifically, an acquisition set of 13 projections over a 60º angular range gave the best image quality [12]. Based on observer performance, Chawla et al. found that increasing the angular range and signal size increases the detection rate. In that experimental context, acquisition of 15–17 projections over a 45º angular dose (AD) range gave the best performance [13, 14]. These studies were based on the uniform distribution of both PV and AD. In this work, we investigated the effects of various PV and AD distributions on the quality of reconstructed images obtained using a constant total dose. To analyze the dependence of image quality on these factors, we used the CNR and the artifact spread function (ASF) to quantify the in-focus plane artifacts along the z-axis. To verify our results qualitatively, we imaged the commercial breast-mimicking phantom BR3D (Model 020; CIRS, USA). Findings from this study may be applied to optimize acquisition configuration parameters in a DBT system.
MATERIALS AND METHODS
Description of the prototype DBT system
A prototype DBT system for breast imaging research (Korea Electrotechnology Research Institute [KERI], Changwon, Republic of Korea) was used in this study. The system has a CsI(Tl) scintillator/CMOS flat panel digital detector (2923MAM, Dexela Ltd, UK) with a pixel size of 0.0748 × 0.0748 mm2 and raw image data consisted of 14 bits. The actual detector area is 291 × 230 mm2, resulting in a matrix size of 3072 × 3888. The system can interchangeably provide tungsten/rhodium (W/Rh) (XM1016T, IAE, Italy) and molybdenum/molybdenum (Mo/Mo) (M-113SP, Varian Medical Systems, USA) anode/filter combinations. Image data presented here were taken with the W/Rh combination. The system uses a step and shoot mode to acquire projection images and the digital detector is stationary during image acquisition. During a single acquisition, the system synchronizes multiple X-ray pulses generated from the high frequency generator (MXR35, DRGEM, Korea) with the detector read/integrate cycle and X-ray tube motion. The X-ray tube voltage setting ranges from 20–40 kVp and the tube current–exposure time product value ranges from 50–150 mAs. No antiscatter grid was used. The imaging geometry of this DBT system is illustrated in Fig. 1. During a typical DBT scan, the X-ray tube travels in an arc of ±25º about a center of rotation (COR) located 33 mm above the detector surface. The source-to-detector distance (SDD) is 665 mm and the source-to-COR distance is 632 mm. For the geometrical calibration, the system provides angular information for each projection. From these data, the focal position of each single view was determined under the assumption that the focal point moves in an arc around the COR in a plane that intersects the detector plane at the chest wall side. The appropriate accuracy of this geometric model was validated by imaging an acrylic phantom with embedded metal balls after precise measurements for the angle of the system components were taken with a high-precision inclinometer (T233, Sherborne Sensors Ltd, UK).
Fig. 1.
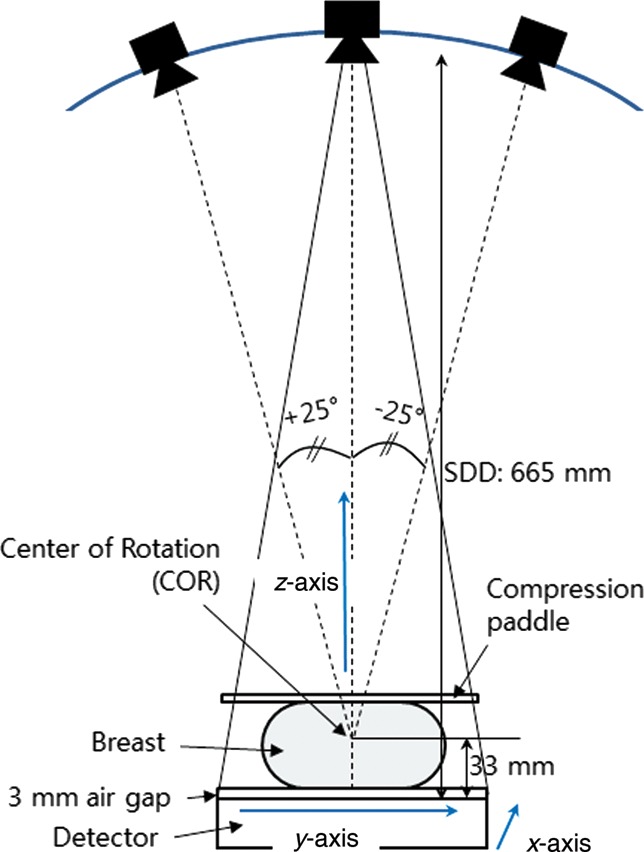
Schematic diagram showing the geometry of the prototype digital breast tomosynthesis (DBT) system: The z-axis extends outward, perpendicular to the chest, and the y-axis is the X-ray tube travel direction around the center of rotation (COR).
Image acquisition protocol
A tissue-equivalent phantom for mammography (Model 011A, CIRS, USA) was used for quantitative analysis, and a commercial breast-mimicking phantom (Model 020, CIRS, USA), designed to assess detectability of lesions of various sizes within a complex background that is generated by a heterogeneous tissue-equivalent material, was imaged to qualitatively verify our results. For each scan, the phantom images were acquired with an exposure technique of 30 kVp and the mAs values were adjusted until the intended mean glandular dose (MGD) to the phantom was achieved. The total MGD for all projection sets was estimated to be 2.0 mGy as a limiting factor. The MGDs were estimated using the method described by Sechopoulos et al. [15] as follows:
 |
(1) |
where Dg is the total MGD and X is the exposure measured at a specific point. At this specific point, the central ray meets the breast support plate. DgN0 is the normalized glandular dose for the zero degree projection, Nα is the number of PVs, and μRGD is the mean relative glandular dose (RGD) over all angles. The tables and equations for conversion from the entrance dose in the cranio–caudal (CC) view imaged with the tungsten target were used to compute the MGD [16].
Different PV distribution
To investigate the effects of variable PV distributions on reconstructed image quality, two general distributions were selected for a constant number of PVs acquired over ±25° angular range. All PV distributions were symmetric about the 0° PV, and the number of PVs in each distribution was chosen to be a constant of 21. In one distribution PVs were concentrated at the center of the scan (PVc), and in the other distribution PVs were concentrated at the peripheral sites (PVp). To evaluate the effect of the PVc, the number of PVs within ±7.5° angular range was increased from 11 to 17 PVs in increments of 2 PV, and the rest of the PVs, over ±7.5°– ± 25°, were adjusted for the same angular spacing. Images reconstructed from scans acquired with increasing the PVc (i.e. with 7, 11 and 15 PVs at ±1° angular spacing within ±7.5° angular range) were evaluated. The seven subsets of the PVc are shown schematically in Fig. 2. For PVp distributions, 6, 7, 8 and 9 of the 21 PVs were placed within an angular range of 7.5° at each of the two peripheral sites (i.e. between ±17.5° and ±25°). For analysis, scans with 4, 6 and 8 of 21 PVs at ±1° angular spacing in each peripheral site were acquired, and the remaining PVs were spaced uniformly across the distance between the two peripheral sites. The seven subsets of the PVp are shown schematically in Fig. 3. The same dose per projection was applied for all subsets and the MGD of each entire projection set was limited to 2.0 mGy.
Fig. 2.

Seven subsets of PV density distribution at the central imaging site (PVc): of the set of 21 PVs, (A) 11, (B) 13, (C) 15, and (D) 17 were taken over ±7.5° angular range, and the remaining PVs, taken from ±7.5° to ±25°, were adjusted to have uniform angular spacing. Of the 21 PVs, (E) 7, (F) 11, and (G) 15 were taken at ±1° angular spacing increments from zero degrees in the central site. The blue line represents the detector.
Fig. 3.

Seven subsets of PV density distribution at the peripheral imaging sites (PVp): in a set of 21 PVs, (A) 6, (B) 7, (C) 8, and (D) 9 were placed within the angular range of 7.5° at each peripheral site (i.e., from ±17.5° to ±25°). Of the 21 PVs, (E) 4, (F) 6, and (G) 8 were placed at ±1° angular spacing increments from the peripheral angular range limit (±25°), and the remaining PVs were adjusted to have uniform angular spacing across the angular range between the two peripheral sites.
Different AD distribution
To investigate the effects of AD distribution, 7 of the 21 PVs were placed at the center and targeted with four and six times the total peripheral dose (Table 1, No. 2, 3 and 4); and four times the total peripheral dose was delivered to 3, 7 and 11 of the 21 PVs placed at the center (Table 1, No. 5, 3 and 6). The AD distributions applied are shown in Table 1. All subsets presented in Table 1 were obtained with uniform PV distribution. Phantom imaging was repeated five times under the same imaging conditions. The same reconstruction method and detector were used for all imaging configurations.
Table 1.
Angular dose distributions among projection views in DBT of a breast phantom
| Image weights |
|||||||||
|---|---|---|---|---|---|---|---|---|---|
| No. | DBT acquisition configuration | 0 | ±2.5 | ±5.0 | ±7.5 | ··· | ±12.5 | ··· | ±25 |
| 1 | Uniform (reference) | 1 | 1 | 1 | 1 | ··· | 1 | ··· | 1 |
| 2 | 2 × peripheral dose to 7 central PVs | 2 | 2 | 2 | 2 | ··· | 0.5 | ··· | 0.5 |
| 3 | 4 × peripheral dose to 7 central PVs | 2.4 | 2.4 | 2.4 | 2.4 | ··· | 0.3 | ··· | 0.3 |
| 4 | 6 × peripheral dose to 7 central PVs | 2.57 | 2.57 | 2.57 | 2.57 | ··· | 0.21 | ··· | 0.21 |
| 5 | 4 × peripheral dose to 3 central PVs | 5.6 | 5.6 | 0.23 | 0.23 | ··· | 0.23 | ··· | 0.23 |
| 6 | 4 × peripheral dose to 11 central PVs | 1.53 | 1.53 | 1.53 | 1.53 | ··· | 1.53 | ··· | 0.42 |
All subsets were obtained with a uniform PV distribution. (There were 21 PVs over an angular range of ±25° with uniform ±2.5° angular spacing.)
Reconstruction algorithms and image analysis
Reconstruction is the process by which data from the acquired projection views are used to create a 3D image. The reconstruction algorithm is an important element for optimization of the system, as it contributes to determining the overall image quality as well as the mechanical, geometric and dosimetric parameters. For this work, we applied the separable paraboloidal surrogates (SPS) algorithm to optimize microcalcification detection. The SPS algorithm is based on a penalized maximum likelihood (PML) reconstruction. As suggested by Fessler [17, 18], the algorithm was adapted using a surrogate function. The reconstructed volume was 20 cm × 14 cm × 5 cm, i.e. slightly larger than the phantom volume, and the voxel size was 0.075 mm × 0.075 mm × 1 mm (i.e. slice thickness was 1 mm). To quantitatively evaluate the quality of the image reconstructed in a focal plane, the CNR for microcalcifications in the reconstructed breast volume was computed for all projection sets. The CNR value is defined by [19]:
 |
(2) |
where  and
and  are the mean pixel values of the signal region of interest (ROI) and background ROI at a depth z, and σBG is the standard deviation of the pixel values in the same background ROI. The signal ROI was defined as a 4 × 4-pixel area in the center of the microcalcifications, and the background ROI was a chosen 50 × 50-pixel area far from all features. Three speck groups, with nominal sizes of 0.400, 0.230 and 0.165 mm, were analyzed as microcalcifications in the reconstructed tissue-equivalent phantom images (Fig. 4). The CNRs were obtained by averaging six microcalcifications in the speck groups and three repeated measurements. The error bars indicate the standard deviation of the measurements. To measure the quality of the vertical resolution of the reconstructed images and the artifact effect of features in the adjacent off-focus planes, the ASF of the microcalcifications were calculated as defined by Wu et al. [6, 9]:
 |
(3) |
where z0 is the location of the in-focus plane of the feature and z is the location of the plane of interest. The full width at half maximum (FWHM) of the ASF was estimated from a polynomial function fitted to the ASF.
Fig. 4.
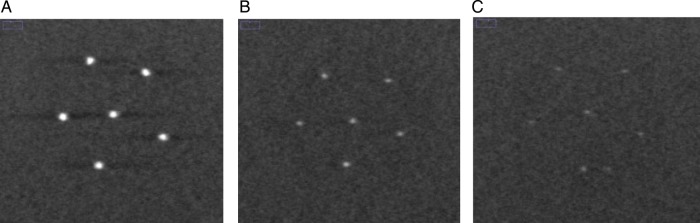
Reconstructed images of microcalcifications with nominal speck sizes of (A) 0.400, (B) 0.230, and (C) 0.165 mm in the tissue-equivalent phantom. The DBT slices were reconstructed from the reference scan that included 21 PVs acquired with uniform PV and AD distributions over ±25° angular range with ±2.5° angular spacing. Slices with objects in a focal plane are shown.
To optimize the configuration parameters, we employ the quality factor (QF) defined as [12]:
 |
(4) |
The QF combines the metrics for in-focus plane quality and for resolution in the z direction of the reconstructed images. The weights of these two metrics are equal in this computation of QF. Higher values of the QF correspond to configurations that deliver better image quality in terms of higher CNR and a lower FWHM of ASF. Thus the QF provides a criterion for selection among various sets of acquisition parameters.
RESULTS
Figure 5 shows mean FWHMs of the ASF and their polynomial fits for different PV distributions. Eight subsets of the different PV distributions were selected from Fig. 2A–D (PVc) and Fig. 3A–D (PVp). As a reference for comparison, a set of 21 PVs acquired over ±25° angular range with uniform PV and AD distributions was also analyzed. For the PVc, the FWHM increased as the number of PVs increased. For the PVp, the subset with extremely dense distributions only increased, while the other subsets showed little difference. However, all subsets with PVp yielded smaller FWHMs and thus had greater vertical resolution in the z-direction.
Fig. 5.
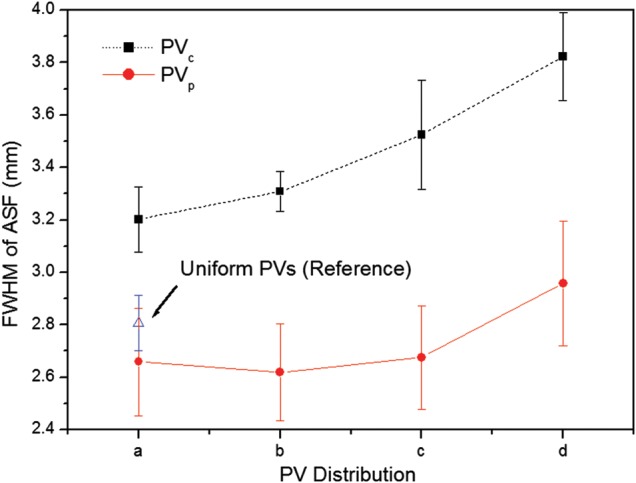
The FWHMs of ASFs in the z-axis averaged for six microcalcifications in the speck group of nominal size 0.400 mm. The eight subsets of parameters defining PV distributions were selected from (A), (B), (C), and (D) in Fig. 2 (PVc : dense PVs at central sites) and Fig. 3 (PVp : dense PVs at peripheral sites).
Figure 6 shows CNR results for microcalcifications in the speck group of nominal size 0.400 mm reconstructed from these eight subsets. All CNR results from the subsets with the PVp were inferior to those from the subsets with the PVc. The reference set yielded a slightly higher CNR than the subsets with the PVp.
Fig. 6.
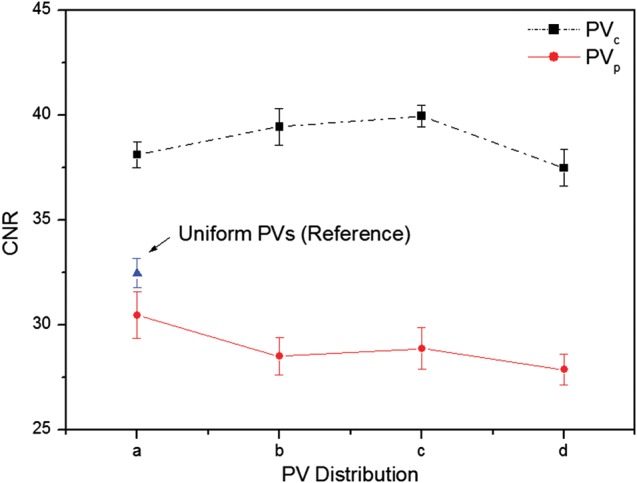
The CNRs for microcalcifications in the speck group of nominal size 0.400 mm. The eight subsets of parameters defining PV distributions were selected from (A), (B), (C), and (D) in Fig. 2 (PVc: dense PVs at central sites) and Fig. 3 (PVp: dense PVs at peripheral sites). The CNRs represent the average values for six microcalcifications in the speck group obtained in three repeated measurements. The error bars indicate the standard deviations of the measurements.
The CNRs for six subsets are plotted in Fig. 7. The three speck groups with nominal speck sizes of 0.400, 0.230 and 0.165 mm, as shown in Fig. 4, were analyzed. The CNR of the six subsets increased with increasing speck size. The standard deviations of the CNR for the 0.400 mm speck size were relatively small compared with the smaller specks. The CNR gradually increased as the number of PVs increased for the PVc, while the CNR decreased for the PVp. It can be observed that microcalcifications with speck sizes of 0.400 and 0.230 mm have similar trends. However, for the smallest speck group, the CNRs did not show this consistent trend. The CNR from the PVc yielded a higher CNR than that from the PVp, except for the smallest speck group.
Fig. 7.
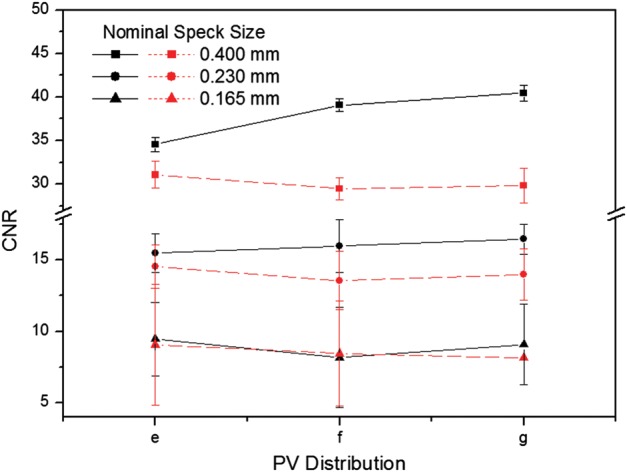
The CNRs for microcalcifications with nominal speck sizes of 0.400, 0.230 and 0.165 mm (shown in Fig. 4). The CNRs were obtained by averaging six microcalcifications in the speck group and three repeated measurements. The error bars indicate the standard deviation of the measurements. Six subsets of different PV distributions were selected from (E), (F) and (G) in Fig. 2 (PVc) and Fig. 3 (PVp). The solid and dashed lines are subsets in Fig. 2 and Fig 3, respectively.
Figure 8 shows the FWHM and CNR for microcalcifications in reconstructions based on five different AD distributions (see in Table 1). Figure 8A shows that the CNR values improved as the total dose in the central seven PVs was increased, while the vertical resolution decreased. Corresponding plots are shown in Fig. 8B for distributions with 3, 7 and 11 of 21 PVs at the center receiving four times the peripheral dose. It was found that the CNR values decreased with increase in the number of PVs, while the vertical resolution was improved.
Fig. 8.
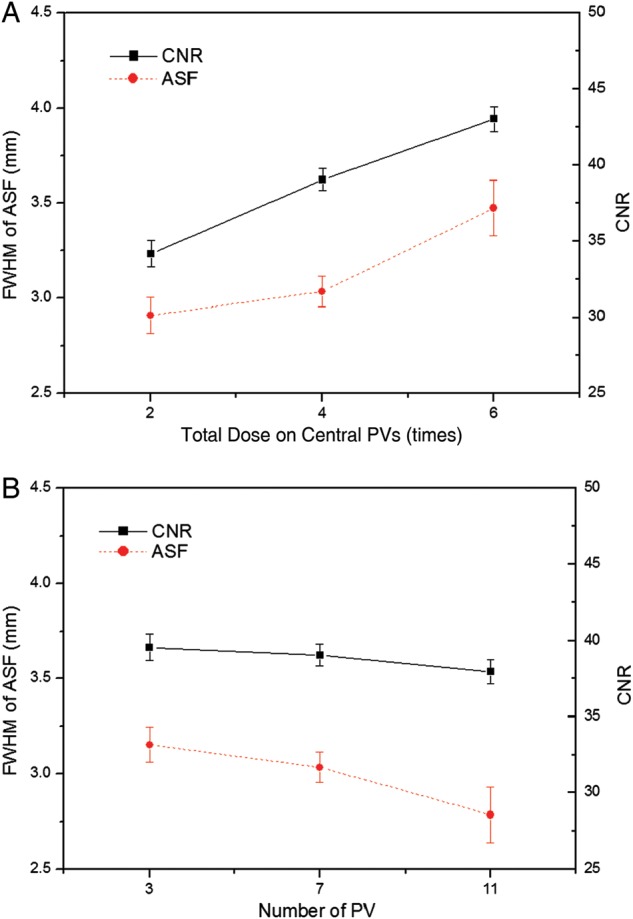
Comparison of the FWHMs and the CNRs using different AD distributions. (A) The total dose on the central 7 PVs was two, four and six times the peripheral dose. (B) The number of central PVs with four times the peripheral total dose was 3, 7 and 11 (shown in Table 1). The PV distribution in each AD distribution was fixed at 21 PVs over a ±25° angular range with ±2.5° spacing.
Table 2 shows results for quantitative analyses of DBT reconstructions with corresponding acquisition parameters. For comparison, the result of the reference scan that was acquired at 21 PVs over ±25° angular range with ±2.5° angular increment was included. For microcalcifications in the speck group of nominal size 0.400, the CNR increased with increasing PV and AD distributions at the center as compared with increasing PVp, while the subsets with PVp generally yielded smaller FWHMs. However, subsets with PVp, such as Fig. 3D and G, gave greater FWHM than the reference with uniform PV distribution. The overall image quality factor, the acquisition configuration with PVc or higher AD at the central region generally yielded higher QF than the reference configuration. In particular, the various AD distributions that concentrate the dose in the central views may yield the highest QF.
Table 2.
The acquisition configuration and the results of the quantitative analysis performed on the DBT reconstructions
| Effect | Group | DBT acquisition configuration | FWHM of ASF | CNR | QF |
|---|---|---|---|---|---|
| Reference | Uniform | 21 PVs with ±2.5° angular spacing | 2.807 | 32.465 | 11.566 |
| PV distribution | PVc | Fig. 2A | 3.202 | 38.125 | 11.906 |
| Fig. 2B | 3.308 | 39.450 | 11.924 | ||
| Fig. 2C | 3.525 | 39.965 | 11.338 | ||
| Fig. 2D | 3.823 | 39.299 | 10.278 | ||
| Fig. 2E | 2.923 | 34.560 | 11.822 | ||
| Fig. 2F | 3.256 | 39.085 | 12.006 | ||
| Fig. 2G | 3.502 | 40.470 | 11.555 | ||
| PVp | Fig. 3A | 2.659 | 30.460 | 11.457 | |
| Fig. 3B | 2.619 | 28.490 | 10.878 | ||
| Fig. 3C | 2.676 | 28.870 | 10.790 | ||
| Fig. 3D | 2.958 | 27.857 | 9.418 | ||
| Fig. 3E | 2.795 | 31.058 | 11.111 | ||
| Fig. 3F | 2.777 | 29.478 | 10.617 | ||
| Fig. 3G | 2.855 | 27.846 | 9.753 | ||
| AD distribution | High dose in central site | No. 2 in Table 1 | 2.908 | 34.175 | 11.751 |
| No. 3 in Table 1 | 3.036 | 39.045 | 12.860 | ||
| No. 4 in Table 1 | 3.475 | 43.020 | 12.379 | ||
| No. 5 in Table 1 | 3.154 | 39.549 | 12.539 | ||
| No. 6 in Table 1 | 2.786 | 37.944 | 13.620 |
The 20 subsets were created to investigate the effects of different PV and AD distributions with a constant total dose on the reconstructed image quality. (The total MDG was 2.0 mGy.) For all acquisition configurations, microcalcifications in the speck group of nominal size 0.400 mm were used.
Figure 9 and 10 show in-focus slices revealing microcalcifications with nominal speck size 0.165 mm in the commercial breast-mimicking phantom. These reconstructed images of the phantom, shown in Fig. 9A, B and C, represent scans with high PV density in the central region (Fig. 2B), reference settings, and high PV densities at both peripheral sites (Fig. 3C), respectively. In Fig. 9C, the microcalcifications and breast parenchyma appear blurred. In the image shown in Fig. 9A, all six microcalcifications in the speck group can be observed with higher contrast. In comparison, the image in Fig. 9B is slightly more blurred than images from the subset with PVc.
Fig. 9.

The in-focus DBT slices showing microcalcifications with nominal speck size of 0.165 mm in the commercial breast-mimicking phantom. The DBT slices were reconstructed using (A) PVc (Fig. 2B), (B) reference PVs, and (C) PVp (Fig. 3B).
To qualitatively verify the effect of varying the AD distribution, reconstructed images of the breast-mimicking phantom with the reference configuration and No. 6 in Table 1 are shown in Fig. 10. The different AD distributions with more dosage delivered to the central views of the tissue-equivalent phantom with the homogeneous background showed the highest QF (shown in Table 2), and improvement of image quality under the same AD distributions was also found for the commercial breast-mimicking phantom with the heterogeneous background, as shown in Fig. 10B. It can be seen that for uniform AD distributions, microcalcifications with nominal speck sizes of 0.130 mm appear to be blurred.
Fig. 10.

The in-focus DBT slices for microcalcifications with nominal speck sizes of 0.165 and 0.130 mm in the commercial breast-mimicking phantom. Example reconstructed images were acquired with 21 projection views over a ±25° angular range. (A) Uniform dose configuration (reference). (B) Non-uniform dose configuration (quarter of total dose is given for the central 11 PVs, and the rest of the dose is distributed over the remaining projection angles, as No. 6 in Table 1).
DISCUSSION
In this study, we tested the effects of varying acquisition parameters, notably PV and AD distributions, on the quality of images reconstructed from data acquired with our prototype DBT system. With a tissue-equivalent breast phantom study, we compared the results of 20 subsets with 21 PVs over an angular range of ±25°, as shown in Table 2. The metrics (CNR, ASF and QF) that were used for quantitative evaluation can also be used to compare the results of other acquisition configurations for the DBT system. Our results demonstrate that for microcalcifications, non-uniform configurations with more PVs or dosage on the central site yielded higher image quality. In particular, different distributions for PVs and the AD (with the same total dose) have a strong impact on the vertical resolution in the z-direction. In varying the PV distribution, we found that PVp yielded the greatest FWHMs, even slightly smaller than with the reference configuration. With increasing PVc of the scan, the FWHMs declined, reflecting progressive decrease in data from peripheral sites. These findings concur with those in previous studies of extreme non-uniformity in density distribution at large angles [20]. Zhang et al. demonstrated that the PVs acquired close to the middle region contribute more to blurring in the out-of-focus planes than the peripheral PVs. The effects of PV density distribution on CNR in microcalcification images were similar to results previously obtained for relatively high-contrast microcalcifications [21]. In contrast to FWHM results, the CNRs increased slightly with increasing PVc, while CNRs decreased with increasing PVp. This may indicate that PV distributions with PVp did not provide enough information to reconstruct contrast in the focal plane. As described by Sechopoulos et al., the CNR of microcalcifications is sensitive to image noise, which increases with angular range [12]. With PVp, a greater proportion of PVs with large incidence angles contribute to image than with PVc, and noise is accordingly greater in the reconstructed images [22]. The CNR results from all subsets with PVp were therefore inferior to results for other distribution subsets. The CNR values for all configuration subsets also depended on speck size. While CNRs for relatively high-contrast microcalcifications, e.g. those for speck sizes of 0.400 and 0.230 mm, followed similar trends, CNRs for the smallest speck group showed greater sensitivity to changing parameters. As shown in Fig. 7, the CNR of six subsets increased with increasing speck size because the larger microcalcifications produced relatively high contrast. Accordingly, the standard deviation in CNR was smaller for the larger speck groups than for the smallest speck group. We also investigated the effects of different AD distributions. Using the homogeneous tissue-equivalent phantom, we found that vertical resolution declined as the total dose delivered to 7 of 21 PVs placed at the center in the scan was increased, and also as the number of central PVs receiving four times the peripheral dose was decreased. As the AD delivered to the central views increased, noise increased at the two peripheral sites relative to contrast, because the dose per projection decreased. In this situation, the peripheral PVs gave insufficient information for image reconstruction in the z-direction. By similar reasoning, we explain the clear increase we observed in CNR values as dose increased in the central region of the scan. To optimize configuration parameters, we employed a QF that combines the metrics for in-focus plane quality and for resolution in the z-direction of the reconstructed images. Overall, the acquisition configurations with high PVc or AD delivery at the central site yielded higher QF values than the reference configuration. In particular, increasing dose delivery to the central views may generate the highest QF. However, very high-dose concentrations toward the central views (see No. 18 in Table 2) may reduce the quality of the reconstructed image as increasing noise in peripheral views begins to dominate resolution in the z-direction. In addition to the tissue-equivalent phantom with homogeneous background, we used a commercial breast-mimicking phantom to reconstruct images acquired with all subsets of parameters. For the subsets with the PVc, all six microcalcifications in the speck group of nominal size 0.165 mm (relatively low-contrast microcalcifications) appeared with acceptably high contrast, while the subsets with PVp generated blurred images of microcalcifications and breast parenchyma. For all subsets of AD distribution, all microcalcifications in the 0.165-mm speck group could be observed. The conspicuity of the microcalcification may be slightly greater when compared with the reference configuration. However, the uniform AD distribution produced a higher CNR. In this study, no subset of parameters gave results superior to the others in all metrics, indicating an inevitable trade-off between in-focus plane quality and resolution in the z-direction. In the design of a DBT system it is necessary to consider the trade-offs among these physical imaging properties. We have not shown these results to be valid for all specific types of lesion, breast backgrounds and image reconstruction methods, and for use of relative metrics such as the CNR and ASF; however, we have presented a general protocol for optimizing configuration parameters for a DBT system.
CONCLUSION
The effects of variable PV and AD distributions on reconstructed image quality in DBT were investigated. Using a total glandular dose of 2.0 mGy to the imaged breast volume, twenty subsets of configuration parameters were created. Although increasing the central PV density or AD improved reconstructed image quality, an excessive PV density at the center increased noise in peripheral views to the detriment of image quality. Therefore, a strategic trade-off among physical imaging properties may be necessary to optimize diagnostic accuracy in a DBT system. Our results point to changes in analytical protocol that may improve image quality in DBT.
FUNDING
This study was supported by the Korea Electrotechnology Research Institute (KERI) and by the National Research Foundation of Korea (NRF) grant funded by the Korean Government (MEST) (No. 2010-0018504).
REFERENCES
- 1.Pisano E-D, Gatsonis C, Hendrick E, et al. Diagnostic performance of digital versus film mammography for breast cancer screening. N Engl J Med. 2005;353:1773–83. doi: 10.1056/NEJMoa052911. [DOI] [PubMed] [Google Scholar]
- 2.Pisano E-D. Current status of full-field digital mammography. Radiology. 2000;214:26–28. doi: 10.1148/radiology.214.1.r00ja5226. [DOI] [PubMed] [Google Scholar]
- 3.Mahesh M. AAPM/RSNA physics tutorial for residents. Digital mammography: an overview. Radiographics. 2004;24:1747–60. doi: 10.1148/rg.246045102. [DOI] [PubMed] [Google Scholar]
- 4.Fletcher S-W, Elmore J-G. Clinical practice. Mammographic screening for breast cancer. N Engl J Med. 2003;348:1672–80. doi: 10.1056/NEJMcp021804. [DOI] [PMC free article] [PubMed] [Google Scholar]
- 5.Tabar L, Vitak B, Chen H-T, et al. Beyond randomized controlled trials: organized mammographic screening substantially reduces breast carcinoma mortality. Cancer. 2001;91:1724–31. doi: 10.1002/1097-0142(20010501)91:9<1724::aid-cncr1190>3.0.co;2-v. [DOI] [PubMed] [Google Scholar]
- 6.Wu T, Stewart A, Stanton M, et al. Tomographic mammography using a limited number of low-dose cone-beam projection images. Med Phys. 2003;30:365–80. doi: 10.1118/1.1543934. [DOI] [PubMed] [Google Scholar]
- 7.Zhao B, Zhao W. Three-dimensional linear system analysis for breast tomosynthesis. Med Phys. 2008;35:5219–32. doi: 10.1118/1.2996014. [DOI] [PMC free article] [PubMed] [Google Scholar]
- 8.Wu T, Zhang J, Moore R-H, et al. Digital tomosynthesis mammography using a parallel maximum-likelihood reconstruction method. Proc SPIE. 2004;5368:1–11. [Google Scholar]
- 9.Wu T, Moore R-H, Rafferty E-A, et al. A comparison of reconstruction algorithms for breast tomosyntheis. Med Phys. 2004;31:2636–47. doi: 10.1118/1.1786692. [DOI] [PubMed] [Google Scholar]
- 10.Bissonnette M, Hansroul M, Masson E, et al. Digital breast tomosynthesis using an amorphous selenium flat panel detector. Proc SPIE. 2005;5745:529–40. [Google Scholar]
- 11.Zhao B, Zhao W. Imaging performance of an amorphous selenium digital mammography detector in a breast tomosynthesis system. Med Phys. 2008;35:1978–87. doi: 10.1118/1.2903425. [DOI] [PMC free article] [PubMed] [Google Scholar]
- 12.Sechopoulos I, Ghetti C. Optimization of the acquisition geometry in digital tomosynthesis of the breast. Med Phys. 2009;36:1199–207. doi: 10.1118/1.3090889. [DOI] [PubMed] [Google Scholar]
- 13.Chawla A-S, Lo J-Y, Baker J-A, et al. Optimized image acquisition for breast tomosynthesis in projection and reconstruction space. Med Phys. 2009;36:4859–69. doi: 10.1118/1.3231814. [DOI] [PMC free article] [PubMed] [Google Scholar]
- 14.Reiser I, Nishikawa R-M. Task-based assessment of breast tomosynthesis: effect of acquisition parameters and quantum noise. Med Phys. 2010;37:1591–600. doi: 10.1118/1.3357288. [DOI] [PMC free article] [PubMed] [Google Scholar]
- 15.Sechopoulos I, Suryanarayanan S, Vedantham S, et al. Computation of the glandular radiation dose in digital tomosynthesis of the breast. Med Phys. 2007;34:221–32. doi: 10.1118/1.2400836. [DOI] [PMC free article] [PubMed] [Google Scholar]
- 16.Sechopoulos I, D'Orsi C. Glandular radiation dose in tomosynthesis of the breast using tungsten targets. J Appl Clin Med Phys. 2008;9:161–71. doi: 10.1120/jacmp.v9i4.2887. [DOI] [PMC free article] [PubMed] [Google Scholar]
- 17.Fessler J. Medical Image Processing and Analysis. Washington: SPIE—The International Society for Optical Engineering; 2000. [Google Scholar]
- 18.Sotthivirat S, Fessler J. Image recovery using partitioned separable paraboloidal surrogate coordinate ascent algorithms. IEEE Trans Image Process. 2002;11:306–17. doi: 10.1109/83.988963. [DOI] [PubMed] [Google Scholar]
- 19.Zhang Y, Chan H-P, Sahiner B, et al. A comparative study of limited-angle cone-beam reconstruction methods for breast tomosynthesis. Med Phys. 2006;33:3781–95. doi: 10.1118/1.223754. [DOI] [PMC free article] [PubMed] [Google Scholar]
- 20.Zhang Y, Chan H-P, Goodsitt MM. Investigation of different PV distributions in digital tomosynthesis mammography (DTM) LNCS. 2008;5116:593–600. [Google Scholar]
- 21.Lu Y, Chan H-P, Wei J, et al. Image quality of microcalcifications in digital breast tomosynthesis: effects of projection-view distributions. Med Phys. 2011;38:5703–12. doi: 10.1118/1.3637492. [DOI] [PMC free article] [PubMed] [Google Scholar]
- 22.Mainprize J-G, Bloomquist A-K, Kempston M-P, et al. Resolution at oblique incidence angles of a flat panel imager for breast tomosynthesis. Med Phys. 2006;33:3159–64. doi: 10.1118/1.2241994. [DOI] [PubMed] [Google Scholar]