

Abstract
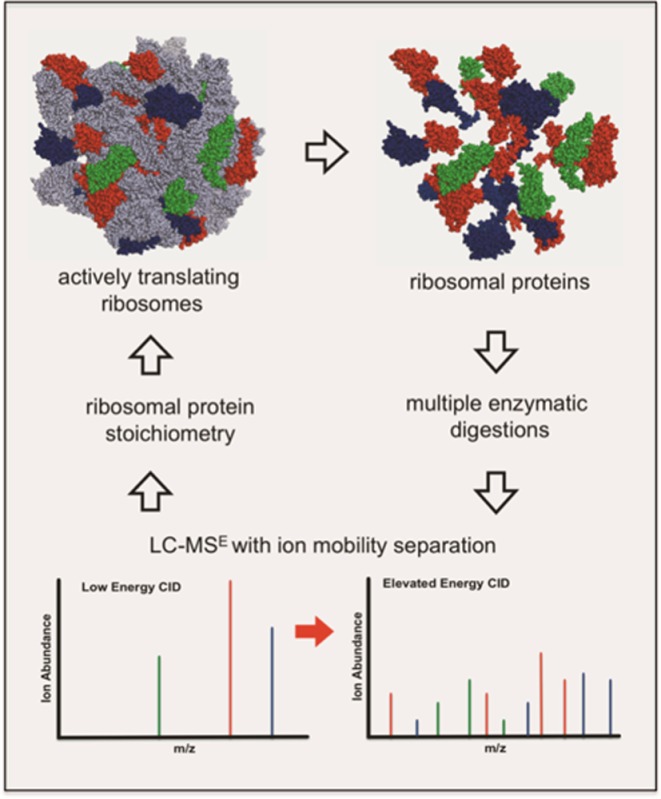
Mass spectrometry-based quantification of ribosomal proteins (r-proteins) associated with mature ribosomes and ribosome assembly complexes is typically accomplished by relative quantification strategies. These strategies provide information on the relative stoichiometry of proteins within the complex compared to a wild-type strain. Here we have evaluated the applicability of a label-free approach, enhanced liquid chromatography–mass spectrometry (LC–MSE), for absolute “ribosome-centric” quantification of r-proteins in Escherichia coli mature ribosomes. Because the information obtained in this experiment is related to the number of peptides identified per protein, experimental conditions that allow accurate and reproducible quantification of r-proteins were found. Using an additional dimension of gas-phase separation through ion mobility and the use of multiple endoproteinase digestion significantly improved quantification of proteins associated with mature ribosomes. The actively translating ribosomes (polysomes) contain amounts of proteins consistent with their known stoichiometry within the complex. These measurements exhibited technical and biological reproducibilities at %CV less than 15% and 35%, respectively. The improved LC–MSE approach described here can be used to characterize in vivo ribosome assembly complexes captured during ribosome biogenesis and assembly under different perturbations (e.g., antibiotics, deletion mutants of assembly factors, oxidative stress, nutrient deprivation). Quantitative analysis of these captured complexes will provide information relating to the interplay and dynamics of how these perturbations interfere with the assembly process.
The ribosome is a ribonucleoprotein (RNP) particle responsible for catalyzing protein synthesis in living organisms. The bacterial 70S ribosome is composed of two unequal subunits defined by their relative sedimentation coefficients. The large ribosomal subunit 50S consists of two ribonucleic acid (rRNA) molecules (23S rRNA and 5S rRNA) plus 34 ribosomal proteins (r-proteins, L1–L36). The small ribosomal subunit 30S is composed of only one rRNA molecule (16S rRNA) and 21 r-proteins (S1–S21). Detailed X-ray crystal structures of the bacterial ribosome have revealed a wealth of information that increased our understanding of ribosome structure, function as well as antibiotic action.1−6
Because r-proteins are present in one copy per translating ribosome except for proteins L7 and L12, which are present in two copies each, the ribosome presents an ideal model system to develop analytical tools for quantitative analyses. One such tool is the enhanced liquid chromatography–mass spectrometry (LC–MSE) approach developed by Silva and co-workers for absolute quantification of proteins in simple and complex mixtures.7,8 This method is based upon the observation that the average signal response of the three most intense peptides per mole of protein is constant with CV less than 10% (MW range from 14 to 97 kDa). This technique involves alternating scans of low-energy collision-induced dissociation (CID) and high-energy CID during LC–MS to enable both protein identification and quantification in a single experiment. Using an internal standard, a universal MS signal response factor (counts/mol of protein) is determined and then applied to other well-characterized proteins in the mixture to determine their absolute amounts.
The alternate scanning mode of data acquisition during LC–MS analysis allows a comprehensive inventory of all precursor ions with their corresponding time-resolved product ions. This approach does not bias gas-phase preselection of precursor ions during CID, as compared to that of data dependent analysis (DDA). Thus, all components that are above the detection limit of the instrument are detected and identified. In addition, two aspects of the LC–MSE approach make it a potentially viable method for high-throughput qualitative and quantitative analyses. First, the accurate mass measurements of precursor and their respective product ions provide confident identifications of large number of proteins with high sequence coverage. Second, its ability to collect high-quality MS data across the entire chromatographic peak width for all detected peptides allows accurate quantification of peptides/proteins present in a given sample.8 These attributes of the LC–MSE approach enabled quantification of many important analytes in a variety of biological systems including viral antigens,9 microsomal membrane and bacterial proteome,10,11 human serum,12 and plant proteins.13,14 Further, the approach was also evaluated in different instrumental platforms such as on FT-ICR instruments and has been found to be robust if at least three or more peptides are identified and detected per protein.15
One major limitation of the original LC–MSE approach, however, is that the method is biased against low molecular weight (under 14 kDa) proteins.7,8 The magnitude of the error in quantification is highly dependent on the number of peptides available for quantification.8 As the majority of the bacterial ribosomal proteins have a molecular weight less than 14 kDa (Figure 1), absolute quantification of ribosomal proteins by LC–MSE has not been effective. To improve quantitative results across the entire molecular weight range of bacterial r-proteins, methods that can increase the number of peptides per protein amenable to quantification are needed.
Figure 1.

Plot of the molecular weight of bacterial ribosomal proteins from the small 30S subunit (A) and the large 50S subunit (B). More than 50% of the proteins have molecular weight less than 14 kDa, a cutoff range that was originally determined in quantifying proteins by LC–MSE.
Ion mobility separation provides an additional dimension of gas-phase separation prior to CID. It offers a rapid 2D separation (microsecond–millisecond) of ionized precursor ions and the reduction of chemical noise and ion suppression effects. This technique offers a greater number of observed proteolytically derived peptides.16 Valentine and co-workers showed that ion mobility separation provides more than an order of magnitude enhancement in component resolution.18 This gain leads to improvements in measurement sensitivity, dynamic range,17 spectral quality,19 peptide/protein identifications via higher sequence coverage, and lower errors in protein abundance measurements. Therefore, it is of interest here to determine whether the addition of ion mobility separation will improve LC–MSE quantification of lower molecular weight bacterial ribosomal proteins.
Other approaches used to increase sequence coverage of proteins involve the use of more than one protease. Choudhary et al. showed that multiple enzyme digestion (trypsin, Lys-C, and Asp-N) significantly increased the sequence coverage of proteins identified by shotgun sequencing.20 Likewise, Swaney and co-workers demonstrated, using Saccharomyces cerevisiae as the model organism, that a large portion of the proteome is inaccessible using a single protease digestion alone.21 Using multiple proteases (trypsin, LysC, ArgC, Asp-N, and Glu-C), the sequence coverage of the proteins is improved 3-fold. Similar results were observed using multiple enzymatic digestion to enhance sequence coverage of proteins in human cerebrospinal fluid22 and ErbB2 tumor receptor.23
To evaluate the applicability of the LC–MSE approach for “ribosome-centric” quantification of r-proteins in wild-type Escherichia coli polysomes, we have investigated strategies to enable reproducible and accurate quantification of r-proteins. These improvements include incorporation of orthogonal gas-phase separation using ion mobility and multiple endoproteinase digestion. These strategies significantly enhanced the number of peptides identified per protein, protein sequence coverage, and thus r-protein quantification. With this optimized LC–MSE approach, r-proteins with molecular weights >5 kDa, with few exceptions, can be accurately quantified.
Experimental Procedures
Materials
Tryptone and yeast extract were obtained from Fisher Scientific (Fairlawn, NJ). Trypsin (sequencing grade) and RNase-free DNase were purchased from Promega (Madison, WI). Chymotrypsin (sequencing grade) was obtained from Protea Biosciences (Morgantown, WV). Micrococcal nuclease (MNase) was purchased from New England Biolabs (Ipswich, MA). Phosphorylase b (MassPrep Standard) and Fibrinopeptide b (Glu-Fib) were obtained from Waters (Milford, MA). Protease Inhibitor Cocktail, endoproteinases Asp-N and Glu-C, chloramphenicol (CAM), 2-mercaptoethanol, dithiothreitol (DTT), iodoacetamide (IA), and molecular-grade sucrose were obtained from Sigma (St. Louis, MO). Acids and organic solvents were HPLC grade or better.
Bacterial Culture
E. coli wild-type (wt) K-12 strain was obtained from the American Type Culture Collection (ATCC, Manassas, VA). The strain was cultured following standard growth conditions, harvesting and isolation procedures previously described with minor modifications.24 A single colony of wt K-12 was inoculated in 10 mL of 2xYT media (1.6% Bacto Tryptone, 1% Bacto Yeast Extract, 0.5% NaCl) and incubated overnight at 37 °C and 200 rpm. One milliliter of cell suspension was transferred into 1 L of culture media. At mid log phase (A600: 0.6–0.8), chloramphenicol was added (0.1 mg/mL, final concentration) 3 min before harvesting. The cells were rapidly cooled on ice and harvested by centrifugation at 6000 rpm, 4 °C for 7 min. The cell pellet was resuspended in lysis buffer (60 mM KCl, 60 mM NH4Cl, 50 mM Tris–HCl, 6 mM MgCl2, 6 mM 2-mercaptoethanol, pH 7.5–7.7). Cells were passed twice through a French Press, and the supernatant was collected. RNase-free DNase (1 g of cell/2.5 μL) and protease inhibitor cocktail (2 g of cell/0.5 mL) were added and incubated on ice for 20 min. An equal volume of buffer D (60 mM KCl, 60 mM NH4Cl, 10 mM Tris–HCl, 12 mM MgCl2, 6 mM β-mercaptoethanol, pH 7.5–7.7) was added, and the mixture was then clarified by centrifugation at 16,000 rpm, 4 °C for 30 min. The crude lysate was recovered and stored at −80 °C until further use.
Isolation of 70S Ribosomes and Polysomes
Following culturing, 70S ribosomes and polysomes were purified by sucrose density gradient ultracentrifugation. A 10–50% sucrose gradient in buffer D was prepared using a gradient mixer. Approximately 80–100 ODU of crude lysate were gently layered on top of the gradients. The gradients were then centrifuged for 15 h at 23,000 rpm at 4 °C using a Beckman SW32 rotor/SW28 swinging bucket rotor. The fractions were collected using an ISCO automated fraction collector with continuous monitoring at 254 nm. Fractions corresponding to the 70S ribosomes or polysomes were pooled and pelleted by centrifugation for 20 h at 48,000 rpm at 4 °C. The ribosome pellets were resuspended in buffer D and stored at −80 °C until further use.
Micrococcal Nuclease (MNase) Digestion of RNA and Protein Extraction
To enable dissociation of proteins from ribosomes, the RNA was first digested with MNase (100 μg ribosomes/100 U MNase) at 37 °C overnight. Proteins were then precipitated by acetone after RNA extraction with acetic acid. The total protein concentration was determined using the Coomassie Plus Bradford Assay Kit (Pierce Scientific, Rockford, IL).
Enhanced Liquid Chromatography–Mass Spectrometry (LC–MSE)
Quantification of total polysomal r-proteins using LC–MSE was performed as described elsewhere.8 Five micrograms of total polysomal proteins were resuspended in 8 M urea, 0.4 M ammonium bicarbonate (pH 7.5–8.5). The protein mixture was reduced and alkylated using DTT and IAA, respectively. Trypsin (1:30 enzyme: protein ratio) was added and incubated overnight at 37 °C to digest the proteins. Tryptic digests were cleaned using C18 ziptips and spiked with predigested phosphorylase b (0.5 pmol on column) as the internal standard (IS).
Tryptic peptides were analyzed on a Synapt G2S mass spectrometer coupled to a nanoAcquity UPLC (Waters, Milford, MA). Reversed-phase chromatography on a BEH130 C18 column (1.7 μm, 100 μm × 100 mm, Waters, Milford, MA) was performed at a flow rate of 1.0 μL min–1 using 0.1% formic acid in water as mobile phase A and 0.1% formic acid in acetonitrile as mobile phase B. Two microliters of tryptic digest was injected on column (500 ng total protein concentration). Gradient elution was carried out starting with 5% B for the first minute and 5% B min–1 to 10% B for another minute. A linear gradient from 10% B to 50% B for 58 min was then employed followed by a constant 50% B for 10 min. Finally, a 4.5% B min–1 to 5% B for 10 min was carried out and the column was re-equilibrated at 5% B for another 10 min. Mass spectra were recorded in positive ion mode with a source temperature of 100 °C and spray voltage of 3.5 kV. Lock mass (Glu-Fib, mass-to-charge 875.8426, 2+) was delivered using an auxiliary pump at 0.5 μL min–1 at 100 fmol μL–1 to the reference sprayer of the NanoLock Spray source. All LC–MSE analyses were operated in sensitivity mode with at least a 10 000 mass resolving power (fwhm). Continuum and accurate mass LC–MSE spectral data were collected on alternating acquisition mode of low-energy CID and high-energy CID, as previously described.8 A constant 4 eV was applied at low-energy CID mode while an energy ramp from 15 to 40 eV was used at high-energy CID mode. Scan time was 1 s for both low-energy CID mode and high-energy CID mode. For ion mobility MS separation (IMS) of peptides, the triwave region was operated at constant wave velocity and wave height of 1500 m/s and 40 V, respectively. All samples were analyzed in triplicate.
Multiple Endoproteinase Digestion of Proteins
Multiple proteases including trypsin, chymotrypsin, Asp-N, and Glu-C were used to digest total r-proteins. The digestion conditions for each protease were individually optimized as described in the manufacturer’s protocol. Five micrograms of total proteins were digested with each protease and the proteolytic digests were combined and spiked with IS before LC–MSE analysis. Identical LC–MS conditions were used, as described above.
Database Searching and Data Analysis
Continuum LC–MSE spectral data were uploaded to PLGS (ProteinLynx Global Server, Version 2.5.2, Waters, Milford, MA) for protein identification and quantification.25 Searches were limited to E. coli (22 708 sequences). Search parameters used included monoisotopic masses with peptide mass tolerance and fragment mass tolerance set to automatic. Typical peptide and fragment mass tolerances in sensitivity mode are less than 10 ppm. One internal missed cleavage was allowed with cysteine residues being carbamidomethylated (+57.0215 Da) and methionine being oxidized (+15.9949 Da). A composite decoy search was performed and specific cutoff scores were determined allowing a <4% false positive rate. A minimum of two peptide matches was considered for positive protein identification. Manual inspection of MS/MS data was performed for proteins having only two peptide matches to verify sequence assignments. For quantification of proteins in continuum LC–MSE data, the calibration protein, phosphorylase b (P00489), was set to 500 fmol. For database searching of LC–MSE data from multiple protease digestion, trypsin was set as the primary digest reagent while nonspecific protease was set as the secondary digest reagent.
Results and Discussion
The LC–MSE approach was originally developed and evaluated for proteins with molecular weight range of 14 kDa to 97 kDa.8 Large errors in quantification will occur for small proteins as they generate too few tryptic peptides and therefore are underrepresented in a typical tryptic digest. Because more than 50% of bacterial 70S r-proteins have molecular weight less than 14 kDa, absolute quantification of these proteins by LC–MSE is challenging (Figure 1). To evaluate improvements to the original LC–MSE method, r-proteins isolated from wild type E. coli polysomes were quantified. Polysomes are actively translating ribosomes and the r-proteins in these complexes are present in stoichiometric amounts of one copy for each r-protein except for proteins L7 and L12, which are present in two copies each.6,26
Absolute Quantification of Proteins in E. coli Polysomes by LC–MSE
An initial LC–MSE analysis of total polysomal proteins using the previously described approach by Silva et al. revealed a nonuniform distribution of both small subunit and large subunit proteins associated with the complex (Figure 2). The original approach is based upon a single protease digestion of total polysomal proteins with trypsin and the corresponding tryptic digests were analyzed by LC–MSE. To limit run-to-run variability, protein levels were normalized to protein S4 and protein L3 for 30S proteins and 50S proteins, respectively. Proteins S4 and L3 are expected to be present in one copy per ribosome, as they are primary binding proteins and essential for ribosome assembly. The small molecular weight r-proteins from both subunits did not yield good quantitative results, as some of these proteins are present in substoichiometric amounts (less than 0.8). Only 21 out of 55 r-proteins (38%) were detected at the expected level. The majority of proteins present in substoichiometric amounts are lower molecular (<14 kDa) proteins, consistent with previous reports on LC–MSE analysis of r-proteins.8 Therefore, strategies to enhance quantification of most, if not all, ribosomal proteins associated with mature ribosomes were investigated.
Figure 2.

Quantification of 30S r-proteins (A) and 50S r-proteins (B) by LC–MSE as described by Silva et al.8 Ribosomal proteins are not uniformly distributed and are not detected in one copy per ribosome as determined by LC–MSE. Amounts of small subunit and large subunit proteins are normalized to r-protein S4 and r-protein L3, respectively. Error bars represent the standard deviation of three replicate measurements.
Ion Mobility Separation with LC–MSE
The first approach for improving quantification of r-proteins was the additional dimension of gas-phase separation afforded by ion mobility. Figure 3A,B shows the number of peptides detected for the small subunit and large subunit proteins after trypsin digestion without and with ion mobility separation. The number of peptides detected for each protein increases with ion mobility compared to without ion mobility. Similarly, the sequence coverage of the proteins increases as well (Figure 3C,D).
Figure 3.

Plots of the number of peptides (A,B) and sequence coverage (C,D) of r-proteins using trypsin digestion alone with and without ion mobility separation. The additional dimension of gas-phase separation through ion mobility increases the number of peptides detected and sequence coverage of the proteins.
Some proteins show a dramatic enhancement in the number of peptides detected and protein sequence coverage. For instance, protein S1 has an almost 6-fold increase in the number of peptides identified with ion mobility separation. This increase afforded a 3-fold improvement in sequence coverage. This increase is attributed to the ability of ion mobility separation to reduce and eliminate chemical noise and ion suppression effects, thereby confidently identifying low-abundant peptides. The increased ability to disperse peptide ions signals during ion mobility separation facilitates simultaneous MS/MS fragmentation of IMS-separated ions, thus enhancing throughput and experimental sensitivity.16 Other proteins, such as protein S6 and S7, have no appreciable increase in either the number of peptides detected or the sequence coverage. Although the number of peptides and the sequence coverage of r-proteins were improved by addition of ion mobility separation, a nonstoichiometric trend in the amounts of proteins is still observed for both small and large subunit proteins (Figure S1, Supporting Information).
Multiple Endoproteinase Digestion
The next strategy investigated was the use of multiple proteases. The small subunit proteins S15, S17, S18, S19, S20, and S21 and the large subunit proteins L21, L23, L28, L29, L30, L31, L32, L33, L34, L35, and L36 generate few detectable tryptic peptides during LC–MSE analysis (cf. Figure 3A,B). Consequently, these proteins are more likely to have large quantification errors. Chymotrypsin, Asp-N, and Glu-C were used in addition to trypsin. The high specificity of these enzymes allows generation of unique peptides from each protease, thereby improving protein quantification. Figure 4 shows the experimental strategy used for multiple enzymatic digestion of r-proteins from mature E. coli polysomes.
Figure 4.

Experimental strategy using multiple enzymes to digest total proteins (TP) from wild-type E. coli polysomes. The high specificity of these different enzymes generate unique proteolytic peptides, which are then subjected to LC–MSE analysis.
To evaluate whether multiple protease digestion improves quantification of r-proteins, each protease was first evaluated individually to determine optimal digestion conditions. After optimizing the conditions for each endoproteinase, the proteolytic peptides were combined and subjected to LC–MSE analysis. The number of peptides detected and protein sequence coverage were dramatically improved (Figure 5) leading to higher accuracy r-protein quantification (Figure 6). A representative example of the data obtained by this improved approach is illustrated using r-protein S9. In the standard MSE sample preparation and analysis strategy, this r-protein is significantly underrepresented during quantification (cf. Figure 1). Figure 7 presents extracted ion chromatograms (XICs) and low-energy MS data from three digestion products identified with S9, with high-energy MS sequence confirmation shown in Figure S2 (Supporting Information). The combination of multiple protease digestion with ion mobility separation significantly improves sequence coverage (Figure 5C) and absolute quantification (Figure 6A) of this 14.8 kDa r-protein. Such improvements were consistently observed for all r-proteins, including all low molecular weight (<14 kDa) r-proteins except S21, L34, L35, and L36.
Figure 5.

Plots of the number of peptides (A,B) and sequence coverage (C,D) of r-proteins using multiple endoproteinase digestion with and without ion mobility separation. The additional dimension of gas-phase separation through ion mobility increases the number of peptides detected and sequence coverage of the proteins.
Figure 6.

Quantification of 30S r-proteins (A) and 50S r-proteins (B) using ion mobility separation and multiple protease digestion as improvements to the LC–MSE approach. A uniform distribution of proteins is observed for the majority of r-proteins quantified, which is in agreement with their known stoichiometry within the complex. Ribosomal proteins S21, L34, L35, and L36 are not quantified because they generate too few peptides, even using multiple enzymatic digestion and ion mobility separation. Amounts of small subunit and large subunit proteins are normalized to r-protein S4 and r-protein L3, respectively. Error bars represent the standard deviation of three replicate measurements.
Figure 7.

(A) Extracted ion chromatograms (XIC’s) of the three most intense peptides of small ribosomal subunit protein S9. (B) Low-energy mass spectrum of GGGISGQAGAIR peptide (2+, m/z 522.19). (C) Low-energy mass spectrum of SLEQYFGR peptide (2+, m/z 502.71). (D) Low-energy mass spectrum of ALMEYDESLR peptide (2+, m/z 613.67). High-energy mass spectral data confirming peptide sequences are shown in Figure S2 (Supporting Information).
One advantage observed using multiple proteases to digest r-protein is the generation of longer peptide digestion products. These longer peptides exhibit a narrower range of ionization efficiencies and are usually the three most intense peptides used for quantification, consequently improving r-protein quantification (data not shown). Most importantly, combining the use of multiple proteases to generate proteolytically unique peptides with ion mobility separation now allows for a wider mass range of proteins to be quantified.
Reproducibility of an optimized LC–MSE approach
To confirm the technical and biological reproducibility of these measurements, additional experiments were performed using two biological replicates of E. coli wild-type cells. For each biological replicate, the proteins in polysomes were purified and analyzed by the improved LC–MSE. Quantification of proteins by the improved LC–MSE approach showed very good run-to-run reproducibility with CV less than 13% for both large and small subunit r-proteins (Tables S1 and S2, Supporting Information). Likewise, the biological reproducibility was also examined using two biological preparations of wild-type cells. Although the %CV between biological replicates can reach up to 35% for some proteins, most proteins showed consistent biological reproducibility (Tables S3 and S4, Supporting Information). Because ribosomes are highly dynamic complexes within a cell, the composition of the ribosomes varies depending on its functional state, which could explain some of the biological heterogeneity detected here.
Conclusions
Overall, the improvements of the LC–MSE method using ion mobility separation and multiple endoproteinase digestion allow accurate and reproducible quantification of r-proteins in ribosomes. A uniform distribution of r-proteins was observed in actively synthesizing ribosomes, in agreement with the known stoichiometry of these proteins within the complex. Although most of the polysomal r-proteins are reproducibly quantified by the improved LC–MSE, several proteins (S21, L34, L35, and L36) are still not quantifiable by this technique, even using ion mobility separation and multiple endoproteinase digestion. This technique is limited to proteins that generate enough peptides for detection and quantification. Too small proteins do not generate many peptides, even using multiple proteases and therefore cannot be quantified.
Although not specifically investigated here, the use of multiple proteases to increase protein sequence coverage should also improve quantification methods based on spectral counting. Label-free approaches based on spectral counts and ion abundance have been shown to correlate with protein abundance.27 For example, spectral counting can be used to establish a normalized spectral abundance factor (NSAF)28 that can then enable quantitative analysis of multicomponent protein complexes.28,29 As the NSAF depends on peptide coverage, one could envision improvements in r-protein quantification throughout the entire molecular weight range by that and other related approaches, which would not necessarily require additional ion mobility separation of the multiple protease digestion mixture.
The presence of post-translational modifications in r-proteins might affect the resulting stoichiometry of the proteins. This is true when dealing with in vivo ribosome assembly complexes wherein some r-proteins are not fully modified yet during the course of ribosome biogenesis and assembly.30 For mature ribosomes, however, r-proteins are fully modified and the errors and variability due to PTMs are less or negligible. Some proteins might be lost during purification of these complexes as well and could affect quantification of the proteins. The improved LC–MSE approach described here can be used to characterize in vivo ribosome assembly complexes captured during ribosome biogenesis and assembly under different perturbations (e.g., antibiotics, deletion mutants of assembly factors, oxidative stress, nutrient deprivation). Quantitative analysis of these captured complexes will provide information relating to the interplay and dynamics of how these perturbations interfere with ribosome assembly.
Acknowledgments
We acknowledge the National Institutes of Health (GM 058843 and RR 027671) and the University of Cincinnati for financial support.
Supporting Information Available
Quantification of r-proteins by IMS-LC–MSE, high-energy mass spectra of three r-protein S9 peptides, and technical and biological replicate data for r-protein quantification. This material is available free of charge via the Internet at http://pubs.acs.org.
The authors declare no competing financial interest.
Funding Statement
National Institutes of Health, United States
Supplementary Material
References
- Ban N.; Nissen P.; Hansen J.; Moore P. B.; Steitz T. A. Science 2000, 289, 905–920. [DOI] [PubMed] [Google Scholar]
- Carter A. P.; Clemons W. M.; Brodersen D. E.; Morgan-Warren R. J.; Wimberly B. T.; Ramakrishnan V. Nature 2000, 407, 340–348. [DOI] [PubMed] [Google Scholar]
- Schlunzen F.; Zarivach R.; Harms J.; Bashan A.; Tocilj A.; Albrecht R.; Yonath A.; Franceschi F. Nature 2001, 413, 814–821. [DOI] [PubMed] [Google Scholar]
- Selmer M.; Dunham C. M.; Murphy F. V. t.; Weixlbaumer A.; Petry S.; Kelley A. C.; Weir J. R.; Ramakrishnan V. Science 2006, 313, 1935–1942. [DOI] [PubMed] [Google Scholar]
- Wimberly B. T.; Brodersen D. E.; Clemons W. M. Jr.; Morgan-Warren R. J.; Carter A. P.; Vonrhein C.; Hartsch T.; Ramakrishnan V. Nature 2000, 407, 327–339. [DOI] [PubMed] [Google Scholar]
- Cate J. H.; Yusupov M. M.; Yusupova G. Z.; Earnest T. N.; Noller H. F. Science 1999, 285, 2095–2104. [DOI] [PubMed] [Google Scholar]
- Silva J. C.; Denny R.; Dorschel C. A.; Gorenstein M.; Kass I. J.; Li G. Z.; McKenna T.; Nold M. J.; Richardson K.; Young P.; Geromanos S. Anal. Chem. 2005, 77, 2187–2200. [DOI] [PubMed] [Google Scholar]
- Silva J. C.; Gorenstein M. V.; Li G. Z.; Vissers J. P.; Geromanos S. J. Mol. Cell. Proteomics 2006, 5, 144–156. [DOI] [PubMed] [Google Scholar]
- Creskey M. C.; Li C.; Wang J.; Girard M.; Lorbetskie B.; Gravel C.; Farnsworth A.; Li X.; Smith D. G.; Cyr T. D. Vaccine 2012, 30, 4762–4770. [DOI] [PubMed] [Google Scholar]
- Mbeunkui F.; Goshe M. B. Proteomics 2011, 11, 898–911. [DOI] [PubMed] [Google Scholar]
- Silva J. C.; Denny R.; Dorschel C.; Gorenstein M. V.; Li G. Z.; Richardson K.; Wall D.; Geromanos S. J. Mol. Cell. Proteomics 2006, 5, 589–607. [DOI] [PubMed] [Google Scholar]
- Vissers J. P.; Langridge J. I.; Aerts J. M. Mol. Cell. Proteomics 2007, 6, 755–766. [DOI] [PubMed] [Google Scholar]
- Blackburn K.; Cheng F. Y.; Williamson J. D.; Goshe M. B. Rapid Commun. Mass Spectrom. 2010, 24, 1009–1016. [DOI] [PubMed] [Google Scholar]
- Cheng F. Y.; Blackburn K.; Lin Y. M.; Goshe M. B.; Williamson J. D. J. Proteome Res. 2009, 8, 82–93. [DOI] [PubMed] [Google Scholar]
- Grossmann J.; Roschitzki B.; Panse C.; Fortes C.; Barkow-Oesterreicher S.; Rutishauser D.; Schlapbach R. J. Proteomics 2010, 73, 1740–1746. [DOI] [PubMed] [Google Scholar]
- McLean J. A.; Ruotolo B. T.; Gillig K. J.; Russell D. H. Int. J. Mass Spectrom. 2005, 240, 301–315. [Google Scholar]
- Valentine S. J.; Plasencia M. D.; Liu X.; Krishnan M.; Naylor S.; Udseth H. R.; Smith R. D.; Clemmer D. E. J. Proteome Res. 2006, 5, 2977–2984. [DOI] [PubMed] [Google Scholar]
- Geromanos S. J.; Hughes C.; Golick D.; Ciavarini S.; Gorenstein M. V.; Richardson K.; Hoyes J. B.; Vissers J. P.; Langridge J. I. Proteomics 2011, 11, 1189–1211. [DOI] [PubMed] [Google Scholar]
- Harry E. L.; Weston D. J.; Bristow A. W.; Wilson I. D.; Creaser C. S. J. Chromatogr. B: Anal. Technol. Biomed. Life Sci. 2008, 871, 357–361. [DOI] [PubMed] [Google Scholar]
- Choudhary G.; Wu S. L.; Shieh P.; Hancock W. S. J. Proteome Res. 2003, 2, 59–67. [DOI] [PubMed] [Google Scholar]
- Swaney D. L.; Wenger C. D.; Coon J. J. J. Proteome Res. 2010, 9, 1323–1329. [DOI] [PMC free article] [PubMed] [Google Scholar]
- Biringer R. G.; Amato H.; Harrington M. G.; Fonteh A. N.; Riggins J. N.; Huhmer A. F. Briefings Funct. Genomics Proteomics 2006, 5, 144–153. [DOI] [PubMed] [Google Scholar]
- Held J. M.; Schilling B.; D’Souza A. K.; Srinivasan T.; Behring J. B.; Sorensen D. J.; Benz C. C.; Gibson B. W. Int. J. Proteomics 2013, 2013, 791985. [DOI] [PMC free article] [PubMed] [Google Scholar]
- SpeddingRibosomes and Protein Synthesis: A Practical Approach; Oxford University Press: Oxford, U.K., 1990. [Google Scholar]
- Hughes M. A.; Silva J. C.; Geromanos S. J.; Townsend C. A. J. Proteome Res. 2006, 5, 54–63. [DOI] [PubMed] [Google Scholar]
- Sykes M. T.; Shajani Z.; Sperling E.; Beck A. H.; Williamson J. R. J. Mol. Biol. 2010, 403, 331–345. [DOI] [PMC free article] [PubMed] [Google Scholar]
- Old W. M.; Meyer-Arendt K.; Aveline-Wolf L.; Pierce K. G.; Mendoza A.; Sevinsky J. R.; Resing K. A.; Ahn N. G. Mol. Cell. Proteomics 2005, 4, 1487–1502. [DOI] [PubMed] [Google Scholar]
- Paoletti A. C.; Parmely T. J.; Tomomori-Sato C.; Sato S.; Zhu D.; Conaway R. C.; Conaway J. W.; Florens L.; Washburn M. P. Proc. Natl. Acad. Sci. U. S. A. 2006, 103, 18928–18933. [DOI] [PMC free article] [PubMed] [Google Scholar]
- Florens L.; Carozza M. J.; Swanson S. K.; Fournier M.; Coleman M. K.; Workman J. L.; Washburn M. P. Methods (San Diego, CA, United States) 2006, 40, 303–311. [DOI] [PMC free article] [PubMed] [Google Scholar]
- Clatterbuck-Soper S. F.; Dator R. P.; Limbach P. A.; Woodson S. A. Mol. Cell 2013, 52, 506–516. [DOI] [PMC free article] [PubMed] [Google Scholar]
Associated Data
This section collects any data citations, data availability statements, or supplementary materials included in this article.