Abstract
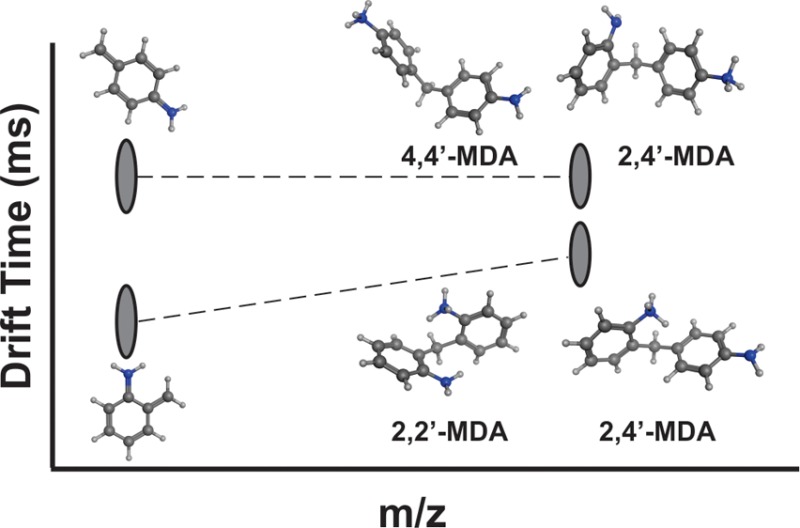
Purified methylenedianiline (MDA) regioisomers were structurally characterized and differentiated using tandem mass spectrometry (MS/MS), ion mobility-mass spectrometry (IM-MS), and IM-MS/MS in conjunction with computational methods. It was determined that protonation sites on the isomers can vary depending on the position of amino groups, and the resulting protonation sites play a role in the gas-phase stability of the isomer. We also observed differences in the relative distributions of protonated conformations depending on experimental conditions and instrumentation, which is consistent with previous studies on aniline in the gas phase. This work demonstrates the utility of a multifaceted approach for the study of isobaric species and elucidates why previous MDA studies may have been unable to detect and/or differentiate certain isomers. Such analysis may prove useful in the characterization of larger MDA multimeric species, industrial MDA mixtures, and methylene diphenyl diisocyanate (MDI) mixtures used in polyurethane synthesis.
Polyurethanes are inherently complex, and thus structural characterization of these polymers can be challenging. Intrinsic distributions of molecular size and cross-linking produce structural heterogeneity,1 even among purified samples. Additional heterogeneity can arise from varying amounts of hard and soft block segments and structural variations within the segments themselves.
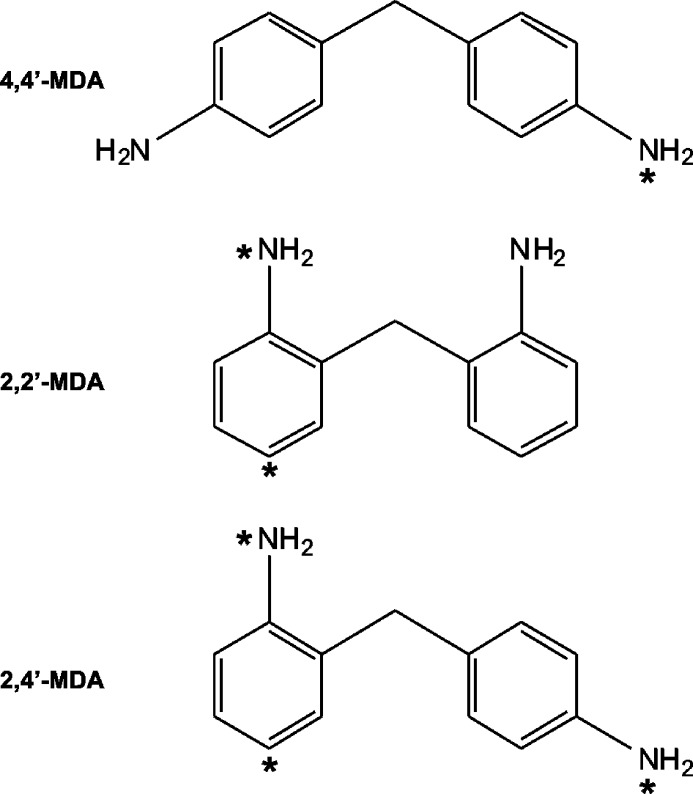
Methylenedianiline (MDA) is used to synthesize methylene diphenyl diisocyanate (MDI), a major hard block component of polyurethanes. Most formulations of industrial grade MDA primarily contain 4,4′-MDA, along with a number of structural isomers and multimers.2−4 The purpose of this research is to fully characterize structural variations within MDA mixtures and eventually MDI mixtures. However, in order to better understand complex mixtures of MDA and MDI, it is first necessary to study 2-ring MDA regioisomers that differ only by the position of amine functional groups, as shown in Figure 1 (asterisks indicate unique protonation sites). By characterizing specific 2-ring species, we can gain insight into the behavior of more complex multimeric structures and eventually determine relative abundances in complex MDA mixtures. Previous MDA studies in the literature were typically done in a workplace exposure context and utilized gas chromatography/mass spectrometry (GC/MS),4−6 or more recently liquid chromatography-mass spectrometry (LC-MS) detection.7−12 Limitations of these methods for MDA characterization include the necessity for sample derivatization (GC/MS) and an inability to detect and differentiate low abundance isomers such as 2,4′-MDA and 2,2′-MDA (both GC/MS and LC-MS). In contrast, techniques which probe gas-phase structural conformations may provide insight into the characterization and discrimination of even low-abundance isomers without requiring sample pretreatment.
Figure 1.
Structures of MDA positional isomers (theo. neutral molecule monoisotopic mass = 198.12 Da). Potential protonation sites are labeled with an asterisk.
Ion mobility-mass spectrometry (IM-MS) is a gas-phase electrophoretic separation technique coupled to a mass measurement technique and thus is capable of differentiating isomeric species and characterizing these species by ion size and mass. In IM, ions are subject to low energy collisions with a neutral buffer gas and subsequently separated by their effective gas-phase size.13−16 Ions which possess a large cross-sectional area experience a high number of collisions and are impeded, whereas ions which possess a smaller cross-sectional area experience fewer collisions and traverse the IM drift region more rapidly. Gas-phase ion size and shape are described by the molecular collision cross section (CCS), which can be calculated directly using the elution time from an electrostatic drift tube (typically on the order of milliseconds). Coupled with molecular modeling studies, CCS data can be used to investigate three-dimensional gas-phase structures. A more detailed explanation of IM-MS methodology as well as potential applications for polymer analysis can be found elsewhere in the literature.17−24
The additional dimension of separation based on the size and shape of gas-phase ions allows for the differentiation of isobaric species based on CCS. IM characterization of low-molecular-weight structural isomers was first studied by Hagen over two decades ago using a stand-alone (no MS) ambient pressure drift tube instrument.25,26 Small but reproducible CCS differences were observed for isomers due to factors such as the position of unique atoms (e.g., nitrogen in a carbon ring system), location of functional groups, and connectivity of aromatic ring systems. For example, a consistent trend was observed for substituted toluene isomers, where substitution at the meta position led to larger CCS values than substitutions at para or ortho positions.25 Nevertheless, at the time, Hagen was limited in his ability to fully interpret the data due to the lack of robust MS detection.
Inspired by Hagen’s work, we used tandem mass spectrometry (MS/MS), IM-MS, and IM-MS/MS methods to fully characterize and differentiate 2-ring MDA standards. CCS values were obtained for each isomer, which provides significant insight into isomeric gas-phase conformation(s) and their respective stabilities. Moreover, we utilize computational modeling to assist our interpretation of IM-MS data and to facilitate connecting isomeric differences in CCS with molecular structures.
Experimental Section
Materials
4,4′-MDA, 2,4′-MDA, and 2,2′-MDA were provided by Dr. Stefan Wershofen, Bayer MaterialScience AG, 47812 Krefeld, Germany. Their authenticity was established by 13C and 1H NMR as shown in the Supporting Information (Figures S-1 through S-6). Methanol and formic acid were obtained from Sigma-Aldrich, USA. Alkali salts and tetralkylammonium salts were obtained from Sigma-Aldrich (St. Louis, MO) with the exception of sodium chloride (Thermo Fisher Scientific, Waltham, MA).
Instrumentation
Traveling-Wave IM-MS
MS, MS/MS, and traveling-wave (T-wave) IM-MS data were obtained on Synapt G2 and G2-S (Waters Corporation, Milford, MA) mass spectrometers. The T-wave platform differs from traditional drift-tube ion mobility (DTIM) in that it utilizes electrodynamic rather than electrostatic fields. Thus, T-wave drift times cannot be inserted directly into the Mason-Schamp equation, as the exact quantitative nature of the T-wave electrodynamic field is unknown. Nevertheless, T-wave CCS values can be determined when measurements are calibrated using DTIM CCS values from the literature.17 In order to obtain CCS values from T-wave measurements, we used a series of quaternary ammonium salts as calibration standards in conjunction with their literature DTIM CCS values.27
All samples were analyzed as positive ions with electrospray ionization (ESI). The T-wave drift cell was operated with a pressure of 3 mbar (2.25 Torr), an electrodynamic wave height of 35 V, and velocity of 700 m/s, and the TOF resolution (m/Δm) was approximately 20 000. MDA samples were dissolved at a concentration of 0.10 mg/mL in 9:1 methanol/water containing 0.1% formic acid (v/v). When metal salts were used, each was at a final concentration of 0.050 mg/mL. A direct infusion flow rate of 6.00 μL/min was used for all samples. Other instrument settings were as follows: 3.00 kV capillary voltage, 80 °C source temperature, 150 °C desolvation temperature, 10 V sampling cone, 2 V extraction cone, 20 L/h cone gas flow, 1 mL/min trap gas flow, and 90 mL/min IMS gas flow. All collision-induced dissociation (CID) experiments were performed prior to T-wave mobility separation. The TOF calibration was performed using sodium formate clusters.
Center-of-mass (COM) collision energies were converted from lab-frame collision energies using the following equation:
Lab-frame energies are the voltages applied in the tandem MS instrumentation, while COM energy is essentially the available energy for molecular rearrangement or fragmentation.28 Therefore, COM energy typically has more useful interpretation power across various instrument platforms.29
Electrostatic Drift-Tube IM-MS
DTIM measurements using N2 buffer gas were performed on a prototype ESI-IM-QTOFMS instrument (Agilent Technologies, Santa Clara, CA).30 Details of this instrumentation are provided elsewhere, but briefly, the IM-MS consists of a 78 cm uniform-field drift tube coupled to a high resolution QTOFMS (m/Δm 40,000). The buffer gas was maintained at a pressure of ca. 4 Torr, and drift voltages were varied in order to correct for the non-IM flight time of ions through the interfacing ion optics. CCS values were calculated from drift times using the Mason-Schamp equation. MDA samples were at a concentration of 0.095 mg/mL in 9:1 methanol/water containing 0.1% formic acid (v/v); also, LiCl and NaCl were added to the solution so that each had a final concentration of 0.025 mg/mL. A direct infusion flow rate of 6.00 μL/min was used.
Computational and Modeling Data
As IM is a coarse-grained structural measurement, IM-MS results are often supplemented with computational studies to gain further insight into the gas-phase conformations of the molecules of interest.31 These studies generally include two steps: (1) computationally sampling the conformational space and (2) theoretical determination of CCS values for the generated conformations. More detailed structural information can then be inferred from closer inspection of generated conformations that align with experimental CCS values. Although different methods exist for both conformational sampling and theoretical determination of CCS values, the following protocol was used in this study. A geometry optimization at the Hartree–Fock level with a 6-31G* basis set was performed with Gaussian 09 for all of the possible protonation sites on each isomer (2,2′-MDA: 2 sites; 2,4′-MDA: 3 sites; and 4,4′-MDA: 1 site).32 Partial charges for each molecule were derived from ab initio electrostatic potential calculations using a 6-31G* basis set. These partial charges were then fitted using the restrained electrostatic potential (RESP) program in AMBER.33,34 For each of the protonated isomers, a short energy minimization was performed in AMBER followed by a 10 ps molecular dynamic simulation to heat the molecule to 1200 K. Then, a long molecular dynamic simulation was run at 1200 K for 9,000 ps. Structural snapshots were saved every 16,667 steps during the simulation, resulting in 3,000 structural snapshots. These high-energy structural snapshots were then cooled to 300 K during a 15 ps molecular dynamic simulation.
MOBCAL software was used to theoretically determine the collision cross section of the resulting conformations.35−37 First, the projection approximation was used to generate helium collision cross section values. For comparison with the nitrogen experimental values, nitrogen trajectory method values were determined for a set of conformations spanning the entire collision cross section range. These values were used to create a linear function to convert the remaining projection approximation values to nitrogen trajectory method values. The computational conformational space plots were then aligned with the experimental data to give structural insight into the MDA isomers.38
Results and Discussion
Characterization by MS and Tandem MS
Previously, underivatized 4,4′-MDA has been studied using LC-MS/MS instrumentation.7−12 In these studies, the fragmentation of the 4,4′-MDA parent ion ([M + H]+ = 199 Da) was monitored by means of a transition characteristic signal at 106 Da. However, to the best of our knowledge, no research has been reported for 2,2′-MDA and 2,4′-MDA structural isomers using modern LC-MS techniques.
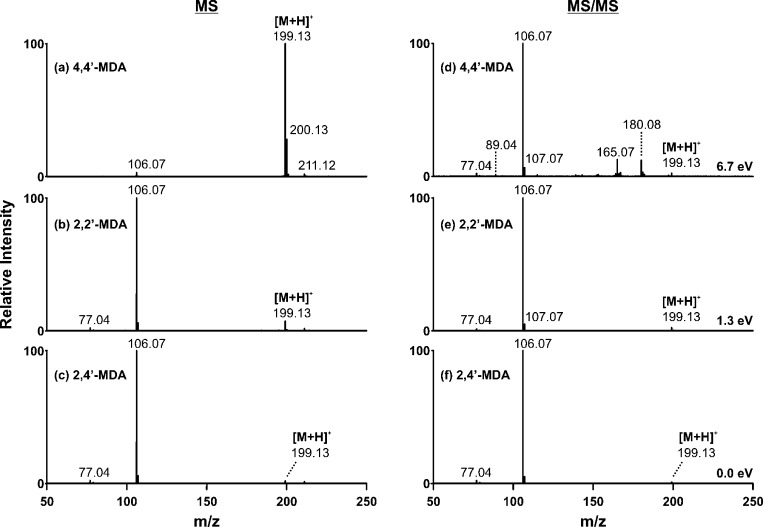
In the present study, we observed both of these signals (199 Da, 106 Da) in the 4,4′-MDA, 2,2′-MDA, and 2,4′-MDA direct infusion ESI mass spectra as shown in Figure 2a–c. In this manuscript, we use the spectra resulting from ESI rather than the more complex spectra resulting from MALDI, which will be the focus in later manuscripts in the series. The base peak of the 4,4′-MDA spectrum is the [M + H]+ signal at 199 Da, but for 2,2′-MDA and 2,4′-MDA, the 106 Da fragment is the base peak. An additional signal, although low in abundance, is observed at 211 Da. The base peak for the 4,4′-MDA at 199 Da is representative of the higher stability of the 4,4′-MDA than that of the 2,2′-MDA and 2,4′-MDA. The difference in stability is due to location of protonation site and will be discussed in more detail later in the manuscript.
Figure 2.
(left) Mass spectra of MDA isomers using direct infusion ESI-TOFMS for (a) 4,4′-MDA, (b) 2,2′-MDA, and (c) 2,4′-MDA. (right) Tandem mass spectra for parent ions ([M + H]+ = 199.13 Da) of (a) 4,4′-MDA, (b) 2,2′-MDA, and (c) 2,4′-MDA. Center-of-mass collision energies are shown at right; corresponding lab-frame collision energies are 40, 8, and 0 eV, respectively. For 2,4′-MDA, no collision energy was required for dissociation.
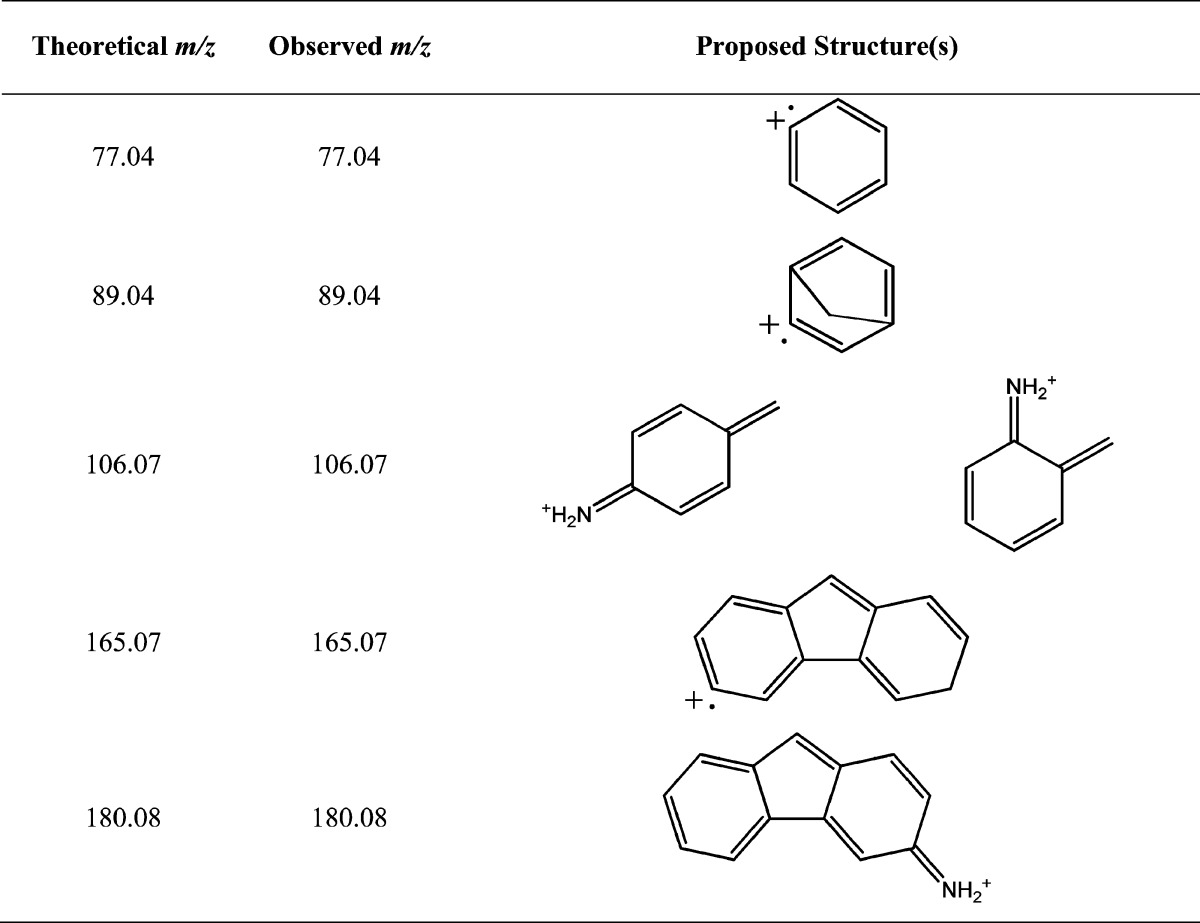
Tandem mass spectra of protonated 4,4′-MDA, 2,2′-MDA, and 2,4′-MDA are presented in Figure 2d–f, and potential corresponding structures of fragment signals are shown in Table 1. Unsurprisingly, the fragmentation spectra of all the isomers are similar in nature. However, while 4,4′-MDA required high collision energy to generate fragments (Figure 2d), 2,2′-MDA and 2,4′-MDA required minimal or no additional energy to induce dissociation (Figure 2e,f). Because of the high collision energy required to fragment 4,4′-MDA, additional signals of 165 and 180 Da are observed which are not present in 2,2′-MDA and 2,4′-MDA tandem mass spectra. Additional fragmentation data and discussion concerning the low-intensity 211 Da signal is provided in the Supporting Information (Figure S-7).
Table 1. Possible Structures of Commonly-Observed MDA Fragment Ions.
In order to compare the gas-phase stabilities of the three isomers, we monitored the conversion from 199 to 106 Da as a function of applied collision energy for all three isomers as shown in Figure 3. Both lab-frame and center-of-mass (COM) collision energies are displayed. It is clear that 4,4′-MDA (double para-substitution) is significantly more stable than either 2,2′-MDA (double ortho-substitution) or 2,4′-MDA (combined ortho- and para-substitution). For example, when 2.0 eV (COM) is applied to the 4,4′-MDA isomer, over 95% of the normalized signal remains in the 199 Da parent ion. However, at that same energy, the 199 Da parent ions for both 2,2′-MDA and 2,4′-MDA are entirely depleted. The underlying cause of this key difference as well as minor differences in the gas-phase behavior of 2,2′-MDA and 2,4′-MDA will be discussed later in the manuscript, as these observations were corroborated by other methods of structural analysis.
Figure 3.
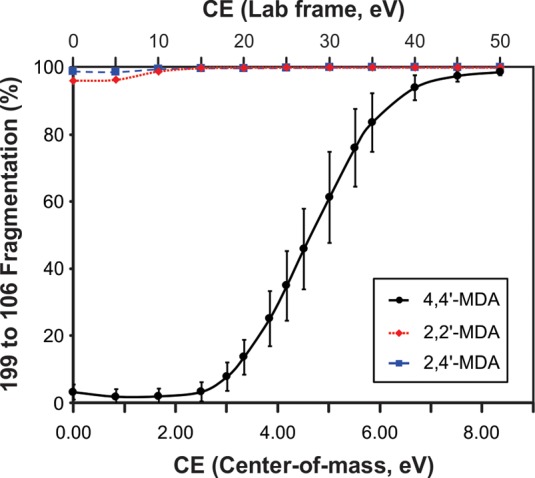
Collision-induced dissociation curves monitoring the transition of respective 199 Da parent ions to 106 Da fragment ions. Individual curves for 4,4′-MDA (solid line; black circles), 2,2′-MDA (short dash; red squares), and 2,4′-MDA (long dash; blue triangles) are superimposed. Both center-of-mass and lab-frame collision energies are shown.
A potential complicating factor in MS-based analysis of these compounds is the uncertain location of the additional proton that creates the [M + H]+ ions. Literature on aniline suggests two potential protonation sites in the gas-phase, one on the amine and one on the aromatic ring para to the amine.39−43 Recently, Eberlin and co-workers demonstrated that aniline molecules protonated at the amine group can be resolved from those protonated on the ring using T-wave separation.44 Because MDA isomers are essentially two aniline molecules connected by a methylene bridge, it is probable this behavior applies to MDA as well. Therefore, as tandem MS alone was unable to provide clarity about how protonation sites affect gas-phase structures, structural analysis by IM and computational methods were required.
Structural Analysis Using IM-MS and Computational Methods
Using both T-wave and DTIM instrumentation, CCS values were obtained for the [M + H]+ ions of the three isomers as shown in Table 2. Due to inherent differences in instrumentation and data analysis between T-wave and DTIM methodology, small differences for CCS values between platforms were expected, as observed in Table 2. In order to obtain CCS values from T-wave instrumentation, the use of calibration standards is required; in contrast, DTIM CCS values can be directly calculated from the kinetic theory of gases using the Mason-Schamp equation.13−15 In this study, DTIM CCS values were systematically higher than T-wave CCS values by 3.4 ± 0.5% Å2 (N2). We hypothesize that this systematic difference between T-wave and DTIM CCS values results from the calibration of the former and from the exposure of the charge on the MDA molecules. For the tetraalkylammonium ions used for T-wave CCS calibration, the charge resides in the center of the molecule and is surrounded by hydrocarbon tails. These tails essentially shield the charged region from the polarizable N2 drift gas. As a result, only weak inelastic collisions occur between the tetraalkylammonium calibrants and N2. However, in our MDA system, the charge is not shielded, and thus, the MDA ions are expected to experience stronger inelastic interactions with N2 which are not accounted for using the current calibration strategy.
Table 2. Collision Cross-Section Values of Various MDA Ions Obtained on T-Wave and Drift Tube IM-MS Instrumentationa.
| MDA species (ion) | T-wave N2 (Å2) | DTIM N2 (Å2) |
|---|---|---|
| 4,4′ [M + H]+ | 156.0 ± 0.7 | 162.7 ± 0.3 |
| 2,2′ [M + H]+ | 139.9 ± 1.8 | 145.0 ± 0.2 |
| 2,4′ [M + H]+ (1) | 139.9 ± 1.1 | 145.4 ± 0.4 |
| 2,4′ [M + H]+ (2) | 155.9 ± 0.5 | N/A |
Errors shown represent the respective standard deviations.
Significant differences in CCS for the [M + H]+ ions were observed between 4,4′-MDA and 2,2′-MDA, suggesting the protonation site is not centrally located in the structure. For 2,4′-MDA, we observed two CCS values in T-wave and only one corresponding CCS value for DTIM. This will be discussed later, as further analysis of the role of protonation on gas-phase stability was necessary to explain this observation.
While only one type of protonation site is available for 4,4′-MDA, the para-amino groups (p-NH2), two potential sites exist for 2,2′-MDA and three for 2,4′-MDA, as shown by the asterisks in Figure 1. For 2,2′-MDA, protonation can occur at either the ortho-amino groups (o-NH2) or the aromatic ring opposite the ortho-amino group (ring). On 2,4′-MDA, p-NH2, o-NH2, and ring sites are all present, and any one of these may be protonated.
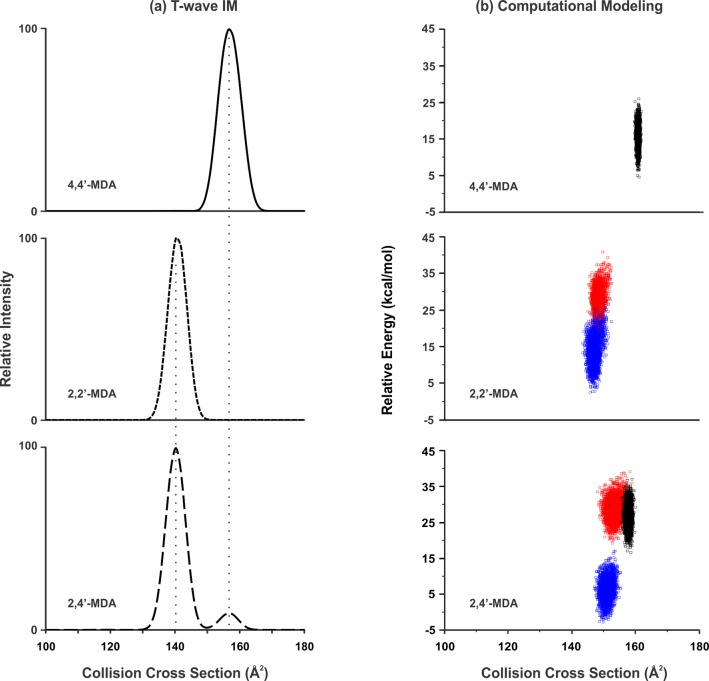
While CCS measurements were obtained using both T-wave and DTIM platforms, the majority of IM-MS and IM-MS/MS data was obtained using the T-wave platform and will therefore be the focus of this report. Extracted CCS profiles of the protonated isomers (199 Da) obtained using IM-MS are shown in Figure 4a. One conformation of 4,4′-MDA was generated with a CCS of 156 Å2 while 2,2′-MDA generated one conformation with a CCS of 140 Å2. In contrast, 2,4-MDA generated two conformations having CCS values of 156 and 140 Å2. The alignment of these two values with the 4,4′-MDA and 2,2′-MDA CCS values in Figure 4a (dotted line) indicate similar respective conformations.
Figure 4.
(a) CCS profiles of 4,4′-MDA (solid line), 2,2′-MDA (short dash), and 2,4′-MDA (long dash) [M + H]+ ions extracted from T-wave data. Vertical lines are added for visual alignment. (b) Conformations for the possible protonation sites for the (a) 4,4′-MDA, (b) 2,2′-MDA, and (c) 2,4′-MDA were generated using computational conformational search methods. The theoretical nitrogen CCS is plotted against the relative energy for each computationally generated conformation. Conformations for the p-NH2 protonated isomers are shown in black, the o-NH2 protonated isomers are shown in red, and the ring protonated isomers are shown in blue.
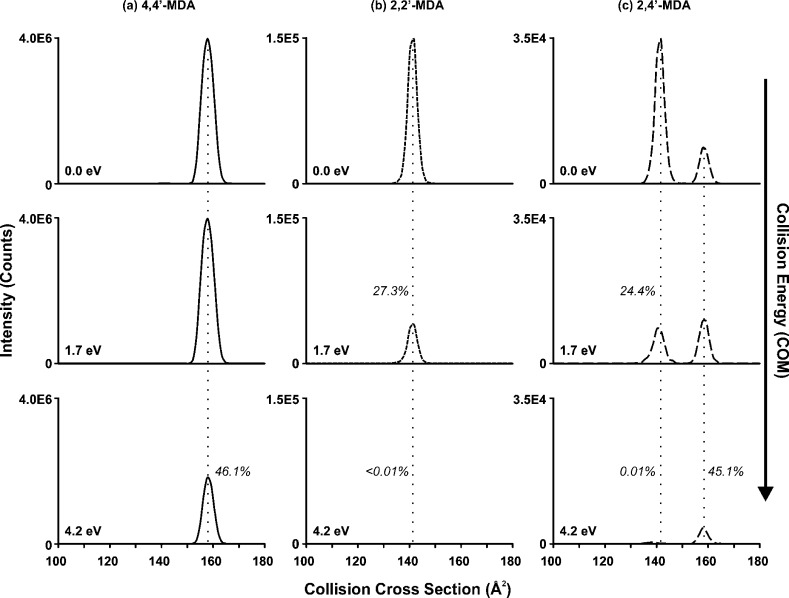
Additionally, an IM-MS/MS structural depletion study was performed to connect the gas-phase stabilities of these conformations with potential protonation sites. In Figure 5, IM profiles were obtained for the protonated isomers using different collision energies and corresponding drift times were converted to CCS values. Consistent with earlier tandem MS data, 4,4′-MDA has one primary conformation (156 Å2) which begins to deplete when high collision energy (4.2 eV) is applied as shown in Figure 5a. We can assign this CCS value to a conformation which is p-NH2 protonated, as 4,4′-MDA cannot be protonated at other positions. Because 2,4′-MDA contains one p-NH2 site as well, we also assign its CCS value of 156 Å2 to p-NH2 protonation. Evidence for this is shown in Figure 5b, where the ∼45% depletion rate of the larger 2,4′-MDA conformation for 4.2 eV matches that of 4,4′-MDA shown in Figure 5a. Because both of these conformations are rather resistant to collisionally induced depletion and fragmentation, we conclude that p-NH2 protonation generates species that are relatively stable in the gas phase.
Figure 5.
Collisionally activated CCS profiles of [M + H]+ ions for (a) 4,4′-MDA, (b) 2,2′-MDA, and (c) 2,4′-MDA. Center-of-mass energies are shown; corresponding lab-frame energies are 0, 10, and 25 eV, respectively. Note the difference in scales of the y-axes for (a) to (c). Inset relative percentages represent signal intensities compared to those without collisional activation. Vertical lines are added for visual alignment.
In contrast, the less intense conformations for 2,2′-MDA and 2,4′-MDA of 140 Å2 were less stable, leading to significant depletion upon collisional activation (Figure 5b,c). Both of these conformations were entirely depleted when 4.2 eV of energy was applied. These are more difficult to assign structurally, as two remaining protonation sites exist for the isomers (o-NH2 and ring). Conformations of all the possible protonation sites for the three isomers were generated using theoretical conformational search methods to provide further structural insight. For each of the six protonation sites, 3,000 conformations were generated and the theoretical CCS value and energy were determined and plotted for each conformation in Figure 4b. The protonation sites are indicated by the following colors: the p-NH2 conformations are shown in black, the o-NH2 conformations are shown in red, and the ring conformations are shown in blue. The p-NH2 conformations for both the 2,4′-MDA isomer and the 4,4′-MDA isomer demonstrate close theoretical CCS alignment and thus support the assignment of the larger observed CCS value. For o-NH2 and ring protonation sites in 2,2′-MDA and 2,4′-MDA, theoretical CCS values are similar, which makes it difficult to differentiate these protonation sites by CCS. However, the 2,2′-MDA and 2,4′-MDA maps shown in Figure 4b do suggest that protonation at the o-NH2 position creates higher energy conformations than those with ring protonation. High-energy conformations likely correspond to species that undergo metastable fragmentation in the mass spectrometer, which was observed for 2,2′-MDA and 2,4′-MDA as noted earlier in Figures 2 and 3. Therefore, it is likely that o-NH2 protonation leads to metastable fragmentation into 106 Da, whereas ring protonation is somewhat more stable and allows detection of (at least some of) these ions as intact 199 Da species.
Although the stability of the MDA isomers is related to protonation site, it should be noted that small differences in energy can change the relative abundances of each site. As shown in Table 2, we did not observe the p-NH2 protonation site for 2,4′-MDA using DTIM instrumentation, while this protonation site was observed in low abundance using T-wave instrumentation (e.g., Figure 4a). This is likely due to the different ion sources for the two platforms, which results in different voltages, ion transmission efficiencies, etc. As mentioned earlier, previous studies on aniline protonation in the gas phase suggest that the two protonation sites (−NH2 or ring) are relatively close in energy. Therefore, the relative abundances of aniline protonation sites can fluctuate due to small changes in experimental conditions.39 Likewise, MDA protonation sites appear to be close in energy, and the relative abundances of the protonation sites can change as well. This explains why the p-NH2 conformation of 2,4′-MDA is observed in low abundance using T-wave instrumentation but not using DTIM instrumentation. However, once the MDA compounds are protonated, the relative order of stability across both platforms is consistent as shown in the Supporting Information (Table S-1).
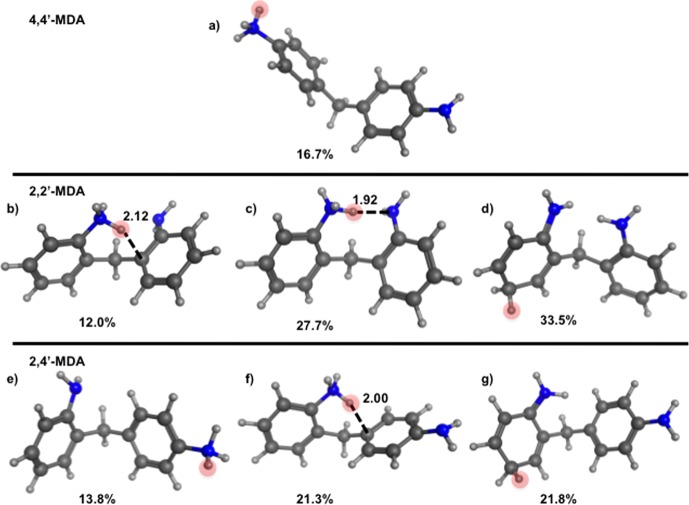
A closer look at the computationally generated conformations gives further insight into the metastable nature of the o-NH2 protonated isomers. The computationally generated conformations were structurally clustered on the basis of RMSD resulting in ten representative structures. These structures for the possible protonation sites for the three isomers can be found in the Supporting Information, but the most populated conformations are shown in Figure 6. The most populated conformation for 4,4′-MDA is shown in Figure 6a. This molecule exhibits an extended structure, consistent with experimental CCS data shown in Table 2. Conformations for 2,2′-MDA are shown in Figure 6b–d. The conformations in Figure 6b,c show o-NH2 protonated 2,2′-MDA, whereas the conformation in Figure 6d shows ring protonation. Two o-NH2 protonated isomers are needed here to explain two of our experimental observations. Figure 6b is represented of the metastable o-NH2 protonation, while Figure 6c is representative of a slightly more stable and highly populated o-NH2 protonation. When the proton resides between the two amine groups, a more stable conformation is achieved, which may explain why we see a slightly more stable 2,2′-MDA isomer in Figure 3 compared to the 2,4′-MDA isomer. These three conformations are all representative of a smaller structure, which is consistent with the experimental CCS data shown in Table 2. Conformations for 2,4′-MDA are shown in Figure 6e–g. Figure 6e shows the p-NH2 protonation whereas Figure 6f shows o-NH2 protonation and Figure 6g shows ring protonation. The conformation in Figure 6e is representative of the extended structure similar to the conformation shown in Figure 6a, which supports the experimental CCS alignment for both 4,4′-MDA and the larger 2,4′-MDA conformation. The conformations shown in Figure 6f,g are representative of a smaller structure, which is also consistent with the experimental CCS data in Table 2. The smaller structures observed for the o-NH2 protonation and ring protonation for 2,2′-MDA and 2,4′-MDA support the alignment of their experimental CCS values.
Figure 6.
RMSD clustering representatives from computational conformational sampling are shown for each of the protonation sites. (a) 4,4′-MDA p-NH2 protonated, (b) 2,2′-MDA o-NH2 protonated, (c) 2,2′-MDA o-NH2 protonated, (d) 2,2′-MDA ring protonated, (e) 2,4′-MDA p-NH2 protonated, (f) 2,4′-MDA o-NH2 protonated, and (g) 2,4′-MDA ring protonated. Red circles indicate the additional proton. Labeled bond distances are used to show the proximity of the additional proton to the bridging carbon that would lead to a 1,5-hydrogen shift fragmentation of the 2-ring MDA. A percentage is shown below each conformation to show how many conformations the selected one represents, as a result of RMSD clustering. Two conformations are shown for the 2,2-MDA o-NH2 protonated 2-ring MDA due to two favorable conformations that result from this protonation.
Mechanism for Protonation and Fragmentation of MDA Isomers
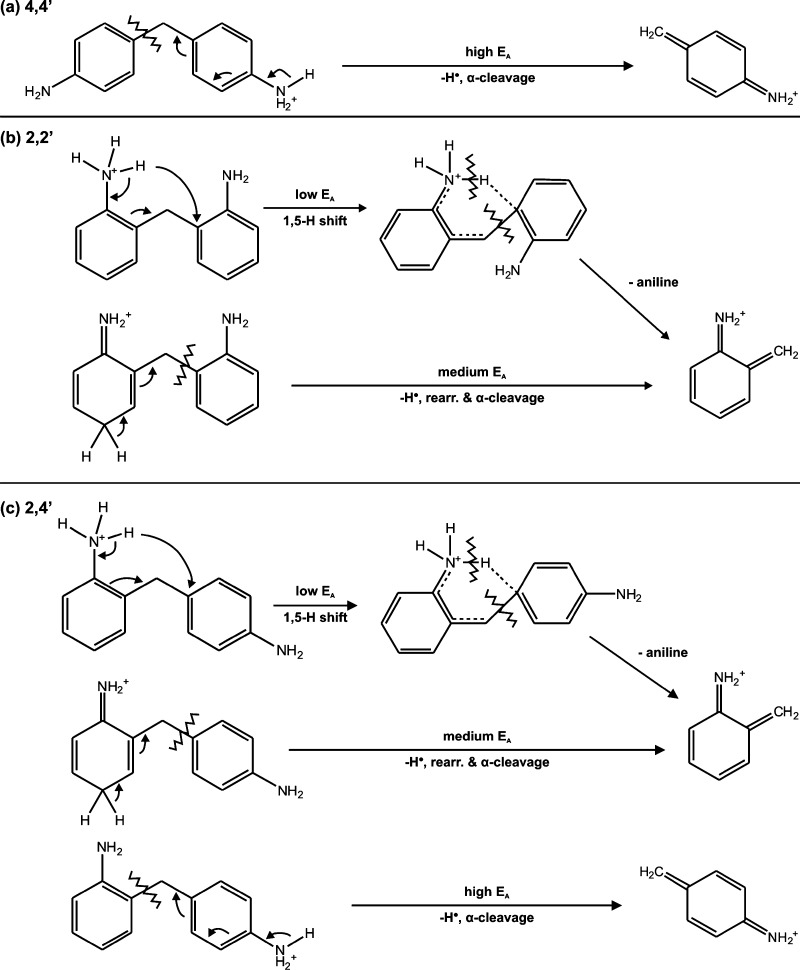
Combining tandem MS, IM-MS, IM-MS/MS, and computational modeling data, we propose mechanisms for protonation and fragmentation of MDA structural isomers in Scheme 1. The gas-phase stability of each isomer is inherently related to both the position of the amine groups and the location of the additional proton. The 4,4′-MDA isomer can only be protonated at p-NH2 groups and is the most stable gas-phase ion we observed. When a large collision energy is applied to the 4,4′-MDA parent ion, a loss of a hydrogen radical occurs, leading to alpha cleavage and formation of the 106 Da fragment. As collision energy continues to increase, other pathways also emerge, forming other fragments (Figure 2d). On the other hand, 2,2′-MDA can be protonated at either the o-NH2 or ring position. When 2,2′-MDA is protonated on an o-NH2 group, even without applied collision energy, it readily undergoes a 1,5-hydrogen shift, due to the proximity of the amine hydrogen to the bridging carbon on the opposite aromatic ring (Figure 6b), which leads to formation of the 106 Da fragment and neutral aniline. The driving force for this process is likely the stability of the products: aniline can either remain neutral or further decompose to 77 Da as shown in Figure 2e,f, and the 106 Da fragment can further rearrange to a tropylium-like ion of the same mass.7,39 This mechanism describes the metastable behavior of these ions; therefore, detection of o-NH2 protonated 2,4′-MDA or 2,2′-MDA is minimal. As a result, the primary conformation observed for the 2,2′-MDA [M + H]+ ion (199 Da) is composed of ring protonated species. When a moderate collision energy is applied to ring protonated 2,2′-MDA, loss of a hydrogen radical on the ring leads to rearrangement and formation of the 106 Da fragment as well. Finally, 2,4′-MDA may be protonated at all three sites. Protonation at the o-NH2 leads to significant metastable fragmentation due to a 1,5-hydrogen shift (Figure 6f) as in 2,2′-MDA, and protonation at the ring position leads to hydrogen radical loss and rearrangement upon collisional activation. In contrast, protonation at the p-NH2 results in a more stable conformation which fragments through a mechanism similar to that of 4,4′-MDA. This fragmentation mechanism observed for the 2-ring isomers should play a major role in the characterization of the larger industrial MDA sample mixtures.
Scheme 1. Proposed Protonated Structures and 199 Da → 106 Da Fragmentation Pathways for MDA Isomers.
Activation energy is abbreviated as EA.
Conclusions
In this study, MDA structural isomers have been characterized and differentiated by their gas-phase stabilities and potential protonation sites using a combination of MS, IM, and structural insights guided by theoretical modeling. Our results confirm that, similar to aniline, MDA may be protonated at either amine positions or ring positions in the gas phase. Structural differences between positional isomers play a large role in determining the gas-phase stability as does the site of protonation. The collective use of tandem MS, IM-MS, IM-MS/MS, and computational methods allowed us to gain significant structural understanding of this system and suggests that a holistic approach to studying positional isomers is of great utility.
Industrial grade MDA, which is used to synthesize polyurethanes, is composed primarily of 4,4′-MDA but also 2,2′-MDA, 2,4′-MDA, and larger multimers. On the basis of the data presented in this paper, we hypothesize that previous studies on MDA mixtures which focused primarily on 4,4′-MDA did so due to the large difference in gas-phase stability between 4,4′-MDA and the other two isomers, 2,2′-MDA and 2,4′-MDA. These isomers were likely in low abundance in MDA samples; however, due to metastable fragmentation, the researchers were likely unable to detect them.
A more thorough understanding of MDA behavior in the gas phase will lead to a more comprehensive characterization of industrial MDA mixtures and better understanding of polyurethane fragmentation in mass spectrometry. In future studies, we look to structurally characterize larger MDA oligomers, complex MDA, and complex MDI mixtures using not only ESI-IM-MS but also MALDI-IM-MS. Our results on the 2-ring MDA compounds suggest IM-MS methods of characterizing larger multimers and MDA mixtures will prove beneficial to fully understand not only the molecular composition of the sample but also the structural differences between isobaric species within the sample. These differences, invisible to most polymer characterization methods, likely play a role in the resulting gas-phase structures of the polyurethanes.
Acknowledgments
The authors thank Dr. Stefan Wershofen for providing 4,4′-MDA, 2,4′-MDA, and 2,2′-MDA samples and Tiffany Onifer for assistance. We also acknowledge the characterization support of Dr. Don Stec and the Vanderbilt NMR facilities which is supported by the National Institute of Health (NIH, grant award number S10 RR019022). Additionally, we acknowledge the Vanderbilt Center for Structural Biology and Dr. Terry Lybrand for computational support and the Searle Systems Biology and Bioengineering Undergraduate Research Experience (SyBBURE) Program for summer support for N.W.K. This research was funded by the Defense Threat Reduction Agency under Grants HDTRA1-09-1-00-13 and DTRA100271 A-5196 and the Defense Advanced Research Projects Agency under Grant W911NF-12-2-0036.
Supporting Information Available
NMR spectroscopy of purified MDA isomers, additional fragmentation data, gas-phase stabilities between TWIM and DTIM instrumentation, and additional computational information. This material is available free of charge via the Internet at http://pubs.acs.org/.
Author Present Address
§ N.W.K.: Department of Chemistry, University of Wisconsin, Madison, WI 53706.
Author Contributions
† J.G.F. and S.M.S. contributed equally to this manuscript.
The authors declare no competing financial interest.
Funding Statement
National Institutes of Health, United States
Supplementary Material
References
- Chattopadhyay D. K.; Raju K. V. S. N. Prog. Polym. Sci. 2007, 32, 352–418. [Google Scholar]
- Eifler W.; Ick J. U.S. Patent 4,189,443, February 19, 1980.
- van den Berg H.; van der Ham L.; Gutierrez H.; Odu S.; Roelofs T.; de Weerdt J. Chem. Eng. J. 2012, 207, 254–257. [Google Scholar]
- Skarping G.; Dalene M. J. Chromatogr., B 1995, 663, 209–216. [DOI] [PubMed] [Google Scholar]
- Cocker J.; Brown L. C.; Wilson H. K. J. Anal. Toxicol. 1988, 12, 9–14. [DOI] [PubMed] [Google Scholar]
- Bailey E.; Brooks A. G.; Bird I.; Farmer P. B.; Street B. Anal. Biochem. 1990, 190, 175–181. [DOI] [PubMed] [Google Scholar]
- Chen K.; Dugas T. R.; Cole R. B. J. Mass Spectrom. 2006, 41, 728–734. [DOI] [PubMed] [Google Scholar]
- Chen K.; Dugas T. R.; Cole R. B. Anal. Bioanal. Chem. 2008, 391, 271–278. [DOI] [PMC free article] [PubMed] [Google Scholar]
- Chen K.; Cole R. B.; Santa Cruz V.; Blakeney E. W.; Kanz M. F.; Dugas T. R. Toxicol. Appl. Pharmacol. 2008, 232, 190–202. [DOI] [PMC free article] [PubMed] [Google Scholar]
- Johnson J. R.; Karlsson D.; Dalene M.; Skarping G. Anal. Chem. Acta 2010, 678, 117–123. [DOI] [PubMed] [Google Scholar]
- Pezo D.; Fedeli M.; Bosetti O.; Nerín C. Anal. Chem. Acta 2012, 756, 49–59. [DOI] [PubMed] [Google Scholar]
- Wang C. Y.; Li H. Q.; Wang L. G.; Cao Y.; Liu H. T.; Zhang Y. Chin. Chem. Lett. 2012, 23, 1254–1258. [Google Scholar]
- McDaniel E. W.Collision Phenomena in Ionized Gases; Wiley: New York, 1964. [Google Scholar]
- McDaniel E. W.; Mason E. A.. The Mobility and Diffusion of Ions in Gases; Wiley: New York, 1973. [Google Scholar]
- Mason E. A.Ion Mobility: Its Role in Plasma Chromatography. In Plasma Chromatography; Carr T. W., Ed.; Plenum Press: New York, 1984; pp 43–93. [Google Scholar]
- Eiceman G. A.; Karpas Z.. Ion Mobility Spectrometry, 2nd ed.; CRC Press: Boca Raton, 2004. [Google Scholar]
- Ruotolo B. T.; Benesch J. L. P.; Sandercock A. M.; Hyung S.-J.; Robinson C. V. Nat. Protoc. 2008, 3, 1139–1152. [DOI] [PubMed] [Google Scholar]
- Wilkins C. L.; Trimpin S.. Ion Mobility Spectrometry-Mass Spectrometry: Theory and Applications; CRC Press: Boca Raton, 2011. [Google Scholar]
- Hines K. M.; Enders J. R.; McLean J. A.. Multidimensional Separations by Ion Mobility-Mass Spectrometry. Encyclopedia of Analytical Chemistry [Online]; Wiley: Chichester, Posted December 17, 2012. [Google Scholar]
- Hilton G. R.; Jackson A. T.; Thalassinos K.; Scrivens J. H. Anal. Chem. 2008, 80, 9720–9725. [DOI] [PubMed] [Google Scholar]
- Gies A. P.; Kliman M.; McLean J. A.; Hercules D. M. Macromolecules 2008, 41, 8299–8301. [Google Scholar]
- Trimpin S.; Clemmer D. E. Anal. Chem. 2008, 80, 9073–9083. [DOI] [PubMed] [Google Scholar]
- Li X.; Guo L.; Casiano-Maldonado M.; Zhang D.; Wesdemiotis C. Macromolecules 2011, 44, 4555–4564. [Google Scholar]
- Hoskins J. N.; Trimpin S.; Grayson S. M. Macromolecules 2011, 44, 6915–6918. [Google Scholar]
- Hagen D. F. Anal. Chem. 1979, 51, 870–874. [Google Scholar]
- Hagen D. F.Characterization of Isomers by Plasma Chromatography. In Plasma Chromatography; Carr T. W., Ed.; Plenum Press: New York, 1984; pp 115–142. [Google Scholar]
- Campuzano I.; Bush M. F.; Robinson C. V.; Beaumont C.; Richardson K.; Kim H.; Kim H. I. Anal. Chem. 2011, 84, 1026–1033. [DOI] [PubMed] [Google Scholar]
- Sleno L.; Volmer D. A. J. Mass Spectrom. 2004, 39, 1091–1112. [DOI] [PubMed] [Google Scholar]
- Rodgers M. T.; Armentrout P. B. Mass Spectrom. Rev. 2000, 19, 215–247. [DOI] [PubMed] [Google Scholar]
- May J. C.; Goodwin C. R.; Lareau N. M.; Leaptrot K. L.; Morris C. B.; Kurulugama R. T.; Mordehai A.; Klein C.; Barry W.; Darland E.; Overney G.; Imatani K.; Stafford G. C.; Fjeldsted J. C.; McLean J. Anal. Chem. 2014, 86, 2107–2116. [DOI] [PMC free article] [PubMed] [Google Scholar]
- Wyttenbach T.; Bowers M. T.. Modern Mass Spectrometry, Topics in Current Chemistry; Schalley C. A., Ed.; Springer: Berlin, 2003; 225, pp 207–232. [Google Scholar]
- Frisch M. J.; Trucks G. W.; Schlegel H. B.; Scuseria G. E.; Robb M. A.; Cheeseman J. R.; Scalmani G.; Barone V.; Mennucci B.; Petersson G. A.; Nakatsuji H.; Caricato M.; Li X.; Hratchian H. P.; Izmaylov A. F.; Bloino J.; Zheng G.; Sonnenberg J. L.; Hada M.; Ehara M.; Toyota K.; Fukuda R.; Hasegawa J.; Ishida M.; Nakajima T.; Honda Y.; Kitao O.; Nakai H.; Vreven T.; Montgomery J. A. Jr.; Peralta J. E.; Ogliaro F.; Bearpark M.; Heyd J. J.; Brothers E.; Kudin K. N.; Staroverov V. N.; Kobayashi R.; Normand J.; Raghavachari K.; Rendell A.; Burant J. C.; Iyengar S. S.; Tomasi J.; Cossi M.; Rega N.; Millam J. M.; Klene M.; Knox J. E.; Cross J. B.; Bakken V.; Adamo C.; Jaramillo J.; Gomperts R.; Stratmann R. E.; Yazyev O.; Austin A. J.; Cammi R.; Pomelli C.; Ochterski J. W.; Martin R. L.; Morokuma K.; Zakrzewski V. G.; Voth G. A.; Salvador P.; Dannenberg J. J.; Dapprich S.; Daniels A. D.; Farkas O.; Foresman J. B.; Ortiz J. V.; Cioslowski J.; Fox D. J.. Gaussian 09, Revision A.02; Gaussian, Inc.: Wallingford, CT, 2009.
- Case D. A.; Darden T. A.; Cheatham T. E. III; Simmerling C. L.; Wang J.; Duke R. E.; Luo R.; Walker R. C.; Zhang W.; Merz K. M.. AMBER 11; University of California: San Francisco, 2010; Vol. 142. [Google Scholar]
- Bayly C. I.; Cieplak P.; Cornell W.; Kollman P. A. J. Phys. Chem. 1993, 97, 10269–10280. [Google Scholar]
- Wyttenbach T.; von Helden G.; Batka J. J.; Carlat D.; Bowers M. T. J. Am. Soc. Mass Spectrom. 1997, 8, 275–282. [Google Scholar]
- Mesleh M. F.; Hunter J. M.; Shvartsburg A. A.; Schatz G. C.; Jarrold M. F. J. Phys. Chem. 1996, 100, 16082–16086. [Google Scholar]
- Shvartsburg A. A.; Jarrold M. F. Chem. Phys. Lett. 1996, 261, 86–91. [Google Scholar]
- Bush M. F.; Campuzano I. D. G.; Robinson C. V. Anal. Chem. 2012, 84, 7124–7130. [DOI] [PubMed] [Google Scholar]
- Rappoport Z., Ed. The Chemistry of Anilines; John Wiley & Sons: Chichester, U.K., 2007. [Google Scholar]
- Lau Y. K.; Kebarle P. J. Am. Chem. Soc. 1976, 98, 7452–7453. [Google Scholar]
- Karpas Z.; Berant Z.; Stimac R. Struct. Chem. 1990, 1, 201–204. [Google Scholar]
- Roy R. K.; de Proft F.; Geerlings P. J. Phys. Chem. A 1998, 102, 7035–7040. [Google Scholar]
- Russo N.; Toscano M.; Grand A.; Mineva T. J. Phys. Chem. A 2000, 104, 4017–4021. [Google Scholar]
- Lalli P. M.; Iglesias B. A.; Toma H. E.; de Sa G. F.; Daroda R. J.; Silva Filho J. C.; Szulejko J. E.; Araki K.; Eberlin M. N. J. Mass Spectrom. 2012, 47, 712–719. [DOI] [PubMed] [Google Scholar]
Associated Data
This section collects any data citations, data availability statements, or supplementary materials included in this article.


