Abstract
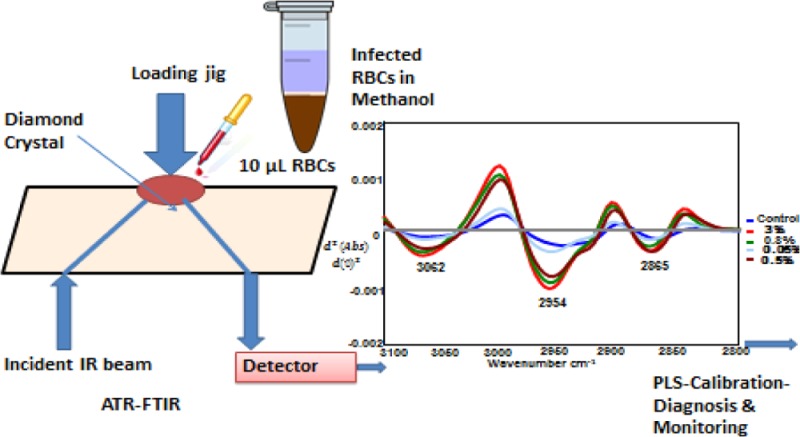
New diagnostic modalities for malaria must have high sensitivity and be affordable to the developing world. We report on a method to rapidly detect and quantify different stages of malaria parasites, including ring and gametocyte forms, using attenuated total reflectance Fourier transform infrared spectroscopy (ATR-FT-IR) and partial least-squares regression (PLS). The absolute detection limit was found to be 0.00001% parasitemia (<1 parasite/μL of blood; p < 0.008) for cultured early ring stage parasites in a suspension of normal erythrocytes. Future development of universal and robust calibration models can significantly improve malaria diagnoses, leading to earlier detection and treatment of this devastating disease.
Malaria, caused by Plasmodium falciparum, is one of the most deadly diseases, resulting in up to 1.2 million fatalities per annum.1 Accurate and early diagnosis followed by immediate treatment of the infection is essential to reduce mortality2 and prevent overuse of antimalarial drugs. New technologies to diagnose malaria must be cost-effective and have high sensitivity and be able to detect circulating stages of the malaria parasite, namely the ring and gametocyte forms, because these are the only stages present in peripheral blood circulation. The current suite of malarial diagnostics in clinical use include (1) optical microscopy of thick blood films,3,4 (2) rapid diagnostic tests (RDTs) based on the detection of antigens specific to P. falciparum,5 (3) gene amplification techniques such as polymerase chain reaction (PCR),6,7 and (4) serological detection tests using antibodies such as immunofluorescence (IFA)8 and enzyme-linked immunosorbent assay (ELISA).9 Each method has its own advantages and disadvantages. For example, PCR is considered the most sensitive and specific method but it is expensive, requiring a PCR machine, relatively sophisticated, and requires lengthy procedures, and thus it is not suitable for malaria diagnosis in remote areas. Malaria RDTs, which are based on capture of parasite antigens by monoclonal antibodies incorporated into a test strip, are easy to use but are unable to quantify parasitemia. A review of existing methods indicates that the examination of stained blood smears by light microscopy remains the method of choice for malaria diagnosis because it is inexpensive and has good sensitivity (5–10 parasites/μL of blood).10−12 However, it is labor-intensive, lengthy, and, more importantly, requires skilled and experienced microscopists, which is increasingly burdensome as malaria rates decline with most smears examined being negative.
During the course of its life the malaria parasite passes through several developmental stages including a sexual and an asexual reproductive pathway. The sexual or progeny phase, which occurs within the gut of female Anopheles mosquito, produces numerous infectious forms known as sporozoites that are transferred to the mosquito salivary glands and injected into the human host during a blood meal.13 Sporozoites that enter a blood vessel move to the liver and invade hepatocytes, where they develop into schizonts, each containing tens of thousands of merozoites. The merozoites are subsequently released and invade the erythrocytes initiating the intraerythrocytic asexual phase of the life cycle. The merozoites grow and divide in the food vacuole and progress through three distinct morphological phases known as ring, trophozoite, and schizont stages (Figure 1). Mature-stage parasites adhere to the vascular endothelium and thus only ring-stage parasites are observed in blood smears. The schizonts burst, releasing the merozoites, and the intraerythocytic cycle continues. Instead of replicating, some merozoites in the erythrocytes develop into sexual forms of the parasite, called male and female gametocytes, that are capable of undergoing transmission to mosquitoes. Early-stage gametocytes sequester away from the peripheral circulation but late-stage gametocytes are present in blood smears, and gametocyte carriage underpins endemicity of disease.14 The detection of rings in peripheral blood is critical for early diagnosis and treatment. The detection of low levels of gametocytes in asymptomatic long-term malaria carriers is critical to efforts to eradicate malaria.15
Figure 1.
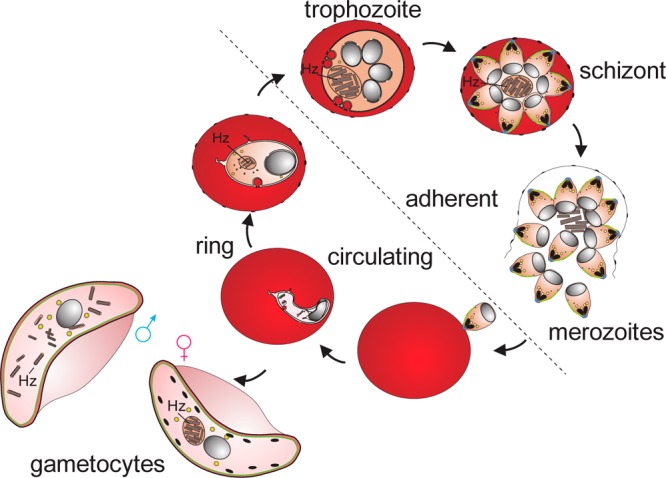
Asexual and sexual phases of the malaria parasite in red blood cells (RBC). Merozoites invade RBCs and develop through ring, trophozoite (growing), and schizont (dividing) stages. Some parasites differentiate to form male and female gametocytes that are capable of transmission to mosquitoes. Digestion of hemoglobin leads to the accumulation of hemozoin (Hz). Only ring-stage parasites and late gametocytes are present in the circulation.
During the intraerythrocytic stages of the parasite’s life cycle, P. falciparum endocytoses packets of host cell cytoplasm, catabolizes the lipids and hemoglobin, and in the process releases free heme, which is toxic to the organism. The malaria parasite has evolved a detoxification pathway that uses the lipid byproducts to catalyze the sequestration of free heme into an insoluble pigment known as hemozoin (Hz). Synchrotron powder diffraction analyses have shown that crystals of Hz (and its synthetic equivalent β-hematin) are composed of a repeating array of iron–carboxylate interacting heme dimers, stabilized by hydrogen-bonding and π–π interactions.12,16,17 Given the parasite-specific nature of the Hz production process, a spectroscopic method that detects hematin (monomeric precursor), Hz, and/or specific associated lipids could provide an alternative and early detection method.
Vibrational spectroscopic techniques have been used extensively in understanding the molecular and electronic structure of β-hematin and Hz; however, their application for malaria diagnostics has not been fully exploited. Raman imaging microscopy has been explored as a potential nonsubjective method to diagnose malaria parasites on the basis of strong scattering from the Hz pigment.18 While the technique has shown potential to detect ring forms of the parasite, the time taken to record an image is on the order of several hours and therefore not applicable in the clinical environment. Webster et al.19 investigated the potential of synchrotron Fourier transform infrared (FT-IR) in combination with principal component analysis (PCA) to differentiate between intraerythrocytic stages of the parasite life cycle based on the molecular signatures of Hz and specific lipids. They found that as the parasite matures from its early ring stage to the trophozoite and finally to the schizont stage, there is an increase in absorbance and shifting of specific lipid bands.19 This work demonstrated the potential of using FT-IR spectroscopy as a diagnostic tool for malaria, but clearly a synchrotron-based method is not suitable for routine laboratory use. Attenuated total reflectance (ATR) spectroscopy offers the advantages of potential portability, is inexpensive, and thus has become a very powerful tool in the analysis of biological cells and tissues.20−22 A recent study23 compared ATR-FT-IR and Raman microscopy for investigating human blood plasma/serum obtained from ovarian cancer patients compared to non-cancer controls. By use of a support vector machine, diagnostic accuracy of 74% was achieved with Raman, while the same classifier showed 93.3% accuracy for ATR-IR spectra of blood plasma, demonstrating the enhanced sensitivity and specificity of the ATR-FT-IR technique.23 In a second study24 by the same group, utilizing ATR-FT-IR to investigate blood plasma from ovarian cancer and endometrial cancer patients, a classification (up to 96.7%) was achieved for the former, whereas for endometrial cancer an accuracy (up to 81.7%) was achieved by use of a support vector machine. It is clear that the ATR-FT-IR approach has tremendous application in disease diagnosis.
Here we show for the first time that ATR-FT-IR spectroscopy, in combination with partial least-squares regression models, has the required ease of sample preparation, sensitivity, and quantification ability to become a laboratory standard for malaria detection and most importantly quantification.
Experimental Methods
The system combines a standard benchtop FT-IR spectrometer and a diamond crystal ATR accessory. The technique utilizes the property of total internal reflection to generate an evanescent wave, which penetrates 2–3 μm into a sample placed in contact with the 2 × 2 mm diamond crystal face with an active area between 1 and 2 mm2, depending on the wavelength, the refractive indices of the crystal and the sample, and the angle of incidence of the infrared beam. An aliquot of packed red blood cells in methanol is placed on the diamond window of the ATR accessory and rapidly dried with a blow dryer (1 min). It is important to note that the methanol is integrally important in obtaining the high sensitivity achieved with the ATR-FT-IR approach (see below). The whole process of sample deposition and spectral recording takes less than 3 min with a single ATR element. An algorithm converts the spectrum into a second derivative to remove baseline offsets and resolve inflection points in the spectral bands. The second-derivative spectrum is then run through a partial least-squares regression model generated by using a calibration set of spectral standards containing mixtures of normal and infected red blood cells at different ratios.
Plasmodium Culture and Gametocyte Enrichment
Plasmodium falciparum parasites (3D7 strain) were maintained as previously described.25 Briefly, parasites were maintained in washed O type human RBCs (Red Cross Blood Bank) and cultured in RPMI-HEPES medium supplemented with 5% human serum and 0.25% Albumax. The washing step removes the leukocytes. Parasites were synchronized to ring stages by sorbitol lysis.26 High parasitemia ring-stage cultures were obtained by seeding uninfected RBCs with purified schizont-stage parasites that were allowed to reinvade under shaking conditions overnight, reducing multiple infections.
Parasitemias were calculated by Giemsa-stained thin blood films; a minimum of 10 fields of view were counted for each culture. Accurate cell counts were obtained for uninfected and parasite-infected RBCs through counting on a hemocytometer. The dilutions were calculated and samples were prepared by diluting parasite-infected cultures with uninfected RBCs to obtain the desired dilution. All dilutions were performed in complete culture medium, and samples were then washed once in 1× phosphate-buffered saline (PBS), prior to fixation with cold methanol (Emparta ACS grade, Merck) on ice (<0 °C) and thorough mixing by pipetting. Samples were stored at 4 °C until analysis.
Parasitemia Series
A series of infected methanol-fixed RBCs with cultured parasites at different stages, including rings, trophozoites, and gametocytes at a range of parasitemia percentages (Table 1), were used to establish the partial least-squares (PLS) calibration models. Uninfected methanol-fixed RBCs were used as the control (0% parasitemia).
Table 1. Parasitemia Percentages of P. falciparum-Infected RBCs at Different Stages.
| intraerythrocytic stages | parasitemia series (%) |
|---|---|
| rings | (a) 0.5, 1, 2.5, 5, 10, 15, 20, 30 |
| rings | (b) 0.01, 1.75, 0.1, 0.08, 0.2, 0.43, 7 |
| rings (2 series) | (c) 0.001, 0.005, 0.01, 0.05, 0.1, 0.5, 1, 3 |
| rings (2 series) | (d) 0.00001, 0.00005, 0.0001, 0.0005, 0.001, 0.01, 0.1, 0.5, 1 |
| trophozoites | 0.5, 1, 2.5, 5, 10, 20, 40, 50, 60, 80 |
| gametocyte | 0.09, 0.3, 0.18, 0.3, 0.75, 1.25, 2.5, 5, 10, 20, 40, 80 |
Equipment and Spectral Data Acquisition for ATR-FT-IR Measurements
A Bruker model Equinox 55 (Bruker Optic, Ettingen, Germany) FT-IR spectrometer fitted with a N2-cooled mercury–cadmium–telluride (MCT) detector and a golden gate diamond ATR accessory (Specac Limited, Orpington, Kent, U.K.) was used for spectral acquisition. The Bruker system was controlled with an IBM-compatible PC running OPUS version 6.0 software. For each sample spectrum, an aliquot (200 μL) of packed fixed cells was placed on the diamond cell and air-dried with a blow dryer. Spectra were collected with a spectral resolution of 8 cm–1 and 32 coadded interferograms ratioed against a clean diamond background. For each sample deposit, 3–5 replicate spectra were recorded to assess precision and ensure the reproducibility of each sample spectrum.
Data Preprocessing
Preprocessing of the spectral data was performed in OPUS (Bruker Optic, Ettingen, Germany) and Unscrambler X (version 10.0.1, Camo Software, Oslo, Norway) software packages. For optimal modeling, raw spectra were vector-normalized and the second derivative was calculated by use of the Savitzky–Golay algorithm with nine smoothing points.
Principal Component Analysis
PCA was performed by use of The Unscrambler (Camo Software, Oslo, Norway) on second derivatives in the CH stretching region (3100–2800 cm–1), by use of the leave-out-one cross-validation approach and Nipal’s algorithm for PCA decomposition. Six PCs were chosen for the initial decomposition and 20 iterations were performed for each PC. Two-dimensional (2D) (PC1 versus PC2) scores plots and the corresponding PC1 and PC2 loading plots were graphed.
Partial Least Squares
PLS was also performed by use of The Unscrambler (Camo Software, Oslo, Norway) on second derivatives in the CH stretching region (3100–2800 cm–1), by use of the leave-out-one prediction approach. Partial least-squares discriminant analysis (PLS-DA) finds a linear regression model by projecting the predicted variables and the observable variables to a new space. A separate column was designated the category variable, which included the percentage parasitemia in this case. The regression plot and associated regression coefficients were plotted. The number of factors in the analysis varied from 6 to 8 latent factors. The number of factors was determined by the “goodness of fit” and analysis of the regression coefficients to ensure that the coefficients were based on real spectral bands and not spurious artifacts.
Results and Discussion
Fixative Selection Study
A preliminary study was carried out to explore the application of ATR-FT-IR spectroscopy in RBCs. The aim was to optimize fixative types and explore spectral variations during storage times. Ethanol, methanol, and formaldehyde fixatives were examined in the study. Methanol proved to be the best fixative for the ATR application because it resulted in more consistent spectra compared to glutaraldehyde and ethanol (over a month of storage) and the cells are easily separated from fixative without centrifugation.
Another advantage of methanol is that it evaporates rapidly under a blow dryer and leaves no chemical residues. Air-drying or fixing cells with glutaraldehyde does not achieve the same sensitivity and accurate quantification. Methanol may also assist in forcing dissolved lipids to the surface of the ATR crystal, especially when under pressure from the sample-clamping device. It is important to note that methanol would dissolve some lipids but not all. Moreover, we do not remove the supernatant when we centrifuge down the cells, so the dissolved lipids would remain in the supernatant and would be mixed with the pellet of lysed cells because of the higher molecular weight of the lipids compared to methanol. We calculate that the ATR method detects lipid residues and Hz deposits from approximately 100 parasites on the ATR diamond crystal face at 0.00001% parasitemia (see Supporting Information).
Spectral Precision/Reproducibility
Replicate spectra (30 in total from 6 sample deposits × 5 spectra/deposit) were obtained from all RBC samples to ensure that representative ATR-FT-IR spectra were collected after the sample was air-dried. After preprocessing (normalization and derivative calculation), statistical tests were performed over the range of replicate spectra (600–4000 cm–1) by use of Unscrambler X software. Descriptive statistics data, including variance and standard deviations, were used to assess the reproducibility of the IR spectra. As an example, replicate spectra (30 replicates) of the control sample showed a mean absorbance variance of 0.0005. This confirmed the applicability of the method used for deposition and drying of the sample deposit on the diamond crystal face and indicated that spectra of the dried sample deposits are robust and reproducible.
Overlaid Average Spectra
Replicate second-derivative spectra from each stage of the parasite’s life cycle at different parasitemia percentages were averaged (by use of the reduced-average option in Unscrambler X software) and overlaid (Figure 2).
Figure 2.
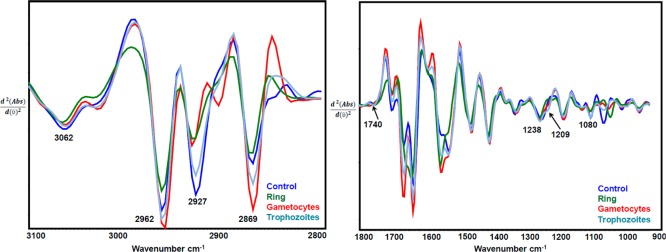
ATR-FT-IR average second-derivative spectra for infected RBCs (ring, trophozoite, and gametocyte stages of parasite) and uninfected RBCs (control) of the C–H stretching region and the Hz band marker range.
Replicate ATR-FT-IR spectra from different stages of parasite-infected RBCs with the highest available parasitemia percentages [i.e., ring (30%), trophozoite (80%), and gametocyte (40%) as well as control (0%) samples] were obtained. Figure 2 shows the averaged second-derivative overlaid spectra of the C–H stretching region (3100–2800 cm–1) as well as the 1800–900 cm–1 region highlighting the important Hz marker bands for infected RBCs from different parasite stages. In the second-derivative spectra, the absorbance maxima become minima; therefore, in Figure 2 the +ve intensities for absorbance spectra become −ve for second-derivative spectra. The CH stretching region (3100–2800 cm–1) is optimally diagnostic for different stages of the parasite as previously shown with synchrotron FT-IR spectroscopy.19 There is also evidence for contributions from nucleic acids, as evidenced by the phosphodiester marker bands including the asymmetric stretch at 1241 cm–1 and the symmetric stretch at 1095 cm–1. The C–O stretching vibration from the propionate group from Hz expected around 1208–1215 cm–1 is observed as a shoulder feature in the second-derivative spectra of trophozoites and to a lesser extent in the gametocytes. In terms of diagnostic capability, use of the CH stretching region was found to achieve higher sensitivity compared to the 1800–950 cm–1 region and a combination of both regions.
Principal Component Analysis
PCA was performed on all the replicate RBC samples from individual stages of the parasite life cycle following spectral data preprocessing. PCA is one of the most powerful exploratory tools for large data-set analysis. PCA reduces the dimensionality of the data set by decomposing the data set into a signal and noise part by finding linear combinations of the original variables. PCA was applied to second-derivative ATR-FT-IR spectra from infected RBCs including the ring trophozoite and gametocyte stages as well as the control samples (uninfected RBCs) with the aim of assessing spectral variance across a subpopulation of cells.
Figure 3a indicates a clear differentiation and sample grouping for the different stages of parasitemia (i.e., R, T, and G) from infected RBCs compared to the control (C) in the C–H stretching region. Ring-stage parasites that are to the right of the scores plot have a large positive PC1 value compared to all other stages, indicating significant differences in the lipid composition compared to the other stages. The linear subgroupings observed in the clusters arise from the fact that a series of concentrations were used as input data into the PCA. In the ring stage, four independent series were included in the PCA model. The loadings plot (Figure 3b) shows a combination CH stretching bands from protein, lipid, and hemozoin and hence the loadings appear broad shifted compared to the expected position of the normal lipid modes.
Figure 3.
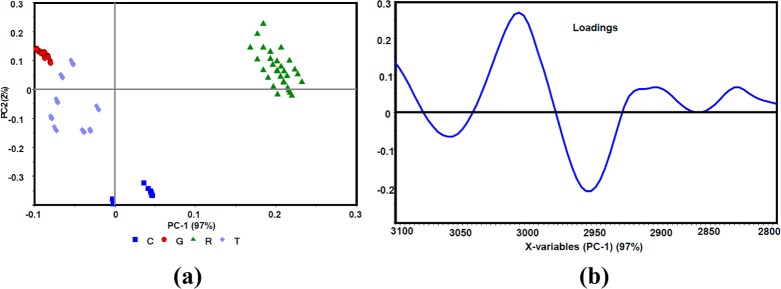
(a) PCA scores plot along PC1 and PC2 of control (C) and ring (R), trophozoite (T), and gametocyte (G) -infected RBC data sets. (b) PC1 correlation loadings plot after a second-derivative function was applied to the C–H stretching region (3100–280 cm–1).
PCA analysis was also applied to the 1800–1000 cm–1 region for all stages where the Hz bands are expected (∼1712, 1664, and 1209 cm–1)19 (data not shown). However, only good rather than excellent separation of trophozoites and gametocytes from the control was achieved. The ring-stage parasites could not be as definitively separated from the other groups when using this spectral window because the rings only have very small amounts of Hz. The definitive separation in the PCA scores plot along with the linearity observed in the subgroupings because of the different percentages of parasitemia demonstrates that the CH stretching region (3100–2800 cm–1) is ideal for PLS prediction models.
ATR-FT-IR Sensitivity in PCA Analysis
In order to examine the sensitivity of ATR-FT-IR to differentiate parasitemia at very low levels, PCA analysis was applied to second-derivative spectra at the lowest percentage parasitemia in each sample series for both rings and trophozoites versus control (as 0%). Figure 4 shows an example of the PCA analysis at 0.00001% parasitemia for rings versus control in the C–H stretching region (3100–2800 cm–1).
Figure 4.
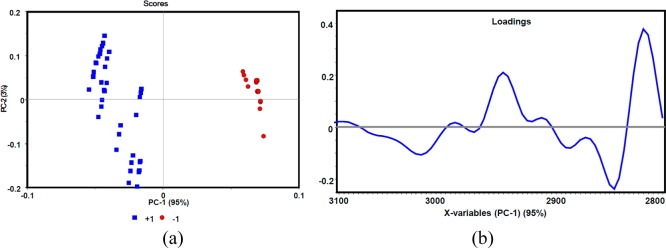
(a) PCA scores plot and (b) PC1 correlation loadings plot along PC1 and PC2 of control 0% (−1) and rings 0.00001% (+1), after a second-derivative function was applied to the C–H stretching region (3100–280 cm–1).
In Figure 4 the scores plot indicates good separation or grouping of rings at 0.00001% parasitemia (the lowest concentration prepared in the ring series) versus control. The loadings plot for PC1 shows strong negative loadings in the lipid band regions of 2854, 2954–2944, 2993, and 3063 cm–1. Similar analysis was also performed for the gametocyte and trophozoite series at 0.09% and 0.5% (the lowest concentrations available), respectively, versus control, which exhibited excellent separation between gametocytes, trophozoites, and controls. The results confirm the ability of ATR-FT-IR to detect parasitemia levels down to 0.00001%. The same type of PCA analysis was performed in the Hz region (1800–900 cm–1); however, no separation was observed, indicating the Hz region is ineffective for diagnosing low levels of parasitemia.
PLS Models
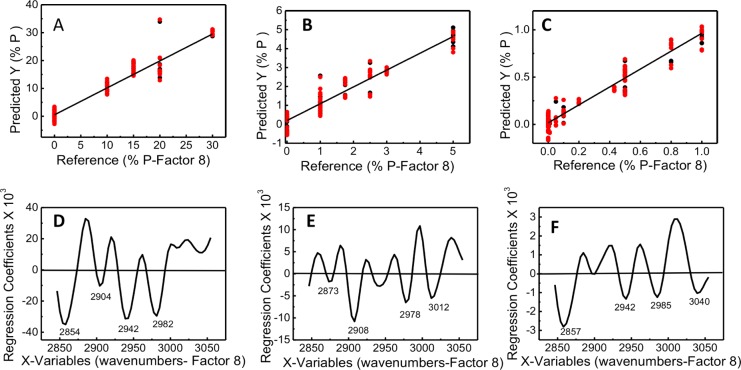
Partial least-squares (PLS) regression is a statistical method that develops a linear regression model by projecting the predicted variable (% parasitemia) and the observable variable (spectra) onto a new multidimensional space. For ring-stage parasitemia, three PLS models were constructed for three ranges of parasitemia (at the ring stage) from three independent trials: namely, model 1 (10–30%), model 2 (0–5%), and model 3 (0–1%) with the lowest detectable parasitemia at 0.00001%. The PLS model is based on a full cross-validation model where one sample is left out and then the parasitemia of that sample is predicted. The corresponding root-mean-square error of validation (RMSEV) and R2 values for each model are 2.50 and 0.94 for model 1, 0.32 and 0.95 for model 2, and 0.07 and 0.95 for model 3. The spectra presented in Figure 5 show an example set of calibration standards for the ring-stage parasites that was used to build the PLS regression model. To generate the final models, we incorporated calibration data from three independent trials. The regression plots for calibration and validation sets are shown in Figure 6, along with the corresponding regression coefficient plots for 8-factors. The maxima and minima bands in the regression coefficient plots show the bands that are important in generating linearity in the model. These correspond to the major bands associated with lipid CH stretching vibrations (Figure 6). Thus, the linearity of the model is based on real spectral changes and not spectral artifacts such as baseline modulations or noise. There is some variation in the intensity of the CH stretching bands in the regression plots (Figure 6D–F) between the various concentration ranges. This variation arises from the gametocytes, which cannot be totally removed from the preparations. As can be seen in Figure 2, the spectra of gametocytes show a very different lipid profile compared to the other stages. This is more evident in the 1–5% range, but nonetheless the regression plots reveal that the regression fit is based primarily on the important CH2 and CH3 stretching vibrations from ring and to a lesser extent the gametocytes. We found the best predictions were obtained when using the lipid CH stretching region (3100–2800 cm–1) as opposed to the 1800–900 cm–1 region, where the majority of bands are present.
Figure 5.
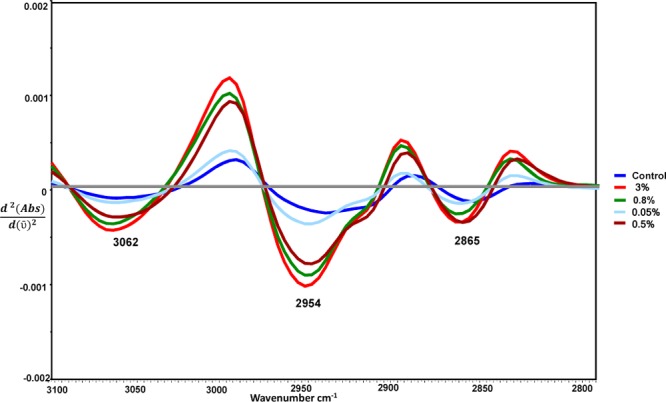
Spectra of overlaid second-derivative spectra, showing the type of data used in generation of calibration models.
Figure 6.
Regression plots for calibration and validation sets for three ranges of early ring-stage parasitemia: (A) model 1 (%) 0, 10, 15, 20, and 30; (B) model 2 (%) 0, 1, 1.75, 2.5, 3, and 5; and (C) model 3 (%) 0, 0.00001, 0.005, 0.01, 0.05, 0.1, 0.2, 0.4, 0.5, 0.8, and 1. Also shown are the corresponding regression coefficient plots (panels D–F, respectively) for 8-factors.
Earlier studies have also reported unique lipids associated with the malaria parasite. Studies have shown that neutral lipids accumulate in the digestive compartment and in neutral lipid bodies during parasite development.27−29 Images of parasites at the ring stage show small Hz crystals surrounded by neutral lipid spheres inside the digestive vacuole, compared to a thinner rim of lipids that surrounds a much larger Hz crystal at the later trophozoite stage.28 Jackson et al.27 demonstrated that neutral lipid bodies contain di- and triacylglycerols and hypothesized that these structures act as storage compartments for lipid byproducts formed by phospholipid digestion in the parasite’s digestive vacuole. The Hz aliphatic and aromatic CH vibrations also contribute to this lipid spectral region, enhancing the overall sensitivity of the technique.
By use of the same method for each series of infected RBCs at different stages and percentages of parasitemia, a range of optimum regression models were obtained for both lipid and Hz band ranges with the minimum number of factors and highest model fitness. Results indicated that spectral preprocessing and removal of outliers improved the correlation coefficient between predicted and measured values at lower factors, which gives the optimized model with minimum error to be considered as the “best” theoretical fit. The results with second derivatives also indicated further improvement because lower factors were required to achieve high correlation coefficients.
In addition to the above final models from large data sets, a summary of the results from optimum PLS models at C–H stretching region on RBCs of different parasitemia series and at different stages of parasitic life cycle is given in Table 2. It summarizes all the prediction models applied to the ATR-FT-IR spectra of ring, trophozoite, and gametocyte series as well as combinations of all the series from different stages of parasitemia after application of data preprocessing to each model. Even for digitally mixed samples—that is, mixing spectra of rings (R), trophozoites (T), gametocytes (G), and controls (C)—an excellent R2 value (0.96–0.97) was achieved for the 0–5% parasitemia range.
Table 2. Summary of Optimum PLS Models at C–H Stretching Region (3100–2800 cm–1) on Parasite Series: Rings, Trophozoites, Gametocytes, Control, and Combined Series.
| P-typea (series) | PLS concn range, % P | range of R2 factor 1–7 | range of RMSEPb factor 1–7 |
|---|---|---|---|
| R (d) | 0–0.0001 | 0.54–0.32 | 0.00025–0.00027 |
| R (d) | 0–0.00005 | 0.83–0.52 | 0.00008–0.000012 |
| R (c) | 0–0.1 | 0.993–0.397 | 0.003–0.028 |
| R (a, b) | 0–5 | 0.99–0.21 | 0.16–1.55 |
| R (c) | 0–7 | 0.970–0.153 | 0.159–0.858 |
| R (c) | 5–10 | 0.991–0.151 | 0.175–1.73 |
| R (a, c) | 0–10 | 0.988–0.32 | 0.36–2.77 |
| R (a) | 5–30 | 0.997–0.56 | 0.46–6.9 |
| R (a) | 10–30 | 0.998–0.55 | 0.45–6.87 |
| T | 0–5 | 0.976–266 | 0.14–1.6 |
| T | 5–20 | 0.999–0.73 | 0.186–0.7 |
| T | 20–80 | 0.995–0.633 | 1.47–11.04 |
| R (a), T, C | 0–80 | 0.86–0.027 | 8.5–22.1 |
| R (a), G, C | 0–5 | 0.989–0.40 | 0.185–1.4 |
| R (a), T, G, C | 0–5 | 0.96–0.97 | 0.17–0.82 |
| G | 0–5 | 0.91–0.155 | 0.5–1.58 |
| G | 10–80 | 0.93–0.25 | 6.12–20.16 |
| G | 0–5 | 0.996–0.13 | 0.09–1.47 |
| G | 0–5 | 0.999–0.3 | 0.3–11.7 |
R, rings; T, trophozoites; G, gametocytes; C, control.
Root mean square error of predictions.
Application of PLS Prediction Models to Unknown/Blind Samples
To assess the applicability and sensitivity of the PLS models, optimized PLS prediction models from low ranges of parasitemia series (0–5%, 0–0.1%, and 5–10%) were used to predict parasitemia concentration of a series of infected RBCs with rings as unknown or blind samples.
Replicate spectra (10–15) of the unknown samples were preprocessed in the same way as the reference samples and used for PLS prediction. PLS models from ring series (with R2> 0.99 and RMSE <0.17) as well as from combined spectra from all series were used for predictions. Figure 7 indicates an example of predictions where ring samples at 7% and 7.4% parasitemia were used as unknown and a PLS model in the range of 5–10% parasitemia was used; the average standard error of the prediction-deviations was 0.08% at factor 1.
Figure 7.

Example of predictions for unknown samples using PLS models in the range of 5–10% with average standard error of prediction of 0.08. Predicted values are shown as horizontal lines, and the boxes around predicted value indicate the deviation.
More ring samples with parasitemia levels in the range of 0–2 were also used as unknowns. The average predicted concentrations of the ring samples were all within 0–2% with average error of 0.2 (Hotelling T2 at 95% confidence limit). Predictions for the unknown samples with <0.1% parasitemia showed an average standard deviation of 0.05.
The reasons for the prediction variation, especially at low parasitemia levels, could be due to (1) varying number of infected cells deposited on the ATR diamond cell that may have caused nonuniformity in lipid distribution in the dried-sample deposits, (2) varying thickness of the lipid deposit at the crystal surface, and (3) error involved in sample preparation (e.g., separation and dilution) and the reference method. Sample uniformity, particle size, and consistency in sample thickness on the diamond cell were found to be the most important factors in obtaining consistent spectral acquisition and error reduction for prediction of unknown samples. The sensitivity of predictions for quantification was found to be 0.2% within 95% confidence limit. It is important to note that the absolute detection limit is 0.00001%, but the actual quantification sensitivity limit is 0.1% with a 0.05 standard deviation.
Conclusion
Here we have demonstrated the potential of ATR FT-IR spectroscopy as an alternative method for rapid detection and quantification of malaria parasite infections. There is no cell counting or chemical treatment other than methanol fixation required, sample preparation is minimal and simple, and the analysis time is reduced to <3 min/sample when a single-chamber ATR device is used. The next phase will see the trial of imaging ATR devices for rapid multiple measurements applied to clinical samples.
Acknowledgments
M.W.A.D. is an NHMRC Early Career Fellow; L.T. is an ARC Australian Professorial Fellow. B.R.W. is supported by Australian Research Council (ARC) Future Fellowship Grant FT120100926. This work is supported by ARC Discovery Grant DP140102504.
Supporting Information Available
Additional text describing calculation of RMSEP and of parasite numbers deposited on active sampling area of ATR cell, . This material is available free of charge via the Internet at http://pubs.acs.org.
The authors declare no competing financial interest.
Supplementary Material
References
- Murray C. J. L.; Rosenfeld L. C.; Lim S. S.; Andrews K. G.; Foreman K. J.; Haring D.; Fullman N.; Naghavi M.; Lozano R.; Lopez A. D. Lancet 2012, 379, 413–431. [DOI] [PubMed] [Google Scholar]
- Chotivanich K.; Silamut K.; Day N. P. J. N. Z. J. Med. Lab. Sci. 2007, 61, 4–7. [Google Scholar]
- Congpuong K.; Bualombai P.; Jitchamroen S.; Konchom S. J. Med. Assoc. Thailand 2001, 84, 357–363. [PubMed] [Google Scholar]
- Wilcox A. Trop. Med. News 1946, 3, 4. [PubMed] [Google Scholar]
- Barber B. E.; William T.; Grigg M. J.; Piera K.; Yeo T. W.; Anstey N. M. J. Clin. Microbiol. 2013, 51, 1118–1123. [DOI] [PMC free article] [PubMed] [Google Scholar]
- Dawoud H.; Ageely H.; Heiba A. J. Egypt. Soc. Parasitol. 2008, 38, 329–338. [PubMed] [Google Scholar]
- Lima G. F.; Levi J. E.; Geraldi M. P.; Sanchez M. C. A.; Segurado A. A.; Hristov A. D.; Inoue J.; Costa-Nascimento M. d. J.; Di Santi S. M. Mem. Inst. Oswaldo Cruz 2011, 106, 691–700. [DOI] [PubMed] [Google Scholar]
- She R. C.; Rawlins M. L.; Mohl R.; Perkins S. L.; Hill H. R.; Litwin C. M. J. Travel Med. 2007, 14, 105–111. [DOI] [PubMed] [Google Scholar]
- Noedl H.; Yingyuen K.; Laoboonchai A.; Fukuda M.; Sirichaisinthop J.; Miller R. S. Am. J. Trop. Med. Hyg. 2006, 75, 1205–1208. [PubMed] [Google Scholar]
- Tangpukdee N.; Duangdee C.; Wilairatana P.; Krudsood S. Korean J. Parasitol. 2009, 47, 93–102. [DOI] [PMC free article] [PubMed] [Google Scholar]
- Rogerson S. J.; Mkundika P.; Kanjala M. K. J. Clin. Microbiol. 2003, 41, 1370–1374. [DOI] [PMC free article] [PubMed] [Google Scholar]
- Butykai A.; Orbán A.; Kocsis V.; Szaller D.; Bordács S.; Tátrai-Szekeres E.; Kiss L.; Bóta A.; Vértessy B.; Zelles T. Sci. Rep. 2013, 3, 1431. [DOI] [PMC free article] [PubMed] [Google Scholar]
- Stiebler R.; Timm B. L.; Oliveira P. L.; Hearne G. R.; Egan T. J.; Oliveira M. F. Insect Biochem. Mol. 2010, 40, 284–292. [DOI] [PubMed] [Google Scholar]
- Greenwood B. M.; Fidock D. A.; Kyle D. E.; Kappe S. H. I.; Alonso P. L.; Collins F. H.; Duffy P. E. J. Clin Invest. 2008, 118, 1266–1276. [DOI] [PMC free article] [PubMed] [Google Scholar]
- Liu J.; Modrek S.; Gosling R. D.; Feachem R. G. A. Lancet 2013, 1, e2–e3. [DOI] [PubMed] [Google Scholar]
- Pagola S.; Stephens P. W.; Bohle D. S.; Kosar A. D.; Madsen S. K. Nature 2000, 404, 307–310. [DOI] [PubMed] [Google Scholar]
- Klonis N.; Dilanian R.; Hanssen E.; Darmanin C.; Streltsov V.; Deed S.; Quiney H.; Tilley L. Biochemistry 2010, 49, 6804–6811. [DOI] [PubMed] [Google Scholar]
- Wood B. R.; Hermelink A.; Lasch P.; Bambery K. R.; Webster G. T.; Khiavi M. A.; Cooke B. M.; Deed S.; Naumann D.; McNaughton D. Analyst 2009, 134, 1119–1125. [DOI] [PubMed] [Google Scholar]
- Webster G. T.; de Villiers K. A.; Egan T. J.; Deed S.; Tilley L.; Tobin M. J.; Bambery K. R.; McNaughton D.; Wood B. R. Anal. Chem. 2009, 81, 2516–2524. [DOI] [PubMed] [Google Scholar]
- Kazarian S. G.; Chan K. Appl. Spectrosc. 2010, 64, 135A–152A. [DOI] [PubMed] [Google Scholar]
- Kazarian S. G.; Chan K. A. Analyst 2013, 138, 1940–1951. [DOI] [PubMed] [Google Scholar]
- Chan K. A.; Kazarian S. G. Analyst 2013, 138, 4040–4047. [DOI] [PubMed] [Google Scholar]
- Owens G. L.; Gajjar K.; Trevisan J.; Fogarty S. W.; Taylor S. E.; Da Gama-Rose B.; Martin-Hirsch P. L.; Martin F. L. J. Biophotonics 2013, 1–10. [DOI] [PubMed] [Google Scholar]
- Gajjar K.; Trevisan J.; Owens G.; Keating P. J.; Wood N. J.; Stringfellow H. F.; Martin-Hirsch P. L.; Martin F. L. Analyst 2013, 138, 3917–3926. [DOI] [PubMed] [Google Scholar]
- Foley M.; Deady L. W.; Ng K.; Cowman A. F.; Tilley L. J. Biol. Chem. 1994, 269, 6955–6961. [PubMed] [Google Scholar]
- Lambros C.; Vanderberg J. P. J. Parasitol. 1979, 65, 418–420. [PubMed] [Google Scholar]
- Jackson K. E.; Klonis N.; Ferguson D. J.; Adisa A.; Dogovski C.; Tilley L. Mol. Microbiol. 2004, 54, 109–122. [DOI] [PubMed] [Google Scholar]
- Pisciotta J.; Coppens I.; Tripathi A.; Scholl P.; Shuman J.; Bajad S.; Shulaev V.; Sullivan D. Biochem. J. 2007, 402, 197–204. [DOI] [PMC free article] [PubMed] [Google Scholar]
- Ambele M. A.; Egan T. J. Malar. J. 2012, 11, 337–350. [DOI] [PMC free article] [PubMed] [Google Scholar]
Associated Data
This section collects any data citations, data availability statements, or supplementary materials included in this article.


