

Abstract
Colorectal adenomas are cancer precursor lesions of the large bowel. A multitude of genomic and epigenomic changes have been documented in these preinvasive lesions, but their impact on the protein effectors of biological function has not been comprehensively explored. Using shotgun quantitative MS, we exhaustively investigated the proteome of 30 colorectal adenomas and paired samples of normal mucosa. Total protein extracts were prepared from these tissues (prospectively collected during colonoscopy) and from normal (HCEC) and cancerous (SW480, SW620, Caco2, HT29, CX1) colon epithelial cell lines. Peptides were labeled with isobaric tags (iTRAQ 8-plex), separated via OFFGEL electrophoresis, and analyzed by means of LC-MS/MS. Nonredundant protein families (4325 in tissues, 2017 in cell lines) were identified and quantified. Principal component analysis of the results clearly distinguished adenomas from normal mucosal samples and cancer cell lines from HCEC cells. Two hundred and twelve proteins displayed significant adenoma-related expression changes (q-value < 0.02, mean fold change versus normal mucosa ±1.4), which correlated (r = 0.74) with similar changes previously identified by our group at the transcriptome level. Fifty-one (∼25%) proteins displayed directionally similar expression changes in colorectal cancer cells (versus HCEC cells) and were therefore attributed to the epithelial component of adenomas. Although benign, adenomas already exhibited cancer-associated proteomic changes: 69 (91%) of the 76 protein up-regulations identified in these lesions have already been reported in cancers. One of the most striking changes involved sorbitol dehydrogenase, a key enzyme in the polyol pathway. Validation studies revealed dramatically increased sorbitol dehydrogenase concentrations and activity in adenomas and cancer cell lines, along with important changes in the expression of other enzymes in the same (AKR1B1) and related (KHK) pathways. Dysregulated polyol metabolism might represent a novel facet of metabolome remodeling associated with tumorigenesis.
Colorectal cancer ranks third among the world's high-incidence cancers and is a leading cause of cancer-related death among older adults (1, 2). In the United States alone, projections for 2013 include 102,480 new cases and 50,830 deaths (2). Cancerogenesis in the large bowel begins with the transformation of the epithelial cell lining of the gut. Molecular alterations, mainly involving the WNT signaling pathway, render these cells hyperproliferative, and they form benign adenomatous tumors. The neoplasms are initially noninvasive (3, 4), and the vast majority remain that way. But as genetic and epigenetic anomalies continue to accumulate, the tumor cells' capacity for invasion and destruction of surrounding tissues increases. At some point, this process drives certain adenomas into the realm of frank malignancy, transforming them into adenocarcinomas.
Early diagnosis of colorectal tumors has been greatly facilitated by screening methods based on fecal analysis or colonoscopy, but both approaches have limitations (5–9). Better understanding of the molecular mechanisms underlying large bowel tumorigenesis could improve our chances of detecting these lesions in the adenomatous or localized adenocarcinomatous stage, when the chances of successful treatment are greater. Promising results for the detection and validation of potential cancer biomarkers are emerging from proteomic studies of cancer development (10). Relative to older gel-electrophoresis-based approaches, shotgun proteomics methods, particularly those that include pre-MS OFFGEL electrophoretic peptide fractionation (11), enhance the sensitivity, robustness, and reproducibility of these studies (12) and expand the proteome coverage to include proteins that are less abundantly expressed (13–16). Furthermore, with the aid of isobaric-tag peptide-labeling strategies, MS can also be used for the relative quantification of protein expression levels within a series of multiple human tissue samples (12, 17–19).
Thus far, only a few MS-based proteomics studies have examined human colorectal adenomas (reviewed in Refs. 9 and 20). We therefore decided to explore the proteome of a relatively large series of these precancerous lesions (each with a paired sample of normal colon mucosa) using quantitative shotgun MS with the widely used iTRAQ1 peptide labeling technique (21, 22) and OFFGEL fractionation. Adenoma-related protein expression variations specific to the epithelial compartments of these lesions were identified with a novel approach, which involved comparing the human tissue proteome with that of colon epithelial cell lines. The results of these studies revealed several protein expression changes previously documented only in advanced colorectal cancers. They also disclosed several novel changes with potentially important roles in early-stage large bowel tumorigenesis, including the marked up-regulation of a key enzyme in the polyol pathway.
EXPERIMENTAL PROCEDURES
Human Tissue Samples and Cell Lines
Human colorectal tissues were prospectively collected from patients undergoing colonoscopy in the Istituti Ospitalieri of Cremona, Italy. Approval was obtained from the local ethics committee, and tissues were used in accordance with the Declaration of Helsinki. Each donor provided written informed consent to sample collection, data analysis, and publication of the findings. Progressive numbers were assigned to each patient to protect human confidentiality. The series comprised 30 colorectal adenomas, each with a paired sample of normal mucosa from the same colon segment, >2 cm from the lesion. Tissues were collected endoscopically, promptly frozen in liquid nitrogen, and stored at −80 °C.
Five colorectal cancer cell lines (HT29, Caco2, CX1, SW480, and SW620) were obtained from the Zurich Cancer Network's Cell Line Repository. All had been recently purchased from the American Tissue Culture Collection (Teddington, UK) and were certified as mycoplasma infection free. We cultured Caco2 and CX1 cells in Dulbecco's modified Eagle's medium; HT29 cells in McCoy's medium; and SW480 and SW620 cells in RPMI 1640 medium supplemented with 10% fetal bovine serum, l-glutamine, and 1% penicillin-streptomycin (Sigma, St. Louis, MO). The recently established line of immortalized human colon epithelial cells (HCEC) was obtained from J. W. Shay and grown as described elsewhere (23).
Protein Extraction from Tissues and Cell Lines
For MS studies, frozen tissue samples were quickly weighed and homogenized on ice (1 min of grinding, 1 min on ice, 1 min of grinding) in a Wheaton glass borosilicate grinder containing a solution of 100 mm triethylammonium bicarbonate (Sigma, St Louis, MO), 1X Complete EDTA-free Protease Inhibitor Mixture (Roche, Mannheim, Germany), 1 m urea, 5 mm β-glycerophosphate disodium salt hydrate, 1 mm sodium orthovanadate, and 5 mm sodium fluoride (Sigma). The efficiency of cell lysis was microscopically confirmed. The homogenates were then sonicated with a Bioruptor (Diagenode, Denville, NJ) (high power, five 10-s/10-s on/off cycles) and centrifuged (16,000g for 5 min at 4 °C). The supernatant containing the proteins was collected and stored at −80 °C.
Cells (grown to >80% confluence in 15-cm2 dishes) were washed in PBS, covered with 250 μl of the buffer used for tissue sample homogenization (see above), detached from the dish with a cell scraper, and homogenized (25 passages through a 25-gauge needle). The efficiency of cell lysis was microscopically confirmed. Sonication and centrifugation were repeated as described above, and the protein concentration was determined via Bradford assay. Prior to MS analysis, a 5-μg sample of each protein extract was subjected to one-dimensional gel electrophoresis on a 12% bisacrylamide gel to assess protein integrity and extraction protocol reproducibility. The entire proteomic workflow, from tissue/cell processing to statistical analysis, is summarized in Fig. 1 and described in detail in the next five subsections.
Fig. 1.

Project design and iTRAQ 8-plex labeling scheme. Sample preparation for shotgun MS/MS and important steps in the analysis of proteomic data for the detection of dysregulated proteins in adenomas and colon cancer cell lines. For each experiment on tissue samples, iTRAQ tags were assigned to a duplicate reference (two identical pools of normal and adenoma samples: 113 and 114, respectively), normal tissues (115, 117, 119) and corresponding adenomas (116, 118, 121). The same pattern was repeated in all 10 experiments. In cell line experiments, two identical pools, each comprising all six cell lines, were used as references (113 and 114), and each of the remaining six tags was used to label a single cell line. The data analysis flow chart depicted in this figure is described in “Experimental Procedures.”
For sorbitol dehydrogenase (SORD) assays (see below), >80% confluent cells were washed in PBS and covered with a solution consisting of 100 mm triethanolamine (Sigma) and 1X Complete EDTA-free Protease Inhibitor Mixture (Roche). (A simple buffer was used to reduce the risk of introducing anti-enzymatic substances into our extract.) Cells were then scraped and homogenized with 25 passages through a 25-gauge needle. Tissue samples were weighed and homogenized in a Wheaton glass borosilicate grinder containing the buffer described above. After centrifugation (16,000 g, 4 °C, 5 min), the supernatant was aliquoted and stored at −80 °C. Protein concentration was measured via Bradford assay.
Protein Digestion and iTRAQ 8-plex Labeling
iTRAQ 8-plex experiments were performed to analyze tissue extracts (10 experiments) and cell-line extracts (1 experiment) (Fig. 1). Labeling efficiency and relative quantitation accuracy were assessed with the aid of two reference protein extract mixtures: one for tissue samples (pooled extracts from three normal tissues and three adenomas) and one for cell lines (pooled aliquots of each of the six cell line extracts). Fifty micrograms of protein per sample were used for each iTRAQ channel. Tryptic digestion (10% w/w, sequencing-grade modified trypsin, Promega, Madison, WI) and iTRAQ 8-plex labeling (AB Sciex, Framingham, MA) were performed according to the manufacturers' instructions (2.5-h incubation of samples with iTRAQ labels). For tissue experiments, two iTRAQ labels, 113 and 114, were chosen for the reference mixture, and labels 115/116, 117/118, and 119/121 were used for the three pairs of normal/adenomatous tissues included in each experiment. For the cell line experiment, labels 113 and 114 were used for the reference mixture, and labels 115–121 represented HCEC, HT29, Caco2, CX1, SW480, and SW620 cells, respectively (Fig. 1). After iTRAQ labeling, the samples (for each experiment) were combined, desalted on 500-mg SepPak C18 columns (Millipore, Billerica, MA), dried in a SpeedVac concentrator (Thermo Scientific), and subjected to peptide fractionation.
OFFGEL Electrophoresis
Peptide fractionation was performed according to the manufacturer's protocols with an Agilent 3100 OFFGEL fractionator and 12-well OFFGEL kit (both from Agilent Technologies, Santa Clara, CA). Briefly, samples were resolubilized in 1.8 ml of 1X OFFGEL peptide stock solution containing carrier ampholytes (pH range 3–10), loaded into the wells (150 μl per well), and focused until 20 kV/h was reached with a maximum current of 50 μA. For each experiment, 12 fractions were collected. A 15-μl aliquot of each fraction was acidified with 1.5 μl of a 50% acetonitrile/1% trifluoroacetic acid solution, desalted using ZipTip C18 (Millipore, Billerica, MA), dried, resolubilized in 15 μl of a 0.1% formic acid/3% acetonitrile solution, and analyzed with MS.
Liquid Chromatography and Mass Spectrometry
Peptide samples (4 μl) were analyzed on an LTQ-Orbitrap Velos mass spectrometer (Thermo Fischer Scientific, Bremen, Germany) coupled to a nano-HPLC system (Eksigent Technologies, Dublin, CA). The solvent compositions were 0.2% formic acid and 1% acetonitrile for channel A and 0.2% formic acid and 80% acetonitrile for channel B. Peptides were loaded onto an in-house-made tip column (75 μm × 80 mm) packed with reverse-phase C18 material (AQ, 3 μm, 200 Å, Bischoff GmbH, Leonberg, Germany) and eluted (flow rate, 250 nL/min; solvent B gradient: from 3% to 30% in 62 min, from 30% to 45% in 70 min, and from 45% to 97% in 75 min).
Full-scan MS spectra (300–1700 m/z) were acquired at a resolution setting of 30,000 at 400 m/z after accumulation to a target value of 1 × 10⁶. For the eight most intense signals per cycle above a threshold of 1000, both collision-induced dissociation and higher-energy collisional dissociation spectra were acquired in a data-dependent manner (Fig. 1). Collision-induced dissociation scans were recorded in the ion trap (settings: normalized collision energy, 35; maximum injection time, 50 ms; automatic gain control, 1 × 10⁴ ions). For the higher-energy collisional dissociation scans, spectra were recorded at a resolution setting of 7500 at 400 m/z (normalized collision energy, 52; maximum injection time, 125 ms; automatic gain control, 5 × 10⁴ ions). Charge state screening was enabled, and singly charged states were rejected. Precursor masses previously selected for MS/MS were excluded from further selection for 60 s, and the exclusion window was set at 10 ppm. The maximum number of entries in the exclusion list was set at 500. All samples were analyzed in duplicate, and precursors selected in the first run were excluded from fragmentation in the second run. The exclusion list was set on a time window of 4 min and a mass width of 10 ppm. Spectra were acquired using internal lock mass calibration on m/z 429.088735 and 445.120025.
Peak List Generation and Database Search
As depicted in Fig. 1, Mascot Distiller 2.4.3.3 (Matrix Science, Boston, MA) was used to generate Mascot generic format peak lists. De-isotoping and peak picking were not performed between 112.5 and 121.5 m/z (the range containing iTRAQ reporter ions), and the higher-energy collisional dissociation and collision-induced dissociation spectra were merged by summing. For each of the 11 experiments, the corresponding 24 Mascot generic format peak lists were concatenated and searched, with the aid of Mascot Server 2.3.02 (Matrix Science), against a forward UniProtKB/Swiss-Prot database for human proteins concatenated to a reversed decoyed FASTA database. The concatenated database contained a total of 147,438 proteins with accessions in Gene Ontology–compatible format and 260 common MS contaminants (NCBI taxonomy I.D. 9606, released December 13, 2011).
Methylthio (C), iTRAQ 8-plex labeling at the N terminus and lysine were set as fixed modifications, and variable modifications consisted of methionine oxidation and iTRAQ 8-plex labeling of tyrosine. We used the iTRAQ 8-plex-vs114 (Applied Biosystems Zug, Switzerland) quantitation method. The isotope and impurity correction factors used for each iTRAQ label were those provided by the manufacturer. Precursor and fragment tolerances were set at 10 ppm and 0.8 Da, respectively. The enzyme specificity was set to trypsin with an allowance of up to one missed cleavage. Using Mascot internal export scripts, we transformed Mascot DAT files into XML files and parsed them with in-house scripts so that peptide sequences, scores, and intensities of the individual reporter ion channels were reported. Confidently identified and quantified peptides were selected with the following filters: rank 1 (best spectra assignment); ion score, > 15; and presence of iTRAQ intensity values for reporter channels 113 and 114.
Quantification of Relative Protein Abundance
(These steps are described in the boxes of the lower half of Fig. 1.) Peptide reporter channel intensities were summed for each protein individually using R-scripts. Ratios were built from summed channels (113/114 to 121/114) for all proteins identified in each iTRAQ experiment. False discovery rates (FDRs) (24) were determined at the spectrum, peptide, and protein levels. The results of individual experiments were then merged into one matrix, which was used for statistical analysis in R and Perseus (Version 1.2.7.4). All proteins identified with the same peptide(s) were grouped into families, each of which was identified by a unique protein family number. Ratios of the intensity of each ion channel to that of 114 were converted to base 2 logarithmic values and normalized respectively on the median (which was set at 0), resulting in ratios that followed a Gaussian distribution. Proteins identified on the basis of the same peptide(s) shared the same family number and were represented once in our statistical analysis. The paired t test was used to compare the expression of a given protein in each adenoma and that found in the corresponding sample of normal mucosa. To correct for multiple comparisons, the FDR was controlled with the Benjamini–Hochberg procedure. The average protein-expression fold change in adenomas, relative to the normal mucosa, was then calculated. For this, median normalized ratios for all proteins in each paired adenoma–normal mucosa sample were deconvoluted of the reference standard effects (114) to compute the adenoma versus normal mucosa ratio per protein (deconvoluted fold change, (116/114)/(115/114) = (116/115)) and the mean fold change per protein in all tissue pairs. The Mascot emPAI values for all proteins were included in XML exports for each experiment. Thereafter, the mean Mascot emPAI value was calculated for all proteins.
Functional Annotation of Proteins
Gene Ontology (GO) annotations and GO terms for proteins in the UniProt/Swiss-Prot database were sourced from the European Bioinformatics Institute. The Scaffold program (Version 3) was used to identify the cellular localizations and biological processes most represented in lists of proteins quantified in tissues and cell lines. The topGO Bioconductor software package in R was used to identify and screen for GO biological process categories displaying enrichment for proteins that were differentially regulated in adenomas (versus normal mucosa) (25). First, we prepared a “universe” comprising all the proteins quantified in our study, each matched to GO terms and annotations. This served as the “background.” The “foreground” consisted of the list of significantly dysregulated proteins. The most significant GO terms were scored with the Eliminating Genes (elim) method (25).
Western Blotting
Proteins were separated on a 10% SDS-polyacrylamide gel and transferred to a hydrophobic polyvinylidene difluoride membrane (GE Healthcare, Amersham Biosciences Hybond-P PVDF membrane, Pittsburgh, PA) according to standard protocols (26). After 1 h of blocking with 5% nonfat dry milk in TBS with 1% Tween 20 (milk–TBST), membranes were incubated overnight with the primary antibody (anti-SORD (HPA040260, Sigma); anti-aldose reductase, AKR1B1 (GTX113381, GeneTex, Irvine, CA); anti-ketohexokinase, KHK (GTX109591, GeneTex)) diluted 1:1000 in milk–TBST and washed once with milk–TBST (20 min) and twice with TBST (20 min). After 1 h of incubation in horseradish-peroxidase-conjugated secondary antibody (anti-rabbit IgG, GE Healthcare) diluted 1:5000 in milk–TBST, membranes were washed once with milk (20 min) and twice with TBST (20 min). Enhanced chemiluminescence (Amersham Biosciences, catalog no. RPN2106) was used to detect immunoreactive proteins.
Immunostaining of Cells and Tissues
HT29 and HCEC cells were seeded (3 × 10⁵ per well) on 22-mm × 22-mm cover slips in six-well plates and grown under standard conditions until cells reached 70% to 80% confluence. Cells were then washed twice with PBS and fixed in ethanol:methanol solution (50:50) for 10 min at room temperature. Fixed cells were permeabilized (10 min with 0.25% Triton X-100), blocked (30 min in 10% goat serum (X0907, Dako, Glostrup, Denmark)), and incubated with primary antibody (rabbit polyclonal anti-SORD, HPA040260, Sigma, 1:100) for 18 h at 4 °C. After three washes with PBS, the cells were incubated for 1 h with secondary antibody conjugated to polymer-HRP anti-rabbit (Dako, EnVision+ System-HRP, catalog no. K4010). They were then washed three times in PBS and incubated for 15 min in the substrate-chromogen 3,3-diaminobenzidine tetrahydrochloride (Dako, EnVision+ System-HRP, catalog no. K4010). Cells were washed quickly with PBS and mounted on slides (EUKITT, O. Kindler, GmbH, Freiburg, Germany) for light microscopy (Leica Microsystems GmbH, Wetzlar, Germany). Images were examined and recorded with Leica Application Suite (V3.3.0) software.
SORD immunohistochemistry was performed as previously described (27). Tissue sections (normal colon and ileum, colorectal adenomas, and adenocarcinomas) were incubated for 24 h at 4 °C with primary antibody (rabbit polyclonal anti-SORD, HPA040261, Sigma) at a 1:100 dilution.
Measurement of SORD Activity
Total protein was extracted from cell lines and tissues as described above. SORD catalyzes the reversible conversion of d-sorbitol to d-fructose, with β-NADH as a cofactor.
 |
SORD activity was quantified via continuous spectrophotometric rate measurement of the β-NAD formation rate (temperature 25 °C, pH 7.6, A340, light path of 1 cm) in a Cary 50 Scan UV-visible spectrophotometer using the Cary Kinetics Application (both from Varian Inc., Palo Alto, CA) (28). The final reagent concentrations in a 1-ml cuvette were as follows: 78.33 mm triethonolamine, 183 mm d-fructose, 0.21 mm β-NADH, 0.033% (w/v) BSA. The absorbance reading was recorded when the enzyme was added. One unit of enzyme activity was defined as the amount of enzyme required per minute to convert 1.0 μm d-fructose to d-sorbitol at pH 7.6 at 25 °C. A mixture of reagents plus recombinant SORD was used as the positive control; negative controls consisted of the same reagent mixture with no recombinant SORD, with recombinant SORD but no d-fructose, or with recombinant SORD but no β-NADH.
Extraction and Quantification of Intracellular Metabolites by Targeted Gas Chromatography Coupled with MS
Frozen tissue (50 to 100 mg) was homogenized in 250 μl of ice-cold 80% methanol using a glass borosilicate grinder from Wheaton (Rockdale, UK). The homogenate was microscopically examined to ensure that it was cell free, and then it was transferred to Eppendorf vials and left on ice for 15 min to ensure efficient protein precipitation. After centrifugation (15,000g for 3 min at 0 °C), the supernatant was snap-frozen and stored at −80 °C, and the protein content of the pellet was determined via the Bradford method.
For gas chromatography coupled with MS (GC-TOF-MS), 10 μl of supernatant was transferred to a 1.5-ml Eppendorf tube, and internal standards (13C1-sorbitol, 13C1-fructose, and 13C1-glucose; 1.2 pm of each) were added. The samples were then dried overnight in a vacuum centrifuge (Concentrator 5301, Eppendorf AG, Wesseling-Berzdorf, Germany). Methoxyamine hydrochloride and N-methyl-N-(trimethylsilyl)trifluoroecetamide were used as derivatization reagents (29).
The derivatized metabolites and internal standards were subjected to GC-TOF-MS (GC 7890A, Agilent Technologies, Santa Clara, CA; GCT Premier Micromass, Waters, Manchester, UK) with an Rxi-5Sil MS Integra-Guard column (length, 30 m; internal diameter, 0.25 mm) and a film thickness of 0.25 μm (Restek, Bellafonte, PA). One microliter of each derivatized sample was injected in splitless mode on a baffled glass liner and transferred to the capillary column by rapid heating of the liner from 50 °C to 250 °C at a rate of 12 °C/s. For the separation of the metabolites, helium was used at a flow rate of 1 ml/min, and after an initial hold time of 2 min, a temperature gradient from 80 °C to 320 °C (rate = 8 °C/min) was applied. The TOF-MS was set to acquire centroided standard electron ionization mass spectra over a range of 50 to 600 m/z at a rate of three spectra per second. The GC-MS transfer line was heated to 280 °C. Dynamic range enhancement was activated. C6ClF5 was used as lock mass compound.
The MassLynx and QuanLynx programs (Waters, UK) were used to review and analyze the acquired data. The absolute concentrations of d-sorbitol, α and β d-fructose, and α and β d-glucose were calculated on the basis of the ratio of the intensity of specific fragments originating from the unlabeled compound to that of the added labeled analog (internal standard). These concentrations were used to estimate intracellular levels per milligram of tissue (adenoma versus normal mucosa). The relative concentration of lactate was estimated from the ratio of the intensity of specific fragments originating from the unlabeled compound to that of the added 13C1-sorbitol (internal standard).
RESULTS
Proteomic Analysis of Human Colorectal Tissues and Colon Cell Lines
We used a quantitative-MS-based discovery strategy to explore the proteome of human colorectal tissues and colon cell lines (normal and neoplastic). The characteristics of the precancerous colorectal lesions are listed in Table I. Protein extracts from these tumors and their paired samples of normal mucosa (60 samples total) were analyzed using iTRAQ LC-MS/MS and the workflow described in Fig. 1. The inclusion of two reference sample mixes allowed us to control for technical variability across the 10 experiments on tissue samples, as the reference sample was analyzed twice in each experiment. OFFGEL electrophoresis was used to obtain highly reproducible, pI-based, in-solution separation of pooled iTRAQ-labeled peptides. Furthermore, for relative quantification of proteins using iTRAQ reporter ions, we adopted a stringent FDR for peptide spectra matches (PSMs), and high-confidence peptides for protein quantification were selected only if the reporter ions (113 and 114) were quantified in the reference sample mix (iTRAQ reporter channels 113 and 114). The dataset generated with this approach was large and complex, but we developed a simplified analytical method that allowed us to work with and merge the large data files generated after MS/MS (Fig. 1). High-resolution MS/MS spectra acquired on the LTQ-Orbitrap Velos spectrometer after duplicate analysis of OFFGEL tissue sample fractions produced a total of 240 raw files (10 experiments, 120 fractions, 2 replicates). A total of 37,184 (FDR = 0.9%) unique tryptic peptides were confidently identified and quantified from 285,929 unique PSMs (FDR = 0.2%) (Table II, supplemental Table S1). Ten thousand four hundred and fifty-two proteins (FDR = 1.5%) were assembled from the quantified peptides. Proteins that were indistinguishable in MS/MS (i.e. two or more proteins identified on the basis of the same peptide sequence; see “Experimental Procedures” for details) were represented as a single family. The result was a total of 4325 nonredundant protein families, two-thirds (2865, 66%) of which were relatively quantified in at least 9 normal mucosa–adenoma pairs, and 1072 (25%) in all 30 pairs (Table II, supplemental Table S1).
Table I. Characteristics of the precancerous colorectal lesions included in the study.
| Patient number | Age | Sex | Colon segment involved | Maximum lesion diameter (mm) | Paris classificationa | Pit pattern classificationb | Microscopic appearance | Highest degree of dysplasia in the lesionc | Number of lesions at study colonoscopyd | Number of previously excised lesions |
|---|---|---|---|---|---|---|---|---|---|---|
| 1 | 77 | M | S | 25 | IIa+IIc | IIIs-IIIL | TA | LGD | 1 | 0 |
| 2 | 73 | F | A | 25 | IIa+IIc | IIIs-IIIL | TA | LGD | 1 | 2 |
| 3 | 59 | M | T | 30 | IIa+IIc | IIIs+IIIL | TA | LGD | 1 | 0 |
| 4 | 73 | F | R | 50 | Is | IV | VA | LGD | 1 | 0 |
| 5 | 74 | M | R | 40 | Is | IV | VA | HGD | 2 | 1 |
| 6 | 77 | M | C | 25 | IIa | IIIL | VA | LGD | 1 | 0 |
| 7 | 80 | M | A | 40 | IIa | IIIL | TVA | LGD | 1 | 1 |
| 8 | 82 | M | A | 15 | IIa | IIIL | VA | LGD | 2 | 0 |
| 9 | 73 | F | S | 20 | Ip | IV | TVA | LGD | 1 | 0 |
| 10 | 70 | F | C | 25 | IIa | IIIL | TVA | LGD | 2 | 0 |
| 11 | 63 | M | A | 45 | Is | IIIL-IV | TVA | LGD | 0 | 0 |
| 12 | 68 | M | A | 30 | IIa+Is | IIIL-IV | TVA | HGD | 0 | 0 |
| 13 | 60 | M | D | 30 | Is | IV-Vi | TVA | HGD | 0 | 0 |
| 14 | 55 | M | C | 25 | IIa+Is | IIIL-IV | SSA | LGD | 0 | 0 |
| 15 | 70 | M | A | 15 | Is | IV | TVA | LGD | 7 | 0 |
| 16 | 85 | F | S | 25 | Is+IIa | IV | TA | LGD | 1 | 1 |
| 17 | 66 | M | A | 30 | IIa | IIIL | TA | HGD | 2 | 0 |
| 18 | 72 | M | A | 30 | Is | IV | TVA | HGD | 2 | 0 |
| 19 | 71 | M | S | 30 | IIa | IIIL | TVA | LGD | 2 | 0 |
| 20 | 59 | M | R | 60 | Is | IV-Vi | TVA | HGD | 1 | 0 |
| 21 | 78 | M | A | 50 | Is | IV-Vi | TA | LGD | 1 | 0 |
| 22 | 75 | M | R | 25 | Is | IV-Vn | TVA | HGD | 6 | 0 |
| 23 | 73 | F | D | 25 | Is | IV | TA | LGD | 1 | 0 |
| 24 | 69 | F | R | 90 | Is+IIa | IV | TVA | LGD | 1 | 0 |
| 25 | 75 | M | T | 18 | IIa | IIIL | TA | LGD | 1 | 0 |
| 26 | 61 | M | A | 40 | Is+IIa | IV | TVA | LGD | 20 | 0 |
| 27 | 76 | M | S | 30 | Is | IV-Vi | TA | HGD | 1 | 0 |
| 28 | 78 | F | R | 60 | IIa+Is | IV | TVA | LGD | 1 | 1 |
| 29 | 89 | M | R | 30 | Is | IV | TA | LGD | 3 | 0 |
| 30 | 75 | M | A | 50 | Is | IV-Vn | TVA | HGD/cancer | 7 | 0 |
Abbreviations: M, male; F, female; C, cecum; A, ascending colon; T, transverse colon; D, descending colon; S, sigmoid colon; R, rectum; TA, tubular adenoma; TVA, tubulovillous adenoma; VA, villous adenoma; SSA, sessile serrated adenoma; LGD, low-grade dysplasia; HGD, high-grade dysplasia.
a Macroscopic appearance of neoplastic lesions was classified according to the Paris Endoscopic Classification of Superficial Neoplastic Lesions (Gastrointest. Endosc. 2003;58(Suppl.):S3–S27).
b Morphological analysis of colon crypt patterns according to the Kudo classification (82).
c Low-grade versus high-grade dysplasia as defined by the World Health Organization classification of tumors of the digestive system at the editorial and consensus conference in Lyon, France, November 6–9, 1999.
d This number includes the lesion included in our proteomic study.
Table II. Summary of proteomics data.
| Tissues (n = 60) |
Cell lines (n = 6) |
|||
|---|---|---|---|---|
| Total | FDR (%) | Total | FDR (%) | |
| Peptide spectra matches | 285,929 | 0.2 | 27,922 | 0.4 |
| Peptides | 37,184 | 0.9 | 11,266 | 0.5 |
| Proteinsa | 10,452 | 1.5 | 5056 | 1.1 |
| Proteinsb | 4325 | - | 2017 | - |
| Proteinsc | 1072 | - | 1957 | - |
a Total number of proteins quantified in the 10 tissue experiments and the single experiment with cell lines.
b Nonredundant protein families quantified in our dataset.
c Nonredundant protein families quantified in all 60 tissues or in all six cell lines.
To verify the efficiency of iTRAQ protein labeling, we repeated the database search with methylthio (C) set as a fixed modification and iTRAQ 8-plex (N-term), iTRAQ 8-plex (K), iTRAQ 8-plex (Y), and oxidation (M) set as variable modifications. (All other search parameters were unchanged.) The assigned PSMs were filtered, as described in “Experimental Procedures,” and the average iTRAQ labeling efficiency achieved in each of the 10 tissue experiments was 96% (supplemental Table S2). To ascertain the efficacy of including a standard sample mix as a reference for normalization, we compared combined Gaussian plots of log2-protein ratios of normal mucosa or adenoma samples with the respective reference channel per experiment (e.g. 115/114 versus 113/114 for normal tissues, 116/114 versus 113/114 for adenomas; see Fig. 1). The ratios displayed normal distributions in all channels. For the reference channel (113/114), log2-ratios were largely centered on 0, whereas the distribution of adenoma and normal channel log2-ratios was broader and not always centered at 0 (data not shown).
Sample complexity is a common problem in the analysis of proteomic data from human colorectal tissues. It stems in part from contamination of the epithelial cell proteome by proteins from stromal cells (which were inevitably present in our specimens, even though the endoscopic tissue sampling procedure we used yielded superficial specimens with consistently high epithelial contents). Microdissection can be utilized to isolate subpopulations of cells, but it can diminish the quantity and quality of the proteins, rendering them suboptimal for some types of proteomic analysis. To avoid this problem, we adopted a novel strategy for preliminary identification of the proteomic alterations that were most likely to involve the epithelial-cell component of the adenomas. The proteomic profiles of the colon tissues were compared with those of six colon epithelial cell lines (five colon cancer cell lines plus HCEC cells, to our knowledge the only well-characterized line established from normal colorectal epithelium (23)). Changes in expression levels observed in adenomas (i.e. up-regulation or down-regulation with respect to normal mucosal levels) were presumed to be epithelial-cell-specific if similar changes were found in the colon cancer cell lines (relative to HCEC cells). After OFFGEL fractionation, duplicate MS analysis of iTRAQ-labeled peptides (24 fractions) from the six cell lines was performed in an LTQ-Orbitrap Velos mass spectrometer, and 11,266 peptides (FDR = 0.5%) were confidently identified and quantified from 27,922 unique PSMs (FDR = 0.4%) (Table II, supplemental Table S3). A total of 2017 nonredundant protein families (FDR = 1.1%) were identified and relatively quantified in cell lines; 1957 (97%) were present in all six cell lines (Table II). In the iTRAQ experiment with cell lines, the peptide labeling efficiency was 95% (supplemental Table S2).
Relative Quantification of the Proteomes of Colorectal Tissues and Cell Lines
The concentration range for proteins expressed in human tissues spans 10 orders of magnitude. We chose not to deplete our protein samples of high-abundance proteins (e.g. albumin, IgG), because with the number of tissue samples being analyzed, additional sample preparation steps were considered potential sources of confounding variability (30). As an alternative, each of the 10 pooled iTRAQ-labeled samples (10 experiments) was separated into 12 fractions based on the isoelectric point of peptides, reducing the complexity of our protein matrix and limiting the risk of bias toward the more abundant proteins.
The expression levels of the 4325 nonredundant protein families we were able to relatively quantify in colorectal tissues spanned 4 orders of magnitude, as deduced from the protein Mascot emPAI value (used as a proxy for the emPAI value (31) to estimate protein concentrations) (Fig. 2A). Thirty percent (1304/4325) of these families were relatively quantified on the basis of more than one unique peptide. At the top of this list were the large proteins AHNAK, DYNC1H1, DSP, and FCGBP (Fig. 2B). In colon epithelial cell lines, 1174 of the 2017 protein families were relatively quantified with more than one unique peptide.
Fig. 2.

Protein coverage with iTRAQ shotgun analysis in colorectal tissues. A, analysis of Mascot emPAI values (used as a proxy for emPAI values) revealed a dynamic range of protein abundance in tissues that spanned 4 orders of magnitude (y-axis) and corresponded with known abundance estimates for various proteins in these tissues. The high/moderate-abundance proteins (e.g. ACTB, FABP5, CHGA) and low-abundance protein (e.g. POLR3A) relatively quantified in our samples are highlighted relative to their mean Mascot emPAI value. B, distribution of reported abundance ranges for the proteins with at least one unique peptide identified in tissues, and the high-molecular-weight proteins with the greatest number of unique peptides identified. Subcellular localizations of the proteins identified in colorectal tissues and cell lines (C) and biological processes in which these proteins are involved (D). This analysis was performed using Scaffold and Gene Ontology annotations (see “Experimental Procedures”).
Gene Ontology Annotation in Scaffold was used to identify the subcellular localizations of these protein families and the biological processes they were involved in. The GO categories represented in the tissue and cell line proteomes were fairly similar. In the cell line proteome, however, the categories generally contained fewer proteins, as the total number of proteins detected in these cells was less than that in the tissues (Fig. 2C). Cytoplasmic and organelle- or membrane-associated proteins were the most highly represented categories in our extracts, but nuclear proteins were also readily identified, which indicates that our protein extraction procedure was not strongly biased toward a few cell compartments. The most highly represented biological processes in the tissue proteome were metabolic or biosynthetic processes, whereas cell component organization and developmental processes predominated in the cell line proteome (Fig. 2D). Stromal contamination was probably responsible for the increased representation of immune system processes in the tissue proteome (relative to that of the cell lines).
Log2-expression levels of the protein families identified in all tissues (n = 1072) and cell lines (n = 1957) (Table II) were subjected to principal component analysis, which easily distinguished the adenomas from the normal mucosa samples (Fig. 3A) and the five colon cancer cell lines from the immortalized normal colon epithelial cell line HCEC (Fig. 3B). The cancer cell lines were also segregated into three distinct groups reflecting their patient origins (Fig. 3B). When principal component analysis was performed on the expression intensity values of the 1496 nonredundant proteins expressed and quantified in all tissues and cell lines (i.e. those representing the intersection of the tissue (n = 10,452) and cell line (n = 5056) protein sets reported in Table II), colon cancer cell lines clustered with adenomas, whereas HCEC cells were closer to the normal mucosa samples (Fig. 3C).
Fig. 3.

Principal component analysis of protein expression. Three-dimensional principal component analysis score plot of log2 protein expression intensity values for (A) tissues (normal mucosa, black; adenomas, red), (B) cell lines (HCEC, cyan; colon cancer cell lines, green), and (C) both. The first three principal components (PCs) account for 40%, 82%, and 36% of the total variance in the tissue, cell line, and tissue + cell line sets, respectively. PC1, the main direction of spread in the three groupings, reflects intergroup variance based on tissue or cell line type (i.e. normal/immortalized versus tumorous). Cell lines derived from the same patient: *SW480 and SW620 cells; ^HT29 and CX1 cells.
As a quality control measure, data for the 60 tissue samples (1072 protein families) were subjected to hierarchical clustering analysis. As shown in supplemental Fig. S1, three main clusters emerged: one consisting almost exclusively of normal mucosa samples, a second containing mainly adenomas, and a third that included both tissue types. The 18 samples in the third cluster (nine adenoma–normal mucosa pairs) formed three subclusters, which corresponded to 3 of the 10 experiments for which trypsin digestion, iTRAQ labeling, and LC-MS/MS were performed on the same day. These findings were suggestive of an experimental bias. Indeed, when these 18 potentially substandard samples were included in subsequent statistical analyses, they diminished the stringency of our threshold and increased the error margin for false identification. We therefore excluded these samples from the analyses described in the following section.
Proteins Displaying Dysregulated Expression in Colorectal Adenomas and Colon Cell Lines
To identify proteins with significantly altered expression in adenomas (relative to normal mucosa), we analyzed data on the proteins quantified in the remaining 21 tissue pairs. The experimentally derived protein fold-change threshold defining differential expression was based on comparison of the distributions of average intensity log2 ratios in the reference standard (113 versus 114, seven experiments) and in patient samples (adenoma versus normal, seven experiments). The average ratios in the reference sample were centered on 1 (i.e. log2 0). Average fold-change ratios for the tissue samples displayed wider variance (supplemental Fig. S2). Seventeen percent of the log2 ratios for the tissue samples exceeded ±0.5 log2 scale (indicating a linear fold change ≥ ±1.4), as opposed to only 5% of those for the reference samples. For each protein, a paired t test was used to compare the intensity ratios in normal and adenomatous samples (i.e. normal/114; adenoma/114). After adjustment for multiple comparison (Benjamini–Hochberg method), we selected a stringent q value cutoff of ≤0.02.
The 212 proteins that satisfied this criterion and presented a mean expression fold change of ±1.4 (log2 0.5) or greater were classified as significantly dysregulated in adenomas. They included 76 with up-regulated expression and 136 with down-regulated expression in the tumor samples (Table III). When protein abundance iTRAQ ratios for these 212 proteins were plotted on a heat map, adenomas and normal mucosa samples formed two distinct clusters (Fig. 4A). As shown in Fig. 4B, tissue expression levels for the 212 dysregulated proteins showed good correlation (r = 0.74, p < 0.001, 95% confidence interval = 0.67–0.79) with those of mRNAs for the same genes (measured by our group in another set of colorectal adenomas) (26).
Table III. Proteins displaying differential expression in adenomas versus normal mucosa.
| UniProt accession numbera | Gene name | q value | Average fold change (log2) |
|---|---|---|---|
| P12429 | ANXA3 | 0.00000001 | 1.44 |
| Q9UN36 | NDRG2 | 0.00000001 | −0.79 |
| P00918 | CA2 | 0.00000003 | −2.26 |
| P23946 | CMA1 | 0.00000005 | −1.38 |
| P00488 | F13A1 | 0.00000005 | −1.30 |
| Q9UBR2 | CTSZ | 0.00000016 | −1.23 |
| P10645 | CHGA | 0.00000016 | −1.82 |
| O60844 | ZG16 | 0.00000024 | −2.02 |
| P17174 | GOT1 | 0.00000045 | −0.61 |
| P31949 | S100A11 | 0.00000062 | 1.49 |
| P00338b; P07195 | LDHA; LDHB | 0.00000068 | 0.62 |
| O60701 | UGDH | 0.00000104 | −0.70 |
| P55011 | SLC12A2 | 0.00000115 | 0.85 |
| O95571 | ETHE1 | 0.00000120 | −0.74 |
| Q01105 | SET | 0.00000230 | 0.72 |
| Q16851 | UGP2 | 0.00000275 | −0.53 |
| Q00796 | SORD | 0.00000275 | 0.62 |
| P20231; Q15661 | TPSB2; TPSAB1 | 0.00000275 | −1.51 |
| Q15181; Q9H2U2b | PPA1; PPA2 | 0.00000421 | 0.64 |
| Q9H3G5 | CPVL | 0.00000467 | −0.69 |
| P01282 | VIP | 0.00000722 | −1.10 |
| P07339 | CTSD | 0.00000856 | −0.71 |
| P19338 | NCL | 0.00000934 | 0.50 |
| Q6UWP2 | DHRS11 | 0.00001070 | −1.20 |
| P04066 | FUCA1 | 0.00001240 | −1.32 |
| Q53EL6 | PDCD4 | 0.00001270 | −0.51 |
| P07585 | DCN | 0.00001580 | −1.36 |
| P02511 | CRYAB | 0.00002720 | −1.19 |
| Q96CX2 | KCTD12 | 0.00003590 | −0.70 |
| Q05707; P08123 | COL14A1 | 0.00004020 | −1.21 |
| P51884 | LUM | 0.00004160 | −0.96 |
| Q15063 | POSTN | 0.00004240 | −2.10 |
| P21397 | MAOA | 0.00004240 | −0.63 |
| O00748 | CES2 | 0.00004610 | −0.88 |
| Q56VL3 | OCIAD2 | 0.00004960 | 0.95 |
| Q9BYZ8 | REG4 | 0.00004960 | 0.98 |
| P55008 | AIF1 | 0.00005650 | −0.75 |
| P50224; P50225 | SULT1A3; SULT1A1 | 0.00005760 | −0.63 |
| O14773 | TPP1 | 0.00006430 | −0.52 |
| Q16853 | AOC3 | 0.00006650 | −1.16 |
| P53634 | CTSC | 0.00006940 | −0.58 |
| O95881 | TXNDC12 | 0.00006940 | 0.55 |
| O75795 | UGT2B17 | 0.00006940 | −1.57 |
| O00391 | QSOX1 | 0.00006940 | −0.70 |
| Q99538 | LGMN | 0.00006940 | −0.63 |
| P12111 | COL6A3 | 0.00006990 | −0.74 |
| P80188 | LCN2 | 0.00006990 | 1.32 |
| P12956b | XRCC6 | 0.00007190 | 0.53 |
| Q6NZI2 | PTRF | 0.00007860 | −0.76 |
| P09382 | LGALS1 | 0.00007880 | −0.84 |
| P25815 | S100P | 0.00008020 | 3.38 |
| Q15118 | PDK1 | 0.00008120 | −0.90 |
| O75380 | NDUFS6 | 0.00008650 | −0.63 |
| Q9HAW8 | UGT1A10 | 0.00009090 | −0.95 |
| P01042 | KNG1 | 0.00009660 | −0.74 |
| O75356 | ENTPD5 | 0.00012385 | −0.54 |
| Q15293 | RCN1 | 0.00012867 | 0.61 |
| P17931 | LGALS3 | 0.00013151 | −0.62 |
| P36952 | SERPINB5 | 0.00013151 | 1.31 |
| P09211b | GSTP1 | 0.00014809 | 0.55 |
| P20774 | OGN | 0.00015467 | −1.52 |
| Q8NBJ4 | GOLM1 | 0.00015467 | −0.51 |
| Q16563 | SYPL1 | 0.00015568 | 1.16 |
| P04229; P13761; Q30134; Q9TQE0; Q9GIY3; Q29974; P04440; P79483 | HLA-DRB1; HLA-DRB1; HLA-DRB1; HLA-DRB1; HLA-DRB1; HLA-DRB1; HLA-DPB1; HLA-DRB3 | 0.00015568 | −0.81 |
| P35555 | FBN1 | 0.00017230 | −0.74 |
| Q9H4M9; Q9NZN4; Q9H223 | EHD1; EHD2; EHD4 | 0.00017230 | −0.56 |
| O00754 | MAN2B1 | 0.00017278 | −0.65 |
| B4DR31 | DPYSL2 | 0.00018023 | −0.55 |
| P06703b | S100A6 | 0.00018025 | 1.18 |
| P19801 | ABP1 | 0.00022289 | −0.50 |
| P20042 | EIF2S2 | 0.00022417 | 0.68 |
| P51858 | HDGF | 0.00024151 | 0.56 |
| P49959b | MRE11A | 0.00024174 | 0.64 |
| O00299b; Q9Y696 | CLIC1; CLIC4 | 0.00024726 | 0.67 |
| P61604b | HSPE1 | 0.00024977 | 0.52 |
| O43252; O95340 | PAPSS1; PAPSS2 | 0.00027464 | −0.57 |
| Q12765 | SCRN1 | 0.00029349 | −0.64 |
| Q9HB40 | SCPEP1 | 0.00030328 | −0.87 |
| P48556 | PSMD8 | 0.00032019 | 0.56 |
| O60547 | GMDS | 0.00034711 | 0.58 |
| Q9Y6R7 | FCGBP | 0.00035167 | −0.73 |
| P61626 | LYZ | 0.00036558 | 0.74 |
| Q9Y224 | C14orf166 | 0.00038868 | 0.52 |
| P01765; P01764 | (Ig heavy chain V-III region TIL; Ig heavy chain V-III region VH26) | 0.00038868 | −0.69 |
| Q9NVP1 | DDX18 | 0.00038996 | 0.67 |
| P80365 | HSD11B2 | 0.00039413 | −0.68 |
| P39687; Q92688 | ANP32A; ANP32B | 0.00039654 | 0.56 |
| Q86WA6 | BPHL | 0.00046215 | 0.52 |
| P24298 | GPT | 0.00047338 | −0.56 |
| Q12874 | SF3A3 | 0.00052166 | 0.50 |
| P04899; Q14344; P63092 | GNAI2; GNA13; GNAS | 0.00062192 | −0.51 |
| Q15124 | PGM5 | 0.00068593 | −0.68 |
| Q9HAW7; Q9HAW9; O60656 | UGT1A7; UGT1A8; UGT1A9 | 0.00071202 | −0.87 |
| P19224 | UGT1A6 | 0.00071202 | −0.87 |
| P06748 | NPM1 | 0.00071508 | 0.81 |
| Q9NUV9 | GIMAP4 | 0.00071508 | −0.89 |
| P18283b | GPX2 | 0.00071508 | 0.54 |
| P13688 | CEACAM1 | 0.00072482 | −1.06 |
| P01591 | IGJ | 0.00084082 | −1.10 |
| P19823 | ITIH2 | 0.00085565 | −0.71 |
| P01774; P01776; P01779 | (Ig heavy chain V-III region POM; Ig heavy chain V-III region WAS; Ig heavy chain V-III region TUR) | 0.00085565 | −0.79 |
| P27695b | APEX1 | 0.00086971 | 0.54 |
| Q9C002 | NMES1 | 0.00087016 | −0.91 |
| Q96F85 | CNRIP1 | 0.00088956 | −1.27 |
| Q9BPX5 | ARPC5L | 0.00095098 | 0.67 |
| P62263 | RPS14 | 0.00095182 | 0.52 |
| Q9BY32 | ITPA | 0.00095634 | 0.51 |
| P01625 | (Ig kappa chain V-IV region Len) | 0.00097041 | −0.61 |
| Q15582 | TGFBI | 0.00097041 | 0.90 |
| Q07021b | C1QBP | 0.00101874 | 0.76 |
| P00738 | HP | 0.00102030 | −0.61 |
| O15143 | ARPC1B | 0.00103757 | −0.50 |
| Q03154 | ACY1 | 0.00108571 | 0.60 |
| Q9HCB6 | SPON1 | 0.00115609 | −0.89 |
| Q96HE7 | ERO1L | 0.00119027 | 0.50 |
| P08575 | PTPRC | 0.00119950 | −0.52 |
| Q9Y266 | NUDC | 0.00152358 | 0.56 |
| P63313; P62328 | TMSB10; TMSB4X | 0.00159602 | 0.98 |
| Q96SQ9 | CYP2S1 | 0.00162405 | 0.84 |
| Q71U36 | TUBA1A | 0.00162405 | 0.54 |
| P00915 | CA1 | 0.00163258 | −1.18 |
| P04844 | RPN2 | 0.00165748 | 0.55 |
| P09669 | COX6C | 0.00171230 | −0.61 |
| P21980 | TGM2 | 0.00174251 | −0.55 |
| P00325 | ADH1B | 0.00175658 | −1.18 |
| O14745 | SLC9A3R1 | 0.00175658 | −0.51 |
| Q9H8H3 | METTL7A | 0.00179938 | −0.50 |
| P61009 | SPCS3 | 0.00186488 | −0.69 |
| Q15746; O15264; Q16539 | MYLK; MAPK13; MAPK14 | 0.00186488 | −0.53 |
| P01876; P01877; Q92973 | IGHA1; IGHA2; TNPO1 | 0.00191760 | −1.01 |
| P12109 | COL6A1 | 0.00194792 | −0.67 |
| Q9BX66 | SORBS1 | 0.00205902 | −0.64 |
| E9PGJ9 | CC2D1A | 0.00213982 | −0.53 |
| P49006 | MARCKSL1 | 0.00233532 | 0.51 |
| Q01524 | DEFA6 | 0.00233532 | 1.60 |
| P01620 | (Ig kappa chain V-III region SIE) | 0.00238585 | −0.56 |
| P36873 | PPP1CC | 0.00240171 | 0.58 |
| Q07507 | DPT | 0.00240576 | −1.28 |
| P37840 | SNCA | 0.00261720 | −0.57 |
| P00326; P07327 | ADH1C; ADH1A | 0.00271753 | −1.17 |
| P22105 | TNXB | 0.00271753 | −0.51 |
| O95299 | NDUFA10 | 0.00272901 | −0.84 |
| Q9NRP0 | OSTC | 0.00275806 | 0.76 |
| P10082 | PYY | 0.00282902 | −1.59 |
| P21810 | BGN | 0.00283401 | −0.66 |
| Q8IV08 | PLD3 | 0.00295758 | −0.74 |
| P01857; P01859; P01860; P01861 | IGHG1; IGHG2; IGHG3; IGHG4 | 0.00343621 | −0.57 |
| P62330 | ARF6 | 0.00343645 | 0.84 |
| Q03135 | CAV1 | 0.00346186 | −0.71 |
| P22309; P35503; P22310; P35504 | UGT1A1; UGT1A3; UGT1A4; UGT1A5 | 0.00349148 | −0.87 |
| Q9NSU2 | TREX1 | 0.00349148 | −0.76 |
| Q9UKY7 | CDV3 | 0.00355684 | 0.79 |
| Q7Z4V5 | HDGFRP2 | 0.00360855 | 0.65 |
| P07357 | C8A | 0.00372327 | −0.62 |
| Q99757 | TXN2 | 0.00377179 | −0.73 |
| P13686 | ACP5 | 0.00385765 | −0.80 |
| Q8WWA0 | ITLN1 | 0.00392858 | −1.30 |
| P62861 | FAU | 0.00395014 | 0.51 |
| P57737 | CORO7 | 0.00401004 | −0.83 |
| P10606 | COX5B | 0.00412793 | −0.71 |
| Q9Y259 | CHKB | 0.00420774 | −0.59 |
| Q9Y2J8 | PADI2 | 0.00435864 | −0.50 |
| O94919 | ENDOD1 | 0.00451988 | −0.80 |
| B9A064; P0CG05; A0M8Q6 | IGLL5; IGLC2; IGLC7 | 0.00451988 | −0.56 |
| P20039 | HLA-DRB1 | 0.00459324 | −0.82 |
| P63167b; Q96FJ2 | DYNLL1; DYNLL2 | 0.00468484 | 0.63 |
| Q9UNN8 | PROCR | 0.00480932 | −0.78 |
| P07099 | EPHX1 | 0.00486543 | −0.54 |
| P32322 | PYCR1 | 0.00495977 | 0.55 |
| Q9P0J0 | NDUFA13 | 0.00534323 | −0.60 |
| E7EUF8; E9PFN5 | EPB41L3; GSTK1 | 0.00539222 | −0.95 |
| O75531 | BANF1 | 0.00560405 | 0.73 |
| P26447 | S100A4 | 0.00562754 | −0.53 |
| Q9NVJ2 | ARL8B | 0.00562754 | 0.50 |
| Q8N752 | CSNK1A1 | 0.00562754 | 0.52 |
| P40616 | ARL1 | 0.00583778 | 0.60 |
| Q96GA7 | SDSL | 0.00583778 | −0.82 |
| P01275 | GCG | 0.00607808 | −1.33 |
| P15289 | ARSA | 0.00633336 | −0.57 |
| O75521 | ECI2 | 0.00635218 | −0.60 |
| P62158b | CALM1; CALM2; CALM3 | 0.00657472 | 0.67 |
| P49821 | NDUFV1 | 0.00669319 | −0.66 |
| Q15746–5 | MYLK | 0.00678109 | −0.51 |
| Q96BM9 | ARL8A | 0.00686655 | 0.54 |
| Q6UX06 | OLFM4 | 0.00696505 | 1.14 |
| P10153 | RNASE2 | 0.00724902 | −0.50 |
| P19075b | TSPAN8 | 0.00837908 | 0.59 |
| Q8WU39 | PACAP | 0.00837978 | −0.56 |
| P21953 | BCKDHB | 0.00837978 | 0.54 |
| O76041 | NEBL | 0.00837978 | 0.71 |
| Q9H4G4 | GLIPR2 | 0.00849532 | −1.10 |
| P01766; P01767; P01768 | (Ig heavy chain V-III region BRO; Ig heavy chain V-III region BUT; Ig heavy chain V-III region CAM) | 0.00895132 | −0.61 |
| Q9NR56; Q5VZF2 | MBNL1; MBNL2 | 0.00996176 | 0.55 |
| P27105 | STOM | 0.01083127 | −0.51 |
| P05387 | RPLP2 | 0.01100903 | 0.62 |
| Q96AB3 | ISOC2 | 0.01164408 | −0.51 |
| O43294 | TGFB1I1 | 0.01198321 | −0.57 |
| Q08752 | PPID | 0.01211602 | 0.55 |
| Q96DG6 | CMBL | 0.01289211 | −0.51 |
| P61619 | SEC61A1 | 0.01375705 | 0.59 |
| P56381; Q5VTU8 | ATP5E; ATP5EP2 | 0.01440856 | −0.52 |
| P14174b | MIF | 0.01488262 | 0.51 |
| P12110 | COL6A2 | 0.01526347 | −0.53 |
| Q14956 | GPNMB | 0.01546825 | −0.63 |
| P46952 | HAAO | 0.01570996 | −0.53 |
| Q86VN1 | VPS36 | 0.01610077 | 0.67 |
| Q96S52 | PIGS | 0.01626862 | −0.61 |
| P15559b | NQO1 | 0.01626862 | 0.56 |
| O60575 | SPINK4 | 0.01810104 | 0.77 |
| P55735 | SEC13 | 0.01827155 | 0.59 |
| P02452 | COL1A1 | 0.01933726 | −1.32 |
| P00403 | MT-CO2 | 0.02012815 | −0.62 |
a Two or more accession numbers: proteins from the same family or isoforms from the same gene. Boldface numbers indicate “epithelial cell signature” proteins (see text).
b Designated candidate cancer biomarkers in the Human Protein Atlas database.
Fig. 4.
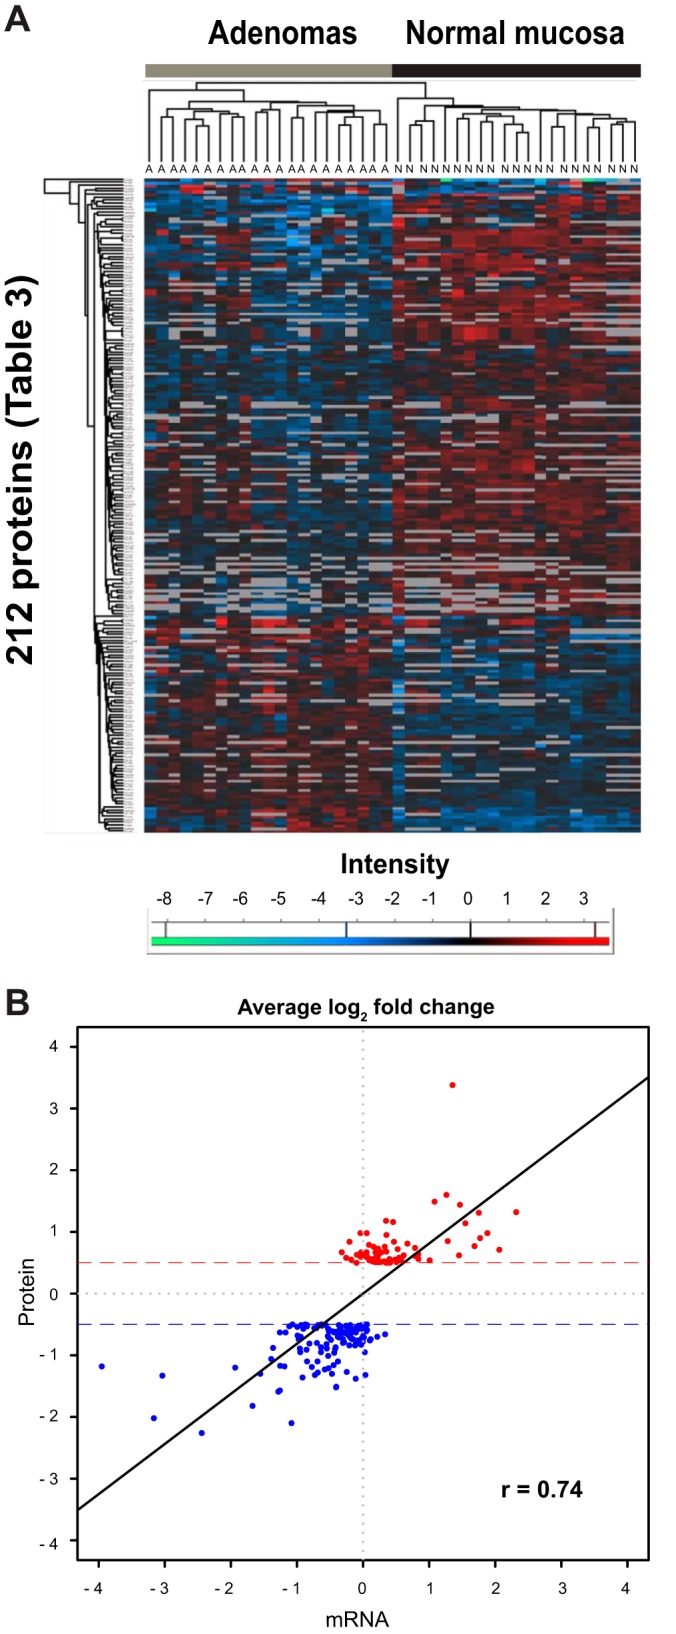
Analysis of the 212 proteins displaying significant tumor-related dysregulation. A, hierarchical clustering of iTRAQ abundance ratios (normal versus 114, adenoma versus 114) for the 212 proteins displaying significant adenoma-related dysregulation grouped tissue samples into two discrete clusters: adenoma (A) and normal (N). B, Pearson's correlation test comparing average fold changes (at least ±0.5 log2) for the 212 proteins (red, up-regulated; blue, down-regulated) in the tissue series with average log2 fold changes for the corresponding mRNAs measured in another set of adenoma/normal mucosal samples.
Table IV lists the biological processes that were overrepresented in this set of proteins. At the top of this list was xenobiotic metabolism, a process already linked with adenoma formation on the basis of enrichment studies of transcriptomic datasets conducted by our group (32). Three of the dysregulated proteins involved in this process (CYP2S1, NQO1, and GSTP1) displayed up-regulated expression in adenomas, but most were characterized by tumor-related down-regulation (ADH1B, ADH1C/ADH1A, UGT1A9/UGT1A6, UGT1A1/UGT1A4/UGT1A3/UGT1A5, UGT1A7/UGT1A8, UGDH, MAOA, SULT1A3/SULT1A1, PAPSS1/PAPSS2, UGP2). Network-building analysis revealed that all these proteins were linked by subnetworks controlled by cancer-associated transcription factors, such as SP1 or, less frequently, MYC, HIF1A, or TP53 (supplemental Fig. S3). As noted in Table IV, a very similar picture emerged when GO enrichment was also analyzed in a larger set of 621 dysregulated proteins selected with less stringent criteria (q value cutoff ≤ 0.2; average log2 fold change ≥ ±0.5).
Table IV. Gene Ontology (GO) biological processes enriched in the set of 212 proteins whose expression displayed adenoma-related dysregulation (see Table III).
| GO I.D. | GO term | Annotateda | Significantb | Up in adenomas | Down in adenomas | Expectedc | elim p valued |
|---|---|---|---|---|---|---|---|
| GO:0006805 | Xenobiotic metabolic processe | 64 | 21 | 3 | 18 | 2.8 | 1.70E-09 |
| GO:0006958 | Complement activation, classical pathwaye | 74 | 17 | 0 | 17 | 3.24 | 1.10E-08 |
| GO:0051552 | Flavone metabolic processe | 5 | 5 | 0 | 5 | 0.22 | 1.50E-07 |
| GO:0052696 | Flavonoid glucuronidatione | 5 | 5 | 0 | 5 | 0.22 | 1.50E-07 |
| GO:0052697 | Xenobiotic glucuronidatione | 5 | 5 | 0 | 5 | 0.22 | 1.50E-07 |
| GO:0042573 | Retinoic acid metabolic processe | 9 | 6 | 0 | 6 | 0.39 | 5.00E-07 |
| GO:0045087 | Innate immune responsef | 249 | 33 | 4 | 29 | 10.91 | 7.80E-07 |
| GO:0031295 | T-cell costimulationf | 34 | 10 | 0 | 10 | 1.49 | 1.10E-06 |
| GO:0030199 | Collagen fibril organizatione | 8 | 5 | 0 | 5 | 0.35 | 7.80E-06 |
| GO:0001501 | Skeletal system development | 54 | 11 | 1 | 10 | 2.37 | 1.60E-05 |
| GO:0070208 | Protein heterotrimerizatione | 5 | 4 | 0 | 4 | 0.22 | 1.70E-05 |
| GO:0050852 | T-cell receptor signaling pathwayf | 48 | 10 | 0 | 10 | 2.1 | 3.20E-05 |
a Proteins in TopGO Background list.
b 212 dysregulated proteins of Table III.
c Number of significant proteins expected to map to the GO term if the significant proteins are randomly distributed over all GO terms.
d p value from the Eliminating Genes method (25). Only processes with an elim p value < 1.0E-04 are shown.
e Processes that were also among the top 12 processes displaying enrichment in a larger set of 621 dysregulated proteins selected with less stringent criteria (q value ≤ 0.2; average log2 fold change ≥ ±0.5; see “Results” section for details).
f Processes that shared a common GO ancestor (immune system process) with the process displaying the most significant enrichment in the larger set.
The expression levels of 111 (52%) of the 212 proteins that were differentially expressed in adenomas were also quantified in cell lines (those shown in bold in Table III and referred to hereinafter as the “epithelial cell signature” proteins). Almost half (n = 51, 46%) showed directionally similar tumor-related dysregulation in both analyses. Because cell line studies were conducted with only one noncancerous line, these findings obviously require further validation. They suggest, however, that these 51 proteins are indeed expressed in the epithelial cells of normal colorectal tissues and that their expression is dysregulated in the epithelial cells of adenomas.
Up-regulation of SORD Expression and Activity in Colorectal Adenomas and Cancer Cell Lines
Sorbitol dehydrogenase, a key enzyme in the polyol pathway, was one of the most significantly up-regulated proteins in our colorectal adenomas (based on q values) (Table III). Because its increased expression could have metabolic consequences with potential effects on tumorigenesis, we performed Western blotting and immunostaining studies to validate this finding. The reliability of the anti-SORD antibody we had chosen was first tested on protein extracts from the six colorectal epithelial cell lines (Fig. 5A). The tumor-related log2 fold changes detected with Western blotting were substantially greater than those documented with iTRAQ (2 to 6 versus 0.4 to 1, respectively) (Fig. 5B), which was not surprising, as iTRAQ has been reported to underestimate protein abundance (33). However, the relative quantities of SORD found with the two methods were fully consistent. As for the 21 adenomas, the elevated SORD expression documented in these tumors by iTRAQ (Fig. 5C) showed good correlation with the increased SORD mRNA levels we had previously found in 42 other lesions of this type (26) (Fig. 5D). Western blot analysis of four randomly selected adenoma–normal mucosa pairs from the present series revealed obvious up-regulation of SORD expression in all four tumors, although the magnitude of the increase varied (Fig. 5E).
Fig. 5.

Significantly up-regulated SORD expression and activity in colorectal cell lines and adenomas. A, tumor-related up-regulation of sorbitol dehydrogenase (SORD) in colon cancer cell lines was confirmed with Western blotting. The SORD dysregulation trend was identical to that observed with iTRAQ-based MS/MS, although when immunoblot results were quantified (B), the log2 fold changes were more than five times greater than those documented in the iTRAQ study. C, SORD protein expression (iTRAQ analysis) in 21 normal mucosa–adenoma tissue pairs. D, SORD mRNA expression in 42 other normal mucosa–adenoma pairs from a previous study by our group (26). Error bars indicate the means and 95% confidence intervals. E, Western blots showing tumor-related up-regulation of SORD expression in four randomly selected adenoma (A)/normal mucosa (N) tissue pairs of the 21 shown in panel C (see Table I for sample descriptions). F, SORD activity also displayed tumor-related up-regulation in cell lines (HT29 and SW480 versus HCEC cells) and tissues (adenomas versus normal mucosa). Columns show mean enzyme activity measured in at least two replicates; error bars indicate standard deviations from means. The Western blot beneath the graph shows SORD levels measured in the extracts used for the enzyme activity assays.
SORD activity was then assayed (see “Experimental Procedures”) to see how it corresponded with the enzyme expression levels reported above. As shown in Fig. 5F, the results of cell line assays were fully consistent with the Western blotting data: SORD activity was seven times higher in HT29 than in HCEC cells, and more limited up-regulation was found in SW480. High correlation between enzyme activity and protein level was also documented for three randomly selected adenoma–normal mucosa pairs (Fig. 5F).
MS and Western blotting findings were further validated with immunostaining studies, as shown in Fig. 6. Cytoplasmic SORD staining was evident in the colon cancer cell line HT29 but was weaker or even absent in normal epithelial HCEC cells (Figs. 6A and 6B). As for colorectal tissues, SORD cytoplasmic expression was limited to the bottom of the normal epithelial crypts (Figs. 6C, 6D, and 6E), but its expression was markedly increased in adenomatous and cancerous glands (Figs. 6F–6I). These findings suggest that SORD is likely to be expressed in proliferating cells, although it was largely absent in HCECs, which undergo regular proliferation in vitro. Furthermore, nuclear localization of SORD was noted in some adenomatous crypts (supplemental Figs. S4A and S4C), and the cells in question were almost always negative for the well-known proliferation marker Ki-67 (supplemental Figs. S4B and S4D). This mutually exclusive staining pattern was also observed in normal crypts of the ileum, where SORD, interestingly, appeared to be expressed in the nuclei of putative stem cells (supplemental Figs. S4E and S4F).
Fig. 6.

Anti-SORD immunostaining of colorectal cell lines and tissues. Consistent with proteomic data, SORD expression was (A) negligible or absent in HCECs but (B) clearly expressed in the cytoplasm of HT29 cells. C, in normal colorectal mucosa, SORD expression was limited to the lower portion of the epithelial crypts, where stem cells and highly proliferating cells are located. Higher magnification views show staining at (D) the base versus (E) the mouth of colonic crypts. F, G, its expression was markedly increased in adenomatous glands (red arrowheads) relative to normal crypts (green arrowheads). Panels H and I show abundant expression of SORD in a large adenoma and in a cancer, respectively.
Polyol Pathway Enzyme Expression and Metabolite Levels in Cell Lines and Tissues
We then examined the state of the polyol pathway (supplemental Fig. S5A) in colorectal cell lines and tissues. As shown in supplemental Fig. S5B, immunoblot studies revealed decreased AKR1B1 expression in HT29 (versus HCEC cells) and adenomas (versus corresponding normal mucosal samples), whereas SORD expression and that of KHK were up-regulated in tumor cells and tissues. As for the metabolites (supplemental Fig. S5C), d-glucose levels were significantly decreased in adenomas. Less dramatic changes were observed in the levels of d-sorbitol and d-fructose, which both showed a tendency to decrease in tumor tissues.
DISCUSSION
Although a number of proteomic studies have comparatively analyzed different types of colorectal tissues, precancerous lesions have been considered in only three (21, 34, 35), and in two of these (21, 34), the number of adenomas analyzed was very small (≤4). The study by Lam et al. (35) is the only one that compared protein expression in a relatively large number (n = 20) of paired adenoma and normal mucosa samples. They used two-dimensional gel electrophoresis to resolve over 1000 proteins in the two tissue groups, and those displaying differential expression were then analyzed with MALDI-TOF/TOF-MS. MS/MS validation pinpointed four proteins (ANXA3, S100A11, EIF-5A1, and S100P) whose expression in adenomas was significantly increased. Using MS with iTRAQ 8-plex peptide labeling and OFFGEL fractionation allowed us to quantitatively compare protein expression in 30 colorectal adenomas and paired samples of normal mucosa and investigate low-abundance proteins that cannot be evaluated with proteomics based on two-dimensional gel electrophoresis. All in all, 4325 nonredundant protein families were quantified in our colorectal tissues (25% of which were identified in all 60 samples) (Table II), and the 212 proteins we flagged as significantly dysregulated in adenomas included three of the four proteins identified by Lam et al. (up-regulation of the fourth, EIF-5A1, failed to meet our stringent criterion for significance) (Table III).
The cell types in which these proteomic changes occur is of obvious interest, as colorectal cancer arises from the epithelial component of the colorectal mucosa. Although our findings are preliminary and will naturally require validation in future studies, 51 of the 212 proteins listed in Table III were “epithelial cell signature” proteins and showed directionally similar expression changes in colon cancer cell lines versus HCEC. It therefore seems likely that their dysregulated expression in adenomas is a feature of neoplastic transformation of colorectal epithelial cells. However, epithelial–stromal cell interactions can also play important roles in tumorigenesis (20). Our approach also allowed us to identify 101 proteins displaying adenoma-related dysregulation that were probably of stromal-cell origin, as they were not expressed in any of the six epithelial cell lines we examined (Table III). These proteins were mainly involved in immune-related processes (immune response, complement activation, T-cell co-stimulation), which are usually not represented in colon epithelial cell lines. Their expression changes are likely to have important effects on the microenvironment of an epithelial-cell tumor.
Our search for potential biomarkers of early-stage colorectal tumorigenesis focused exclusively on the 76 proteins whose expression was significantly up-regulated in adenomas. According to the Human Protein Atlas database (36), 69 (91%) of these have cancer-related features, and 16 of the 69 are already classified as candidate cancer biomarkers (Table III). The Human Protein Atlas database contains information on protein expression in normal and cancer tissues, but not in those regarded as precancerous. The overlap between our findings and those of the Human Protein Atlas suggest that most protein expression changes identified thus far in colorectal adenocarcinomas are probably already detectable in the benign precursors of these lesions. Supplemental Fig. S6 shows the expression profiles of the 10 proteins that were most markedly up-regulated in adenomas. This group included two of the four proteins identified by Lam et al. (35) as significantly overexpressed in adenomas. Annexin A3 (ANXA3), for example, is at the top of our list (based on q values) (Table III). An angiogenic factor that induces VEGF production via the HIF-1 pathway (37), ANXA3 belongs to a family of calcium-dependent, phospholipid-binding proteins involved in diverse biological processes, including signal transduction, inflammatory responses, membrane organization, and the regulation of cellular growth (38, 39). Dysregulated ANXA expression is also a common feature of colorectal cancer (39), and most other cancers as well (40). S100A11 expression was also increased in these tumors, which is consistent with earlier reports (41). The cytosolic S100 proteins interact directly with peptides on the N-terminal domain of annexins (38, 42), and like the annexins, they also have diverse intracellular and extracellular functional roles (43).
Among the other top 10 proteins displaying adenoma-related up-regulation were LDHA and LDHB. Their expression levels were not measured separately, but LDHA is presumably responsible for the increased expression observed in our adenomas. LDHB expression is in most cases epigenetically silenced in colon cancer cells (44, 45), whereas LDHA is overexpressed, and its activity is maintained via the oncogenic tyrosine kinase FGFR1 (46). LDHA is a key player in the reversible conversion of pyruvate to lactate during aerobic glycolysis, a typical feature of cancer cell metabolism first described by Warburg (47). The sodium- and potassium-coupled chloride cotransporter SLC12A2 is expressed on the basolateral membrane of the normal colon epithelium, where its recruitment and activation are regulated by calcium and cAMP. Loss of SLC12A2 leads to impaired chloride secretion in the intestine (48, 49), but to our knowledge, there are no published data linking this protein to colon cancer. The fifth markedly overexpressed protein was SET, one of the five proteins that make up the inhibitor of acetyltranferases (INHAT) complex. Two other INHAT components, APEX1 and ANP32A/ANP32B, were also up-regulated in adenomas (albeit to a lesser extent than SET) (Table III). These changes are noteworthy because INHAT binds directly to histones, preventing their acetylation by histone acetyl transferases (50–52), and loss of histone acetylation is a crucial step in gene silencing (53, 54). Thus far, INHAT's role in cancer has not been widely investigated, but overexpression of the complex components has been observed in serous epithelial ovarian cancer (55). The up-regulated expression of PPA1/PPA2 in our adenomas might play various roles in colorectal tumorigenesis, as these proteins are key players in the synthesis of fatty acids, nucleotides, amino acids, and other essential molecules (56). The phosphoprotein nucleolin, an essential protein for proliferating cells (57), appears to regulate several steps in the biogenesis of ribosomes, including transcription, ribosome assembly, and the processing of precursor ribosomal RNA (58–60), all of which might be instrumental in adenoma growth. As for OCIAD2, strong immunoreactivity for this protein has been reported in early-stage adenocarcinomas of the lung and in ovarian cancers (61–63), but there are no published data linking it to colorectal tumorigenesis. In contrast, the secreted protein REG4, which promotes mitosis and enhances the motility and invasiveness of colon cancer cells, is strongly expressed in these cells and in the serum of patients with colorectal cancer (64–66).
The final protein characterized by marked adenoma-related up-regulation was SORD, a key enzyme in the polyol metabolic pathway. It was selected for validation studies because although aberrant polyol pathway activity has been implicated in diabetic complications (67–70) and myocardial ischemia (71), the role of SORD in tumorigenesis was completely unknown. During the execution of this study, however, up-regulated SORD expression was reported in prostate cancer (72) and in colorectal adenomas (21), and these findings strengthened our resolve to characterize this phenomenon in colorectal tumorigenesis.
Up-regulated SORD expression and activity in adenomas (Fig. 5) would enhance the production of fructose (see schematic of supplemental Fig. S5A), thereby increasing the generation of triose sugars and diacylglycerol (intermediates in the glycolytic and lipid signaling pathways, respectively). Fructose is also several times more effective than glucose in promoting intracellular non-enzymatic glycation (73–75), and advanced glycation end products may contribute to the vascular complications of diabetes and other pathologic conditions (67, 76–78). Whether these fructose-driven metabolic events play a role in the development of adenomas is unclear, but the polyol pathway was very active in the adenomatous cells we examined. This activity was also reflected in the concomitant increase of the expression of KHK (supplemental Fig. S5B), the enzyme that catalyzes the transformation of fructose to fructose-1-P, downstream from the polyol pathway.
The effects of these enzymatic changes on sorbitol and fructose concentrations in adenomas need to be investigated in larger tissue series, but our preliminary data suggest that the levels of both are slightly decreased in these lesions (supplemental Fig. S5C). In contrast, our adenomas exhibited dramatically reduced concentrations of glucose, the initial substrate in the polyol pathway (supplemental Fig. S5C). Adenoma-related dysregulation was also noted in the expression of AKR1B1, the enzyme that converts glucose to sorbitol (supplemental Fig. S5B). Exploitation of the polyol pathway to divert carbon from glucose to other energy intermediates might provide adenomatous cells with a selective advantage over normal cells. This pathway might prove to be another means of tumor-related glucose consumption in addition to the well-known glycolytic and pentose phosphate pathways (supplemental Fig. S5A). Advanced cancer cells consume glucose at a much higher rate than normal cells, and much of their energy is generated by aerobic glycolysis rather than by oxidative phosphorylation of glucose in the mitochondria (i.e. the Warburg effect) (79). The predominantly glycolytic phenotype of cancer cells results in low glucose levels and high concentrations of lactate (47, 80, 81). The relative concentrations of lactate in the three adenomas we tested were significantly greater than those found in matched samples of normal mucosa (supplemental Fig. S5C), indicating that the Warburg effect is already evident in precancerous colorectal lesions. Studies involving metabolic flux analysis to monitor the fate of isotopic tracers in in vitro and in vivo systems would provide further insight into the biological roles of the polyol pathway in tumorigenesis. Further information on selected PSMs, peptides, and corresponding assembled proteins can be found in supplemental Tables S1 (tissues) and S3 (cell lines). Supplemental Figs. S7 through S17 show spectra for the proteins identified with a single peptide (listed in supplemental Tables S1 and S3).
Supplementary Material
Acknowledgments
We thank Ritva Haider, Mirjam Schneider, Asa Wahlander, Bernd Roschitzki, Claudia Fortes, Tshering Altherr, Michal J. Okoniewski, and Katrin Hecht for technical assistance; Paola Picotti, Bernd Wollscheid, Joseph Jiricny, Javier Pena Diaz, Mirco Menigatti, and David Fischer for productive discussion; and Marian Everett Kent for editing the manuscript. The MS data have been deposited in the ProteomeXchange Consortium (http://proteomecentral.proteomexchange.org) via the PRIDE partner repository with the dataset identifier PXD000445 and DOI 10.6019/PXD000445.
Footnotes
Author contributions: P.N. and G.M. designed research; A.U., P.N., A.T., and E.L. performed research; J.W.S. contributed new reagents or analytic tools; J.G., S.B., and E.L. analyzed data; A.U. and G.M. wrote the paper; T.S. and F.B. performed tissue sample and clinical data collection.
* The research was supported by a grant from the Swiss National Science Foundation (Grant No. 31003A_141225).
 This article contains supplemental material.
1 The abbreviations used are:
- iTRAQ
- isobaric tags for relative and absolute quantification
- HCEC
- human colon epithelial cell
- FDR
- false discovery rate
- GO
- Gene Ontology
- INHAT
- inhibitor of acetyltransferases
- MS/MS
- tandem mass spectrometry
- PSM
- peptide spectra match
- emPAI
- exponentially modified protein abundance index
- SORD
- sorbitol dehydrogenase
- TBST
- Tris-buffered saline with Tween 20.
REFERENCES
- 1. Jemal A., Bray F., Center M. M., Ferlay J., Ward E., Forman D. (2011) Global cancer statistics. CA Cancer J. Clin. 61, 69–90 [DOI] [PubMed] [Google Scholar]
- 2. Siegel R., Naishadham D., Jemal A. (2013) Cancer statistics, 2013. CA Cancer J. Clin. 63, 11–30 [DOI] [PubMed] [Google Scholar]
- 3. Shinya H., Wolff W. I. (1979) Morphology, anatomic distribution and cancer potential of colonic polyps. Ann. Surg. 190, 679–683 [DOI] [PMC free article] [PubMed] [Google Scholar]
- 4. Cattaneo E., Baudis M., Buffoli F., Bianco M. A., Zorzi F., Marra G. (2011) Pathways and crossroads to colorectal cancer In Pre-Invasive Disease: Pathogenesis and Clinical Management (Fitzgerald R. C., ed), pp. 369–394, Springer, New York [Google Scholar]
- 5. U.S. Multi-Society Task Force (2002) Screening for colorectal cancer: recommendation and rationale. Ann. Intern. Med. 137, 129–131 [DOI] [PubMed] [Google Scholar]
- 6. Kahi C. J., Rex D. K., Imperiale T. F. (2008) Screening, surveillance, and primary prevention for colorectal cancer: a review of the recent literature. Gastroenterology 135, 380–399 [DOI] [PubMed] [Google Scholar]
- 7. Levin B., Lieberman D. A., McFarland B., Andrews K. S., Brooks D., Bond J., Dash C., Giardiello F. M., Glick S., Johnson D., Johnson C. D., Levin T. R., Pickhardt P. J., Rex D. K., Smith R. A., Thorson A., Winawer S. J., American Cancer Society Colorectal Cancer Advisory, U.S. Multi-Society Task Force, and American College of Radiology Colon Cancer (2008) Screening and surveillance for the early detection of colorectal cancer and adenomatous polyps, 2008: a joint guideline from the American Cancer Society, the US Multi-Society Task Force on Colorectal Cancer, and the American College of Radiology. Gastroenterology 134, 1570–1595 [DOI] [PubMed] [Google Scholar]
- 8. Sillars-Hardebol A. H., Carvalho B., van Engeland M., Fijneman R. J., Meijer G. A. (2012) The adenoma hunt in colorectal cancer screening: defining the target. J. Pathol. 226, 1–6 [DOI] [PubMed] [Google Scholar]
- 9. de Wit M., Fijneman R. J., Verheul H. M., Meijer G. A., Jimenez C. R. (2013) Proteomics in colorectal cancer translational research: biomarker discovery for clinical applications. Clin. Biochem. 46, 466–479 [DOI] [PubMed] [Google Scholar]
- 10. Patterson S. D., Aebersold R. H. (2003) Proteomics: the first decade and beyond. Nat. Genet. 33 Suppl, 311–323 [DOI] [PubMed] [Google Scholar]
- 11. Horth P., Miller C. A., Preckel T., Wenz C. (2006) Efficient fractionation and improved protein identification by peptide OFFGEL electrophoresis. Mol. Cell. Proteomics 5, 1968–1974 [DOI] [PubMed] [Google Scholar]
- 12. Wu W. W., Wang G., Baek S. J., Shen R. F. (2006) Comparative study of three proteomic quantitative methods, DIGE, cICAT, and iTRAQ, using 2D gel or LC-MALDI TOF/TOF. J. Proteome Res. 5, 651–658 [DOI] [PubMed] [Google Scholar]
- 13. Aebersold R., Mann M. (2003) Mass spectrometry-based proteomics. Nature 422, 198–207 [DOI] [PubMed] [Google Scholar]
- 14. Aebersold R., Goodlett D. R. (2001) Mass spectrometry in proteomics. Chem. Rev. 101, 269–295 [DOI] [PubMed] [Google Scholar]
- 15. Bensimon A., Heck A. J., Aebersold R. (2012) Mass spectrometry-based proteomics and network biology. Annu. Rev. Biochem. 81, 379–405 [DOI] [PubMed] [Google Scholar]
- 16. Bantscheff M., Lemeer S., Savitski M. M., Kuster B. (2012) Quantitative mass spectrometry in proteomics: critical review update from 2007 to the present. Anal. Bioanal. Chem. 404, 939–965 [DOI] [PubMed] [Google Scholar]
- 17. Wiese S., Reidegeld K. A., Meyer H. E., Warscheid B. (2007) Protein labeling by iTRAQ: a new tool for quantitative mass spectrometry in proteome research. Proteomics 7, 340–350 [DOI] [PubMed] [Google Scholar]
- 18. Gan C. S., Chong P. K., Pham T. K., Wright P. C. (2007) Technical, experimental, and biological variations in isobaric tags for relative and absolute quantitation (iTRAQ). J. Proteome Res. 6, 821–827 [DOI] [PubMed] [Google Scholar]
- 19. Ross P. L., Huang Y. N., Marchese J. N., Williamson B., Parker K., Hattan S., Khainovski N., Pillai S., Dey S., Daniels S., Purkayastha S., Juhasz P., Martin S., Bartlet-Jones M., He F., Jacobson A., Pappin D. J. (2004) Multiplexed protein quantitation in Saccharomyces cerevisiae using amine-reactive isobaric tagging reagents. Mol. Cell. Proteomics 3, 1154–1169 [DOI] [PubMed] [Google Scholar]
- 20. Jimenez C. R., Knol J. C., Meijer G. A., Fijneman R. J. (2010) Proteomics of colorectal cancer: overview of discovery studies and identification of commonly identified cancer-associated proteins and candidate CRC serum markers. J. Proteomics 73, 1873–1895 [DOI] [PubMed] [Google Scholar]
- 21. Besson D., Pavageau A. H., Valo I., Bourreau A., Belanger A., Eymerit-Morin C., Mouliere A., Chassevent A., Boisdron-Celle M., Morel A., Solassol J., Campone M., Gamelin E., Barre B., Coqueret O., Guette C. (2011) A quantitative proteomic approach of the different stages of colorectal cancer establishes OLFM4 as a new nonmetastatic tumor marker. Mol. Cell. Proteomics 10, M111.009712. [DOI] [PMC free article] [PubMed] [Google Scholar]
- 22. Jankova L., Chan C., Fung C. L., Song X., Kwun S. Y., Cowley M. J., Kaplan W., Dent O. F., Bokey E. L., Chapuis P. H., Baker M. S., Robertson G. R., Clarke S. J., Molloy M. P. (2011) Proteomic comparison of colorectal tumours and non-neoplastic mucosa from paired patient samples using iTRAQ mass spectrometry. Mol. Biosyst. 7, 2997–3005 [DOI] [PubMed] [Google Scholar]
- 23. Roig A. I., Eskiocak U., Hight S. K., Kim S. B., Delgado O., Souza R. F., Spechler S. J., Wright W. E., Shay J. W. (2010) Immortalized epithelial cells derived from human colon biopsies express stem cell markers and differentiate in vitro. Gastroenterology 138, 1012–1021 [DOI] [PubMed] [Google Scholar]
- 24. Kall L., Storey J. D., MacCoss M. J., Noble W. S. (2008) Posterior error probabilities and false discovery rates: two sides of the same coin. J. Proteome Res. 7, 40–44 [DOI] [PubMed] [Google Scholar]
- 25. Alexa A., Rahnenfuhrer J., Lengauer T. (2006) Improved scoring of functional groups from gene expression data by decorrelating GO graph structure. Bioinformatics 22, 1600–1607 [DOI] [PubMed] [Google Scholar]
- 26. Cattaneo E., Laczko E., Buffoli F., Zorzi F., Bianco M. A., Menigatti M., Bartosova Z., Haider R., Helmchen B., Sabates-Bellver J., Tiwari A., Jiricny J., Marra G. (2011) Preinvasive colorectal lesion transcriptomes correlate with endoscopic morphology (polypoid vs. nonpolypoid). EMBO Mol. Med. 3, 334–347 [DOI] [PMC free article] [PubMed] [Google Scholar]
- 27. Truninger K., Menigatti M., Luz J., Russell A., Haider R., Gebbers J. O., Bannwart F., Yurtsever H., Neuweiler J., Riehle H. M., Cattaruzza M. S., Heinimann K., Schär P., Jiricny J., Marra G. (2005) Immunohistochemical analysis reveals high frequency of PMS2 defects in colorectal cancer. Gastroenterology 128, 1160–1171 [DOI] [PubMed] [Google Scholar]
- 28. Gerlach U., Hilby W. (1974) Methods of Enzymatic Analysis, 2nd Ed., Academic Press Inc., New York [Google Scholar]
- 29. Lisec J., Schauer N., Kopka J., Willmitzer L., Fernie A. R. (2006) Gas chromatography mass spectrometry-based metabolite profiling in plants. Nat. Protoc. 1, 387–396 [DOI] [PubMed] [Google Scholar]
- 30. Afkarian M., Bhasin M., Dillon S. T., Guerrero M. C., Nelson R. G., Knowler W. C., Thadhani R., Libermann T. A. (2010) Optimizing a proteomics platform for urine biomarker discovery. Mol. Cell. Proteomics 9, 2195–2204 [DOI] [PMC free article] [PubMed] [Google Scholar]
- 31. Ishihama Y., Oda Y., Tabata T., Sato T., Nagasu T., Rappsilber J., Mann M. (2005) Exponentially modified protein abundance index (emPAI) for estimation of absolute protein amount in proteomics by the number of sequenced peptides per protein. Mol. Cell. Proteomics 4, 1265–1272 [DOI] [PubMed] [Google Scholar]
- 32. Maglietta R., Liuzzi V. C., Cattaneo E., Laczko E., Piepoli A., Panza A., Carella M., Palumbo O., Staiano T., Buffoli F., Andriulli A., Marra G., Ancona N. (2012) Molecular pathways undergoing dramatic transcriptomic changes during tumor development in the human colon. BMC Cancer 12, 608. [DOI] [PMC free article] [PubMed] [Google Scholar]
- 33. Ow S. Y., Salim M., Noirel J., Evans C., Rehman I., Wright P. C. (2009) iTRAQ underestimation in simple and complex mixtures: “the good, the bad and the ugly.” J. Proteome Res. 8, 5347–5355 [DOI] [PubMed] [Google Scholar]
- 34. Albrethsen J., Knol J. C., Piersma S. R., Pham T. V., de Wit M., Mongera S., Carvalho B., Verheul H. M., Fijneman R. J., Meijer G. A., Jimenez C. R. (2010) Subnuclear proteomics in colorectal cancer: identification of proteins enriched in the nuclear matrix fraction and regulation in adenoma to carcinoma progression. Mol. Cell. Proteomics 9, 988–1005 [DOI] [PMC free article] [PubMed] [Google Scholar]
- 35. Lam F., Jankova L., Dent O. F., Molloy M. P., Kwun S. Y., Clarke C., Chapuis P., Robertson G., Beale P., Clarke S., Bokey E. L., Chan C. (2010) Identification of distinctive protein expression patterns in colorectal adenoma. Proteomics Clin. Appl. 4, 60–70 [DOI] [PubMed] [Google Scholar]
- 36. Uhlen M., Oksvold P., Fagerberg L., Lundberg E., Jonasson K., Forsberg M., Zwahlen M., Kampf C., Wester K., Hober S., Wernerus H., Bjorling L., Ponten F. (2010) Towards a knowledge-based Human Protein Atlas. Nat. Biotechnol. 28, 1248–1250 [DOI] [PubMed] [Google Scholar]
- 37. Park J. E., Lee D. H., Lee J. A., Park S. G., Kim N. S., Park B. C., Cho S. (2005) Annexin A3 is a potential angiogenic mediator. Biochem. Biophys. Res. Commun. 337, 1283–1287 [DOI] [PubMed] [Google Scholar]
- 38. Gerke V., Creutz C. E., Moss S. E. (2005) Annexins: linking Ca2+ signalling to membrane dynamics. Nat. Rev. Mol. Cell Biol. 6, 449–461 [DOI] [PubMed] [Google Scholar]
- 39. Duncan R., Carpenter B., Main L. C., Telfer C., Murray G. I. (2008) Characterisation and protein expression profiling of annexins in colorectal cancer. Br. J. Cancer 98, 426–433 [DOI] [PMC free article] [PubMed] [Google Scholar]
- 40. Mussunoor S., Murray G. I. (2008) The role of annexins in tumour development and progression. J. Pathol. 216, 131–140 [DOI] [PubMed] [Google Scholar]
- 41. Melle C., Ernst G., Schimmel B., Bleul A., Mothes H., Kaufmann R., Settmacher U., Von Eggeling F. (2006) Different expression of calgizzarin (S100A11) in normal colonic epithelium, adenoma and colorectal carcinoma. Int. J. Oncol. 28, 195–200 [PubMed] [Google Scholar]
- 42. Lewit-Bentley A., Rety S., Sopkova-de Oliveira Santos J., Gerke V. (2000) S100-annexin complexes: some insights from structural studies. Cell Biol. Int. 24, 799–802 [DOI] [PubMed] [Google Scholar]
- 43. Donato R. (2001) S100: a multigenic family of calcium-modulated proteins of the EF-hand type with intracellular and extracellular functional roles. Int. J. Biochem. Cell Biol. 33, 637–668 [DOI] [PubMed] [Google Scholar]
- 44. Thangaraju M., Carswell K. N., Prasad P. D., Ganapathy V. (2009) Colon cancer cells maintain low levels of pyruvate to avoid cell death caused by inhibition of HDAC1/HDAC3. Biochem. J. 417, 379–389 [DOI] [PubMed] [Google Scholar]
- 45. Thorn C. C., Freeman T. C., Scott N., Guillou P. J., Jayne D. G. (2009) Laser microdissection expression profiling of marginal edges of colorectal tumours reveals evidence of increased lactate metabolism in the aggressive phenotype. Gut 58, 404–412 [DOI] [PubMed] [Google Scholar]
- 46. Fan J., Hitosugi T., Chung T. W., Xie J., Ge Q., Gu T. L., Polakiewicz R. D., Chen G. Z., Boggon T. J., Lonial S., Khuri F. R., Kang S., Chen J. (2011) Tyrosine phosphorylation of lactate dehydrogenase A is important for NADH/NAD(+) redox homeostasis in cancer cells. Mol. Cell. Biol. 31, 4938–4950 [DOI] [PMC free article] [PubMed] [Google Scholar]
- 47. Koppenol W. H., Bounds P. L., Dang C. V. (2011) Otto Warburg's contributions to current concepts of cancer metabolism. Nat. Rev. Cancer 11, 325–337 [DOI] [PubMed] [Google Scholar]
- 48. Reynolds A., Parris A., Evans L. A., Lindqvist S., Sharp P., Lewis M., Tighe R., Williams M. R. (2007) Dynamic and differential regulation of NKCC1 by calcium and cAMP in the native human colonic epithelium. J. Physiol. 582, 507–524 [DOI] [PMC free article] [PubMed] [Google Scholar]
- 49. Flagella M., Clarke L. L., Miller M. L., Erway L. C., Giannella R. A., Andringa A., Gawenis L. R., Kramer J., Duffy J. J., Doetschman T., Lorenz J. N., Yamoah E. N., Cardell E. L., Shull G. E. (1999) Mice lacking the basolateral Na-K-2Cl cotransporter have impaired epithelial chloride secretion and are profoundly deaf. J. Biol. Chem. 274, 26946–26955 [DOI] [PubMed] [Google Scholar]
- 50. Schneider R., Bannister A. J., Weise C., Kouzarides T. (2004) Direct binding of INHAT to H3 tails disrupted by modifications. J. Biol. Chem. 279, 23859–23862 [DOI] [PubMed] [Google Scholar]
- 51. Kutney S. N., Hong R., Macfarlan T., Chakravarti D. (2004) A signaling role of histone-binding proteins and INHAT subunits pp32 and Set/TAF-Ibeta in integrating chromatin hypoacetylation and transcriptional repression. J. Biol. Chem. 279, 30850–30855 [DOI] [PubMed] [Google Scholar]
- 52. Seo S. B., McNamara P., Heo S., Turner A., Lane W. S., Chakravarti D. (2001) Regulation of histone acetylation and transcription by INHAT, a human cellular complex containing the set oncoprotein. Cell 104, 119–130 [DOI] [PubMed] [Google Scholar]
- 53. Kondo Y., Issa J. P. (2004) Epigenetic changes in colorectal cancer. Cancer Metastasis Rev. 23, 29–39 [DOI] [PubMed] [Google Scholar]
- 54. Kondo Y., Shen L., Issa J. P. (2003) Critical role of histone methylation in tumor suppressor gene silencing in colorectal cancer. Mol. Cell. Biol. 23, 206–215 [DOI] [PMC free article] [PubMed] [Google Scholar]
- 55. Ouellet V., Le Page C., Guyot M. C., Lussier C., Tonin P. N., Provencher D. M., Mes-Masson A. M. (2006) SET complex in serous epithelial ovarian cancer. Int. J. Cancer 119, 2119–2126 [DOI] [PubMed] [Google Scholar]
- 56. Takahashi K., Inuzuka M., Ingi T. (2004) Cellular signaling mediated by calphoglin-induced activation of IPP and PGM. Biochem. Biophys. Res. Commun. 325, 203–214 [DOI] [PubMed] [Google Scholar]
- 57. Lapeyre B., Bourbon H., Amalric F. (1987) Nucleolin, the major nucleolar protein of growing eukaryotic cells: an unusual protein structure revealed by the nucleotide sequence. Proc. Natl. Acad. Sci. U.S.A. 84, 1472–1476 [DOI] [PMC free article] [PubMed] [Google Scholar]
- 58. Ginisty H., Amalric F., Bouvet P. (1998) Nucleolin functions in the first step of ribosomal RNA processing. EMBO J. 17, 1476–1486 [DOI] [PMC free article] [PubMed] [Google Scholar]
- 59. Ginisty H., Sicard H., Roger B., Bouvet P. (1999) Structure and functions of nucleolin. J. Cell Sci. 112 (Pt 6), 761–772 [DOI] [PubMed] [Google Scholar]
- 60. Tajrishi M. M., Tuteja R., Tuteja N. (2011) Nucleolin: the most abundant multifunctional phosphoprotein of nucleolus. Commun. Integr. Biol. 4, 267–275 [DOI] [PMC free article] [PubMed] [Google Scholar]
- 61. Chien J., Fan J. B., Bell D. A., April C., Klotzle B., Ota T., Lingle W. L., Gonzalez Bosquet J., Shridhar V., Hartmann L. C. (2009) Analysis of gene expression in stage I serous tumors identifies critical pathways altered in ovarian cancer. Gynecol. Oncol. 114, 3–11 [DOI] [PubMed] [Google Scholar]
- 62. Ishiyama T., Kano J., Anami Y., Onuki T., Iijima T., Morisita Y., Yokota J., Noguchi M. (2007) OCIA domain containing 2 is highly expressed in adenocarcinoma mixed subtype with bronchioloalveolar carcinoma component and is associated with better prognosis. Cancer Sci. 98, 50–57 [DOI] [PMC free article] [PubMed] [Google Scholar]
- 63. Nagata C., Kobayashi H., Sakata A., Satomi K., Minami Y., Morishita Y., Ohara R., Yoshikawa H., Arai Y., Nishida M., Noguchi M. (2012) Increased expression of OCIA domain containing 2 during stepwise progression of ovarian mucinous tumor. Pathol. Int. 62, 471–476 [DOI] [PubMed] [Google Scholar]
- 64. Oue N., Kuniyasu H., Noguchi T., Sentani K., Ito M., Tanaka S., Setoyama T., Sakakura C., Natsugoe S., Yasui W. (2007) Serum concentration of Reg IV in patients with colorectal cancer: overexpression and high serum levels of Reg IV are associated with liver metastasis. Oncology 72, 371–380 [DOI] [PubMed] [Google Scholar]
- 65. Rafa L., Dessein A. F., Devisme L., Buob D., Truant S., Porchet N., Huet G., Buisine M. P., Lesuffleur T. (2010) REG4 acts as a mitogenic, motility and pro-invasive factor for colon cancer cells. Int. J. Oncol. 36, 689–698 [DOI] [PubMed] [Google Scholar]
- 66. Violette S., Festor E., Pandrea-Vasile I., Mitchell V., Adida C., Dussaulx E., Lacorte J. M., Chambaz J., Lacasa M., Lesuffleur T. (2003) Reg IV, a new member of the regenerating gene family, is overexpressed in colorectal carcinomas. Int. J. Cancer 103, 185–193 [DOI] [PubMed] [Google Scholar]
- 67. Obrosova I. G. (2005) Increased sorbitol pathway activity generates oxidative stress in tissue sites for diabetic complications. Antioxid. Redox Signal. 7, 1543–1552 [DOI] [PubMed] [Google Scholar]
- 68. Ola M. S., Berkich D. A., Xu Y., King M. T., Gardner T. W., Simpson I., LaNoue K. F. (2006) Analysis of glucose metabolism in diabetic rat retinas. Am. J. Physiol. Endocrinol. Metab. 290, E1057-E1067 [DOI] [PubMed] [Google Scholar]
- 69. Van den Enden M. K., Nyengaard J. R., Ostrow E., Burgan J. H., Williamson J. R. (1995) Elevated glucose levels increase retinal glycolysis and sorbitol pathway metabolism. Implications for diabetic retinopathy. Invest. Ophthalmol. Vis. Sci. 36, 1675–1685 [PubMed] [Google Scholar]
- 70. Gabbay K. H., Merola L. O., Field R. A. (1966) Sorbitol pathway: presence in nerve and cord with substrate accumulation in diabetes. Science 151, 209–210 [DOI] [PubMed] [Google Scholar]
- 71. Hwang Y. C., Bakr S., Ellery C. A., Oates P. J., Ramasamy R. (2003) Sorbitol dehydrogenase: a novel target for adjunctive protection of ischemic myocardium. FASEB J. 17, 2331–2333 [DOI] [PubMed] [Google Scholar]
- 72. Szabo Z., Hamalainen J., Loikkanen I., Moilanen A. M., Hirvikoski P., Vaisanen T., Paavonen T. K., Vaarala M. H. (2010) Sorbitol dehydrogenase expression is regulated by androgens in the human prostate. Oncol. Rep. 23, 1233–1239 [DOI] [PubMed] [Google Scholar]
- 73. Obrosova I. G. (2005) Increased sorbitol pathway activity generates oxidative stress in tissue sites for diabetic complications. Antioxid. Redox Signal. 7, 1543–1552 [DOI] [PubMed] [Google Scholar]
- 74. Dills W. L., Jr. (1993) Protein fructosylation: fructose and the Maillard reaction. Am. J. Clin. Nutr. 58, 779S-787S [DOI] [PubMed] [Google Scholar]
- 75. Suarez G., Rajaram R., Oronsky A. L., Gawinowicz M. A. (1989) Nonenzymatic glycation of bovine serum albumin by fructose (fructation). Comparison with the Maillard reaction initiated by glucose. J. Biol. Chem. 264, 3674–3679 [PubMed] [Google Scholar]
- 76. Schalkwijk C. G., Stehouwer C. D., van Hinsbergh V. W. (2004) Fructose-mediated non-enzymatic glycation: sweet coupling or bad modification. Diabetes Metab. Res. Rev. 20, 369–382 [DOI] [PubMed] [Google Scholar]
- 77. Bose T., Chakraborti A. S. (2008) Fructose-induced structural and functional modifications of hemoglobin: implication for oxidative stress in diabetes mellitus. Biochim. Biophys. Acta 1780, 800–808 [DOI] [PubMed] [Google Scholar]
- 78. Schmidt A. M., Hori O., Brett J., Yan S. D., Wautier J. L., Stern D. (1994) Cellular receptors for advanced glycation end products. Implications for induction of oxidant stress and cellular dysfunction in the pathogenesis of vascular lesions. Arterioscler. Thromb. 14, 1521–1528 [DOI] [PubMed] [Google Scholar]
- 79. Warburg O. (1956) On the origin of cancer cells. Science 123, 309–314 [DOI] [PubMed] [Google Scholar]
- 80. Chan E. C., Koh P. K., Mal M., Cheah P. Y., Eu K. W., Backshall A., Cavill R., Nicholson J. K., Keun H. C. (2009) Metabolic profiling of human colorectal cancer using high-resolution magic angle spinning nuclear magnetic resonance (HR-MAS NMR) spectroscopy and gas chromatography mass spectrometry (GC/MS). J. Proteome Res. 8, 352–361 [DOI] [PubMed] [Google Scholar]
- 81. Hirayama A., Kami K., Sugimoto M., Sugawara M., Toki N., Onozuka H., Kinoshita T., Saito N., Ochiai A., Tomita M., Esumi H., Soga T. (2009) Quantitative metabolome profiling of colon and stomach cancer microenvironment by capillary electrophoresis time-of-flight mass spectrometry. Cancer Res. 69, 4918–4925 [DOI] [PubMed] [Google Scholar]
- 82. Kudo S., Rubio C. A., Teixeira C. R., Kashida H., Kogure E., et al. (2001) Pit pattern in colorectal neoplasia: endoscopic magnifying view. Endoscopy 33, 367. [DOI] [PubMed] [Google Scholar]
Associated Data
This section collects any data citations, data availability statements, or supplementary materials included in this article.