Abstract
The lack of methodological uniformity in enzyme assays has been a long-standing difficulty, a problem for bench researchers, for the interpretation of clinical diagnostic tests, and an issue for investigational drug review. Illustrative of the problem, α-L-iduronidase enzyme catalytic activity is frequently measured with the substrate 4-methylumbelliferyl-α-L-iduronide (4MU-iduronide); however, final substrate concentrations used in different assays vary greatly, ranging from 25 μM to 1,425 μM (Km≈180 μM) making it difficult to compare results between laboratories. In this study, α-L-iduronidase was assayed with 15 different substrate concentrations. The resulting activity levels from the same specimens varied greatly with different substrate concentrations but, as a group, obeyed the expectations of Michaelis-Menten kinetics. Therefore, for the sake of improved comparability, it is proposed that α-L-iduronidase enzyme assays should be conducted either (1) under substrate saturating conditions; or (2) when concentrations are significantly below substrate saturation, with results standardized by arithmetic adjustment that considers Michaelis-Menten kinetics. The approach can be generalized to many other enzyme assays.
Keywords: Hurler syndrome, α-L-iduronidase enzyme assay, Michaelis-Menten kinetics, mucopolysaccharidosis, Lineweaver-Burk plot, α-L-iduronidase
1. Introduction
The lack of methodological uniformity in lysosomal enzyme activity assays has been a long-standing difficulty, a problem for bench researchers, for the interpretation of clinical diagnostic tests, and an issue for investigational drug review recently cited by the US Food and Drug Administration [1]. The peculiarities of different assay systems, the variation in experimental research goals, and pragmatic factors of reagent characteristics and costs are resolved for each laboratory in different ways, typically unique to that laboratory and need; however, this diversity in approach has created a plethora of assay systems and results that are not comparable between laboratories. While this need to optimize tests for individual needs has been a natural evolution, the resulting diversity also presents a barrier to comparing the conclusions of different laboratories.
As an example, measurement of α-L-iduronidase specific enzyme activity is an essential parameter for those studying mucopolysaccharidoses (MPS) type I. This enzyme is key in the catabolism of glycosaminoglycans (GAG) heparan and dermatan sulfate. Deficient enzyme activity results in lysosomal accumulation of GAG, and in the most severe form, the clinical phenotype, Hurler syndrome. Since the development of methylumbelliferone artificial substrate, 4-methylumbelliferyl-α-L-iduronide (4MU-α-L-iduronide), this has been used almost uniformly for studies of this condition. It is widely used in research, for clinical diagnostic testing, as well as in the regulatory evaluation of new therapies.
Specifically, substrate concentrations used in different labs vary greatly, from 25 μM to 1,425 μM [2–15], while the Km was found to be approximately 180 μM [16]. While higher substrate concentrations (10-fold the Km) are desirable, interference from contaminating 4MU-β-D-glucuronide, and the very high cost of 4MU-α-L-iduronide are limiting factors. Our review of prior experience (summarized in Table 1) shows that activities reported from a single lab may vary greatly. A kinetic assay method has been employed in several studies [9–11]. These studies measured the fluorescence every 10 minutes for 2 hours and terminated the reaction following a further 4–6 hours. Considering these factors, an α-L-iduronidase enzyme assay method with low cost, high accuracy and methodological standardization is desperately needed.
Table 1. Comparison of α-L-iduronidase enzyme activity in liver of heterozygous mice from different studies.
Enzyme levels were divided by 2 if only values in wild type mice were provided in the original paper (α-L-iduronidase enzyme activity in heterozygous mice are approximately half of that in wild-type individuals).
| IDUA activity (nmol/h/mg) | Final [S] (μM) | Substrate source | Adjustment | Incubation time (hour) | Reaction temperature(°C) | Ref. |
|---|---|---|---|---|---|---|
| 0.8 | 25 | CalBiochem | N | 1 | 22 | [2] |
| 2 | 25 | CalBiochem | N | 1 | 22 | [3] |
| 0.3 | 25 | Glycosynth | N | 1 | 37 | [4] |
| 0.6 | 25 | Glycosynth | N | 1 | 37 | [5] |
| 0.8 | 25 | Glycosynth | N | 1 | 37 | [6] |
| 2.5 | 25 | Glycosynth | N | 1 | 37 | [7] |
| 2.1 | 50 | CalBiochem | N | 1–6 | 37 | [8] |
| 0.8 | 50 | TRC | N | 6–8 | 37 | [9] |
| 1.6 | 50 | TRC | N | 6–8 | 37 | [10] |
| 6 | 50 | CalBiochem | N | 6–8 | 37 | [11] |
| 6.6 | 1000 | CalBiochem | N | 17 | 37 | [12] |
| 0.9 | 1425 | CalBiochem | N | 6 | 37 | [13] |
| 2.8 | 1425 | Glycosynth | N | 6 | 37 | [14] |
| 6 | 1425 | Glycosynth | N | 6 | 37 | [15] |
| 4.4 | 180 | Glycosynth | Y | 0.5 | 37 | This study |
N=NO, Y=YES.
In this study, the α-L-iduronidase enzyme activity was measured at various selected substrate concentrations. For comparison to the results of other laboratories, a commonly studied enzyme source, murine liver (from heterozygous idua−/+ mice) was chosen. The resulting values differ significantly, but fit Michaelis-Menten kinetics well. Therefore, to obtain accurate and comparable velocity (Vmax) determinations, and to achieve results that are more universally comparable, it is proposed that α-L-iduronidase enzyme assays should be conducted either under substrate saturating conditions or, when substrate concentrations are significantly below enzyme saturation, the values are adjusted by arithmetic conversion that recognizes the Michaelis-Menten model of enzyme kinetics.
2. Material and Methods
2.1 Collection of mouse samples
Founder MPS I idua knockout mice were bred in a well-established colony. Breeders (the kind gift of Dr. Elizabeth Neufeld, UCLA) had been generated by a disruptive insertion of a selectable neo construct into exon 6 of the 14-exon idua gene, and then bred on to a C57BL/6 background. Mice were genotyped by PCR and heterozygotes (idua−/+) were selected for these studies. All mouse care and handling procedures were in compliance with the rules of the Institutional Animal Care and Use Committee (IACUC) of the University of Minnesota. Harvested organs were homogenized using a Brinkman Polytron and permeabilized with 0.1% Trion X-100. Tissue homogenates were diluted with phosphate buffered saline (0.01 M, pH 7.4).
2.2 α-L-iduronidase enzyme assay
The activity of α-L-iduronidase was determined by a fluorometric assay using 4-methylumbelliferyl α-L-iduronide (Glycosynth #44076) as the substrate according to the established assay condition [17,18]. The 4MU-iduronide substrate was diluted with sodium formate buffer, 0.4 M, pH 3.5 in the narrow, well-established optimal range of pH [16,18], and at selected substrate concentrations. Then, 25 μL aliquots of substrate were mixed with 25 μL of tissue homogenates. The mixture was incubated at 37 °C for 30 min, and 200 μL glycine carbonate buffer (pH 10.4) was added to quench the reaction. α-L-iduronidase catalyzed the cleavage of the non-fluorescent substrate (4MU-iduronide) into a fluorescent product (4-MU). 4-Methylumbelliferone (4-MU, Sigma #M1381) was used to make the standard curve. The resulting fluorescence was measured using a Bio-Tek plate reader with excitation at 355 nm and emission at 460 nm. α-L-iduronidase enzyme activity was expressed in units (nmol converted to product per hour) per mg protein as determined with a Pierce protein assay kit (Fisher # PI22662). All reactions were run in triplicate.
2.3 Statistical analysis
For evaluation of differences between samples, the post hoc Tukey test was used for comparisons between paired samples, and one-way of variance (ANOVA) for comparisons between three or more samples. For evaluation of the Lineweaver-Burk plot, linear regression analysis was conducted. The linearity of this plot was determined by an adjusted R squared value and by the p value. The statistical significance level was set at p<0.05. All data analysis was conducted with SAS 9.3 (North Carolina, USA).
3. Results and discussion
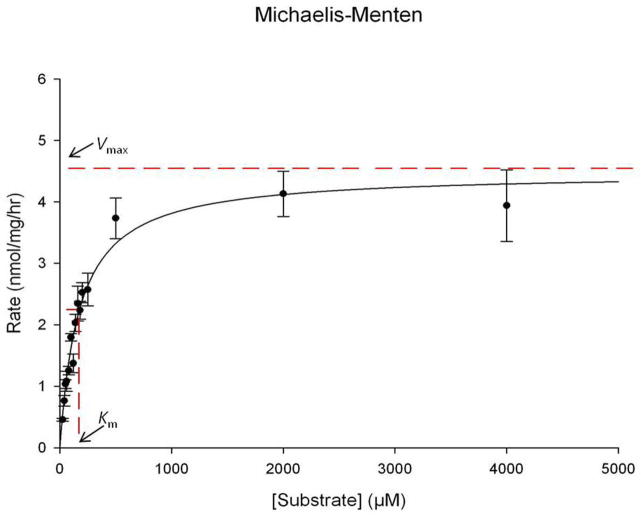
According to Michaelis-Menten kinetics [19], below substrate saturation, the velocity increases as substrate concentration increases. To evaluate this in the context of the current α-L-iduronidase enzyme assay, liver was harvested from a cohort of heterozygous mice (idua−/+, n=3) and α-L-iduronidase enzyme activity was measured with 15 different final substrate concentrations (25, 40, 50, 60, 80, 100, 120, 140, 160, 180, 200, 250, 500, 2,000 and 4,000 μM). The resulting mean activity values vary from 0.5±0.02 to 4.1±0.37 nmol/h/mg. Significant differences were found between enzyme assays using different substrate concentrations. Furthermore, these calculated values obeyed Michaelis-Menten kinetics (Figure 1). After the substrate concentrations above 2,000 μM, the velocity plateaued. From the Michaelis-Menten plot, the Vmax is approximately 4.5 nmol/h/mg, and Km is approximately 174.2 μM (V= Vmax/2). This value of Km was similar to that reported previously (Km≈180 μM) [16,17].
Figure 1. Michaelis-Menten analysis of α-L-iduronidase enzyme activity in liver from normal heterozygous mice (idua−/+).
Each point is the mean of 3 mice. The line indicates the approximate plateau that defines Vmax.
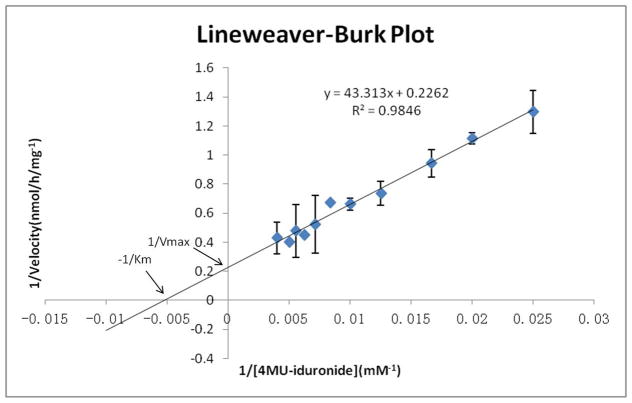
To confirm these values gave a linear fit on a Lineweaver-Burk plot and to obtain accurate Vmax and Km values [20], liver was harvested from a cohort of heterozygous mice (idua−/+, n=7) and α-L-iduronidase enzyme activity was measured for 11 different final substrate concentrations (40, 50, 60, 80, 100, 120, 140, 160, 180, 200 and 250 μM). Significant differences were again found between enzyme assays with different substrate concentrations (p<0.0001). A Lineweaver-Burk plot was made by a linear regression analysis, with a slope of 43.313 (p<0.0001), intercept of 0.226 (p<0.0001) and adjusted R squared value of 0.9829 (Figure 2). Thereby, Km and Vmax were determined (Km = 191 μM, Vmax = 4.42 nmol/h/mg). This value of Km is similar to the numbers reported previously [16] (Km≈180 μM).
Figure 2. Lineweaver-Burk analysis of α-L-iduronidase enzyme activity in liver from normal heterozygous mice (idua−/+).
Each point is the mean value from 7 mice.
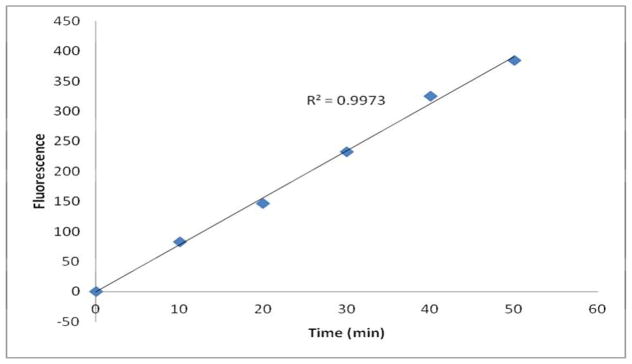
Importantly, Michaelis-Menten kinetics only applies to initial velocity. Therefore, one underlying assumption is that substrate concentration is sufficient to remain almost unchanged during the reaction ([S]≈[S0]). Elsewhere, as substrate is consumed, the velocity will decrease. To determine the appropriate incubation time, 25 μL plasma from heterozygous mice (idua−/+) were mixed with 25 μL substrate (final [S] = 180 μM). All reactions were divided into 5 groups, and one group of reactions was quenched every 10 min. After the fifth group was quenched, the fluorescence was measured (Figure 3). The resulting curve was linear (R2=0.9953), indicating that the velocity stays stable through 50 min of reaction time.
Figure 3. α-L-iduronidase enzyme assay with a final substrate concentration of 180 μM is linear through 50 min.

Five groups of reactions were quenched at different time points (10, 20, 30, 40, and 50 min), and the fluorescence was measured.
Based on these observations, it is proposed to standardize the α-L-iduronidase enzyme assay through two options: (1) conducting the α-L-iduronidase enzyme assay under substrate saturating conditions to obtain Vmax directly; or (2) conducting the α-L-iduronidase enzyme assay using a final substrate concentration of Km. To determine Vmax in this situation, the resulting values are multiplied by 2, as the Michaelis-Menten equation simplifies to when [S]=Km. Alternatively, other concentrations significantly below substrate saturation can be used and adjusted accordingly with the Michaelis-Menten equation: . Notably, when using non-saturating substrate concentrations, one must ensure that the velocity is relatively stable throughout the whole incubation time. Considering the cost of 4MU-iduronide, the latter option that utilizes lower substrate concentrations is likely to be selected frequently by researchers and in clinical settings.
This approach of arithmetic adjustment to standardize enzyme assays is broadly applicable to well-behaved bi-molecular enzyme assays that adhere to Michaelis-Menten kinetics.
Highlights.
Enzyme activities vary greatly with substrate concentration obviating important comparisons.
Activity of α-L-iduronidase obeys Michaelis-Menten kinetics.
Assays can be standardized arithmetically considering Michaelis-Menten kinetics.
Acknowledgments
The authors thank Brenda Koniar for mouse breeding, Renee Cooksley for molecular genetic analysis, Peng Liu for the illustration of Michaelis-Menten kinetics (Figure 1), Evelyn Redtree for editorial review, and Brenda Diethelm-Okita for regulatory and administrative support. This work was supported by NIH grant P01HD032652.
Abbreviations
- IDUA
α-L-iduronidase
- MPS
mucopolysaccharidoses
- MU
4-methylumbelliferyl
Footnotes
Publisher's Disclaimer: This is a PDF file of an unedited manuscript that has been accepted for publication. As a service to our customers we are providing this early version of the manuscript. The manuscript will undergo copyediting, typesetting, and review of the resulting proof before it is published in its final citable form. Please note that during the production process errors may be discovered which could affect the content, and all legal disclaimers that apply to the journal pertain.
References
- 1.Lacana E. Regulatory science and product quality perspectives for lysosomal storage diseases. Mol Genet Metab. 2013;108:S57. [Google Scholar]
- 2.Zheng Y, Rozengurt N, Ryazantsev S, Kohn DB, Satake N, Neufeld EF. Treatment of the mouse model of mucopolysaccharidosis I with retrovirally transduced bone marrow. Mol Genet Metab. 2003;79:233–244. doi: 10.1016/s1096-7192(03)00116-1. [DOI] [PubMed] [Google Scholar]
- 3.Visigalli I, Delai S, Politi LS, Di Domenico C, Cerri F, Mrak E, D’Isa R, Ungaro D, Stok M, Sanvito F, Mariani E, Staszewsky L, Godi C, Russo I, Cecere F, Del Carro U, Rubinacci A, Brambilla R, Quattrini A, Di Natale P, Ponder K, Naldini L, Biffi A. Gene therapy augments the efficacy of hematopoietic cell transplantation and fully corrects mucopolysaccharidosis type I phenotype in the mouse model. Blood. 2010;116:5130–5139. doi: 10.1182/blood-2010-04-278234. [DOI] [PMC free article] [PubMed] [Google Scholar]
- 4.Garcia-Rivera MF, Colvin-Wanshura LE, Nelson MS, Nan Z, Khan SA, Rogers TB, Maitra I, Low WC, Gupta P. Characterization of an immunodeficient mouse model of mucopolysaccharidosis type I suitable for preclinical testing of human stem cell and gene therapy. Brain Res Bull. 2007;74:429–438. doi: 10.1016/j.brainresbull.2007.07.018. [DOI] [PMC free article] [PubMed] [Google Scholar]
- 5.Wolf DA, Lenander AW, Nan Z, Braunlin EA, Podetz-Pedersen KM, Whitley CB, Gupta P, Low WC, McIvor RS. Increased longevity and metabolic correction following syngeneic BMT in a murine model of mucopolysaccharidosis type I. Bone Marrow Transplant. 2012;47:1235–1240. doi: 10.1038/bmt.2011.239. [DOI] [PMC free article] [PubMed] [Google Scholar]
- 6.Wolf DA, Lenander AW, Nan Z, Belur LR, Whitley CB, Gupta P, Low WC, McIvor RS. Direct gene transfer to the CNS prevents emergence of neurologic disease in a murine model of mucopolysaccharidosis type I. Neurobiol Dis. 2011;43:123–133. doi: 10.1016/j.nbd.2011.02.015. [DOI] [PMC free article] [PubMed] [Google Scholar]
- 7.Wolf DA, Hanson LR, Aronovich EL, Nan Z, Low WC, Frey WH, McIvor RS. Lysosomal enzyme can bypass the blood-brain barrier and reach the CNS following intranasal administration. Mol Genet Metab. 2012;106:131–134. doi: 10.1016/j.ymgme.2012.02.006. [DOI] [PubMed] [Google Scholar]
- 8.Liu Y, Xu L, Hennig AK, Kovacs A, Fu A, Chung S, Lee D, Wang B, Herati RS, Mosinger-Ogilvie J, Cai SR, Ponder KP. Liver-directed neonatal gene therapy prevents cardiac, bone, ear, and eye disease in mucopolysaccharidosis I mice. Mol Ther. 2005;11:35–47. doi: 10.1016/j.ymthe.2004.08.027. [DOI] [PubMed] [Google Scholar]
- 9.Herati RS, Ma X, Tittiger M, Ohlemiller KK, Kovacs A, Ponder KP. Improved Retroviral Vector Design Results in Sustained Expression after Adult Gene Therapy in Mucopolysaccharidosis I Mice. J Gene Med. 2008;10:972–982. doi: 10.1002/jgm.1229. [DOI] [PMC free article] [PubMed] [Google Scholar]
- 10.Ma X, Liu Y, Tittiger M, Hennig A, Kovacs A, Popelka S, Wang B, Herati R, Bigg M, Ponder KP. Improvements in Mucopolysaccharidosis I Mice After Adult Retroviral Vector–mediated Gene Therapy with Immunomodulation. Mol Ther. 2007;15:889–902. doi: 10.1038/sj.mt.6300112. [DOI] [PubMed] [Google Scholar]
- 11.Metcalf JA, Ma X, Linders B, Wu S, Schambach A, Ohlemiller KK, Kovacs A, Bigg M, He L, Tollefsen DM, Ponder KP. A Self-inactivating γ-Retroviral Vector Reduces Manifestations of Mucopolysaccharidosis I in Mice. Mol Ther. 2010;18:334–342. doi: 10.1038/mt.2009.236. [DOI] [PMC free article] [PubMed] [Google Scholar]
- 12.Di Domenico C, Villani GR, Di Napoli D, Reyero EG, Lombardo A, Naldini L, Di Natale P. Gene therapy for a mucopolysaccharidosis type I murine model with lentiviral-IDUA vector. Hum Gene Ther. 2005;16:81–90. doi: 10.1089/hum.2005.16.81. [DOI] [PubMed] [Google Scholar]
- 13.Hartung SD, Frandsen JL, Pan D, Koniar BL, Graupman P, Gunther R, Low WC, Whitley CB, McIvor RS. Correction of metabolic, craniofacial, and neurologic abnormalities in MPS I mice treated at birth with adeno-associated virus vector transducing the human alpha-L-iduronidase gene. Mol Ther. 2004;9:866–875. doi: 10.1016/j.ymthe.2004.03.011. [DOI] [PubMed] [Google Scholar]
- 14.Aronovich EL, Bell JB, Khan SA, Belur LR, Gunther R, Koniar B, Schachern PA, Parker JB, Carlson CS, Whitley CB, McIvor RS, Gupta P, Hackett PB. Systemic Correction of Storage Disease in MPS I NOD/SCID Mice Using the Sleeping Beauty Transposon System. Mol Ther. 2009;17:1136–1144. doi: 10.1038/mt.2009.87. [DOI] [PMC free article] [PubMed] [Google Scholar]
- 15.Aronovich EL, Bell JB, Belur LR, Gunther R, Koniar B, Erickson DC, Schachern PA, Matise I, McIvor RS, Whitley CB, Hackett PB. Prolonged expression of a lysosomal enzyme in mouse liver after Sleeping Beauty transposon-mediated gene delivery: implications for non-viral gene therapy of mucopolysaccharidoses. J Gene Med. 2007;9:403–415. doi: 10.1002/jgm.1028. [DOI] [PMC free article] [PubMed] [Google Scholar]
- 16.Hopwood JJ, Muller V, Smithson A, Baggett N. A fluorometric assay using 4-methylumbelliferyl α-L-iduronide for the estimation of α-L-iduronidase activity and the detection of Hurler and Scheie syndromes. Clin Chim Acta. 1979;92:257–265. doi: 10.1016/0009-8981(79)90121-9. [DOI] [PubMed] [Google Scholar]
- 17.Whitley CB, Gorlin RJ, Krivit W. A nonpathologic allele (IW) for low alpha-L-iduronidase enzyme activity vis-a-vis prenatal diagnosis of Hurler syndrome. Am J Med Genet. 1987;28:233–243. doi: 10.1002/ajmg.1320280136. [DOI] [PubMed] [Google Scholar]
- 18.Whitley CB, Ramsay NK, Kersey JH, Krivit W. Bone marrow transplantation for Hurler syndrome: assessment of metabolic correction. Birth Defects Orig Artic Ser. 1986;22:7–24. [PubMed] [Google Scholar]
- 19.Michaelis L, Menten ML. Die Kinetik der Invertinwirkung. Biochem Z. 1913;49:333–369. [Google Scholar]
- 20.Lineweaver H, Burk D. The Determination of Enzyme Dissociation Constants. J Am Chem Soc. 1934;56:658–666. [Google Scholar]


