

Abstract
Purpose
To determine whether readout-segmented echo-planar diffusion imaging (RESOLVE) improves separation of malignant versus benign lesions compared to standard single-shot echo-planar imaging (ss-EPI) on BI-RADS 4/5 lesions detected on breast MRI.
Materials and Methods
Consecutive 3T breast MRI studies with BI-RADS 4/5 designation and subsequent biopsy or benign mastectomy were retrospectively identified. Freehand ROI’s were drawn on lesions and also on normal background fibroglandular tissue for comparison. Lesion-to-background contrast was evaluated by normalizing signal intensity of the lesion ROI by the normal background tissue ROI at b=800. Statistical analysis used the Mann-Whitney/Wilcoxon rank-sum test for unpaired and Wilcoxon signed-rank for paired comparisons.
Results
Of 38 lesions in 32 patients,10 were malignant. Lesion-to-background contrast was higher on RESOLVE than ss-EPI (1.80±0.71 vs. 1.62±0.63, p=0.03). Mean ADC was the same or lower on RESOLVE than ss-EPI, and this effect was largest in malignant lesions (RESOLVE 0.90±0.13; ss-EPI 1.00±0.13; median difference −0.10 (95%CI: −0.17,−0.02) ×10−3mm2/sec; p=0.014). By either diffusion method, there was a statistically significant difference between benign and malignant mean ADC (p<0.001).
Conclusion
Increased lesion-to-background contrast and improved separation of benign from malignant lesions by RESOLVE compared to standard diffusion, suggest that RESOLVE may show promise as an adjunct to clinical breast MRI.
Keywords: Breast MRI, diffusion, DWI, screening, benign, malignant
INTRODUCTION
Many studies have now shown MRI to be highly sensitive to various forms of breast cancers, although false positive rates remain high due to average specificity (1–3). Diffusion-weighted imaging (DWI) can help to discriminate malignant from benign lesions on breast MRI, potentially increasing the specificity of the breast MRI exam (4–6). Higher field strength can improve diffusion measurement by increasing visibility of lesions (7), however, associated greater field inhomogeneity aggravates the problem of image distortion inherent to single-shot echo planar imaging (ss-EPI) diffusion imaging.
A readout-segmented diffusion imaging technique (RESOLVE) (8) permits the use of shortened echo spacing, reducing image distortion. RESOLVE is also designed to acquire data from a 2D navigator to perform nonlinear phase correction and control reacquisition of uncorrectable data in real-time. The read-out segmented technique has been shown to decrease image distortion in adult brain and pediatric brain and spine (8–10). Recently, RESOLVE has been applied in the breast (11), demonstrating increased lesion conspicuity and higher diagnostic accuracy by RESOLVE for differentiation of benign from malignant lesions in patients with previously detected suspicious clinical findings or abnormalities on mammography or ultrasound. The current study seeks to evaluate RESOLVE for suspicious lesions that have been newly detected by standard clinical breast MRI. This population contains lesions that have escaped clinical and mammographic detection, and is therefore enriched with smaller masses/foci and with non-mass enhancement. This population is therefore not only clinical relevant, but more challenging to characterize by standard diffusion methods.
The purpose of this study is to determine whether RESOLVE improves separation of malignant versus benign lesions compared to single-shot EPI diffusion imaging on BI-RADS 4 and 5 lesions detected on breast MRI, using the pathology from subsequent biopsy as the reference standard.
MATERIALS AND METHODS
Case selection
The study was approved by our institutional review board and is compliant with the Health Insurance Portability and Accountability Act. A retrospective search identified all consecutive 3T breast MRI studies with a BI-RADS 4 or 5 designation performed over a ten month period, August 2011 through May 2012. Only exams that had both RESOLVE and standard single-shot, spin-echo EPI (ss-EPI) diffusion imaging were retained. Exams in which BI-RADS 4 or 5 was given for known non-breast findings (notably axillary lymphadenopathy) were excluded. In addition, cases in which the BI-RADS 4/5 was given for biopsy-proven high-risk lesion (such as known atypical ductal hyperplasia) were excluded, as these cases already had a pathology result but required surgical excision for complete management. Finally, known biopsy-proven cancers (BI-RADS 6 lesions) were excluded. Such cancers tend to be larger and are more often palpable, and hence are less representative of the study population of interest, namely, new suspicious lesions identified by breast MRI.
Of this initial data set, only lesions with a subsequent image-directed biopsy procedure were retained unless the case went to prophylactic mastectomy and the mastectomy specimen was entirely benign, as otherwise the suspicious MRI lesion could not be reliably tracked. Such cases are uncommon as our standard of care is to obtain a percutaneous biopsy for pathologic confirmation prior to mastectomy. Any benign but high-risk pathology, such as atypia, lobular carcinoma in situ, radial scars, or papillary lesions were classified as benign unless a subsequent surgical excision demonstrated malignancy. Malignancy was defined as any invasive carcinoma or ductal carcinoma in situ (DCIS).
MRI
All examinations were performed on a 3.0 Tesla MRI wide-bore scanner (MAGNETOM Verio, Siemens Medical, USA) using a dedicated 8- or 16- channel bilateral breast coil using prone positioning (Sentinelle Medical, Toronto, Canada). The clinical breast MRI protocol consisted of a fat-suppressed T2-weighted fast spin echo sequence and a dynamic contrast-enhanced series. The latter consisted of a three dimensional fat-suppressed T1-weighted fast gradient recalled echo sequence obtained before and twice after a bolus intravenous injection of 0.1 mmol/kg gadopentetate dimeglumine at an injection rate of 1.2 mL/second (Magnevist; Bayer HealthCare Pharmaceuticals, Wayne, New Jersey), using 180-second acquisition time. Diffusion sequences were obtained following the dynamic post contrast acquisition, at least 8 minutes post-injection, varying the order of the ss-EPI and RESOLVE sequence. Both the ss-EPI and RESOLVE were designed with an in-plane resolution of 1.8 × 1.8 mm2, slice thickness 2.4 mm with no gap, and enough slices to cover both breasts (47–50) in the axial dimension. The RESOLVE sequence used 5 readout segments. Echo-spacing was 0.32 ms for RESOLVE and 0.76 ms for ss-EPI. In order to match acquisition time between sequences at approximately 5 minutes, ss-EPI contained 8 averages and RESOLVE had 1. The remainder of the imaging parameters were as follows: TR/TE = 7500–10000/60 ms (ss-EPI) and 8000–12000/64 ms (RESOLVE), matrix 192×184 (ss-EPI) and 192×86 (RESOLVE), FOV 35.0×15.3 cm (ss-EPI) and 35.0 × 15.7 cm (RESOLVE), acceleration factor of 2 using GRAPPA (k domain processing) for both sequences, and b-values 0 and 800 s/mm2. Spectrally selective fat suppression was used for both diffusion sequences.
Data processing and statistics
Using post-contrast T1-weighted images for reference, a single board-certified radiologist fellowship trained in breast imaging with 6 years of experience (DJW) drew a single freehand ROI’s within the borders of each suspicious lesion based on the b800 maps using in-house designed software on the IDL platform (IDL, Exelis Visual Information Solutions, Boulder, CO). Cystic/necrotic areas were avoided by avoiding areas of T2-shine through (bright on both diffusion and ADC maps), referring to T2-weighted and post-contrast images when necessary. The freehand ROI was carefully matched to the lesion shape as visible on each diffusion sequence. Both diffusion sequences were viewed at the same time so that ROIs would have similar areas. Within each b800 map, the ROI shape was copied and then placed centrally on normal contralateral fibroglandular tissue as a measurement of background normal tissue. A similar method has been described by Ei Khouli, et al(6). If no contralateral breast tissue was available (in cases of mastectomy) the ROI shape was copied onto normal ipsilateral breast tissue. These ROI’s were applied to both b800 maps and to corresponding ADC maps. Cases were assessed visually, and those with complete fat saturation failure in the area of interest were excluded.
ADC and b800 signal characteristics were recorded for each lesion and corresponding normal fibroglandular tissue ROI using both RESOLVE and ss-EPI diffusion sequences. Statistical analysis was performed using the Mann-Whitney/Wilcoxon rank-sum test for unpaired data comparing ADC values between benign and malignant lesions, and the Wilcoxon sign-rank test for paired RESOLVE and ss-EPI diffusion measurements within each patient. Statistical significance was considered at the level of α=5% throughout. We treated all lesions as independent observations for analysis purpose even though six of the 32 patients had two lesions. We made the within-subject independence assumption because a) statistical modeling of the within-subject correlation when there are so few subjects with multiple lesions is barely feasible and b) we preferred to use a non-parametric approach in order to avoid making assumptions about normality.
RESULTS
Between August 1, 2012 and May 1, 2013, 103 diagnostic breast 3T breast MRI exams were successfully acquired. Of these, 26 were excluded as normal or benign exams and 5 were excluded because the only finding was a known (BI-RADS 6) breast cancer. Per the established practice of the institution, there were no breast MRI exams with a BI-RADS 0 or 3 assessment. Of the remaining 72 MRI exams with a BI-RADS 4 or 5 assessment category, 6 were excluded because the assessment was given for a known high-risk lesion or for axillary lymphadenopathy, and 9 were excluded because one or the other diffusion sequence was not acquired. An additional 21 exams were excluded because a subsequent pathologic result was not clearly established for the lesion by either a (a) image-directed biopsy procedure or (b) prophylactic mastectomy with proven benign pathology. This produced a total of 43 BI-RADS 4 or 5 lesions identified on 36 breast MRI exams.
Of these 43 MRI lesions, 3 lesions on 2 exams were excluded due to fat-saturation failure on either the standard DWI (1 exam) or the RESOLVE DWI (1 exam). Finally, 2 cystic lesions on two MRI exams were excluded because of lack of an appreciable solid component that could be measured separate from the cystic portion. The final cohort consisted of 38 lesions in 32 patients. Average patient age was 50 years (range: 35–83). Mean time to biopsy was 17 days (range: 12–22).
Lesion Pathology
At biopsy, 10 lesions proved to be malignant (26%; Table 1). Malignant pathology included invasive lobular carcinoma, invasive ductal carcinoma, ductal carcinoma in situ (DCIS), and adenocarcinoma not otherwise defined. The latter result was obtained from ultrasound-guided fine needle aspiration with no further pathology available at our institution. Among the benign cases, there were 5 cases of atypia without subsequent demonstration of malignancy, and one case of LCIS. In addition, 2 lesions were no longer present at time of biopsy and were hence deemed benign. Both of these cases had a negative or benign follow-up breast MRI dated 6 months or later from the date of attempted biopsy.
Table 1.
Final pathology of included BI-RADS 4 and 5 lesions.
| Pathology | Number (Percentage) |
|---|---|
| Benign | 28 (74%) |
| Lesion resolved at time of biopsy | 2 |
| Atypia (ALH, ADH, FEA) | 5 |
| LCIS | 1 |
| Fibrocystic change or fibroadenoma | 7 |
| Usual ductal hyperplasia | 4 |
| Chronic inflammation | 1 |
| Apocrine metaplasia | 1 |
| Lactational change | 1 |
| PASH | 2 |
| Lymph node | 1 |
| Benign breast tissue, NOS | 3 |
| Malignant | 10 (26%) |
| Invasive ductal carcinoma | 4 |
| Invasive lobular carcinoma | 3 |
| DCIS | 1 |
| Adenocarcinoma, NOS | 2 |
| Total | 38 (100%) |
DCIS ductal carcinoma in situ; LCIS lobular carcinoma in situ; ADH atypical ductal hyperplasia; ALH atypical lobular hyperplasia; FEA flat epithelial atypia; PASH pseudoangiomatous stromal hyperplasia
There were 6 patients that had two lesions each. Of these, 5 patients had lesions located in contralateral breasts. The remaining patient had 2 lesions located in the same breast; these lesions had opposite outcome (one lesion was benign and the other malignant).
Lesion Characteristics on Dynamic Contrast Enhanced MRI
Half of the lesions presented as masses (19/38), whereas a quarter presented as foci (9/38), and a quarter as non-mass enhancement (10/38) (Table 2). When documented, maximum lesion diameter ranged from 4–64 mm, averaging 13 mm for all lesions and 11 mm for masses. The larger diameters encountered in the study were from non-mass areas of enhancement. There was no significant difference between the documented maximum diameter of benign and malignant lesions (mean ± standard deviation: benign 12 ± 14 mm; malignant 14 ± 8 mm; p=0.7). Of the lesions that eventually returned malignant pathology, most presented as masses (8/10), although a 4-mm focus and an 8-mm area of non-mass enhancement also proved to be malignant. Kinetics of the malignant lesions varied widely, and were as likely to exhibit persistent delayed enhancement (3/10) as to exhibit washout (3/10).
Table 2.
Lesion characteristics of included BI-RADS 4 and 5 lesions.
| Demographic variable | Total | Benign | Malignant |
|---|---|---|---|
| Lesion type, number of lesions | |||
| Focus | 9 | 8 | 1 |
| Mass | 19 | 11 | 8 |
| Non-mass | 10 | 9 | 1 |
| Lesion maximum diameter, mean (range) in mm | |||
| Focus | 4.5 (4–6) | 4.6 (4–6) | 4 |
| Mass | 11 (5–27) | 8 (5–13) | 16 (6–27) |
| Non-mass | 26 (8–64) | 29.5 (10–64) | 8 |
| Lesion Kinetics*, number of lesions | |||
| Persistent | 18 | 15 | 3 |
| Plateau | 1 | -- | 1 |
| Washout | 6 | 3 | 3 |
| Not described | 13 | 10 | 3 |
| Biopsy method, number of lesions | |||
| MRI Core | 26 | 21 | 5 |
| MRI Wire Localization | 2 | 2 | -- |
| Stereotactic Core | 1 | 1 | -- |
| Ultrasound Core | 4 | 1 | 3 |
| Ultrasound Fine Needle Aspiration | 4 | 2 | 2 |
| Benign (prophylactic) mastectomy | 1 | 1 | -- |
Using ‘worst’ curve analysis.
Comparison of Lesion-to-Background Contrast
On diffusion images, the lesion-to-background contrast ratio was used to quantify the relative contrast of the lesion on b800 maps compared to background fibroglandular tissue. Using this method, RESOLVE had a higher mean lesion-to-background contrast ratio than ss-EPI, (ratio of 1.80±0.71 for RESOLVE, 1.62±0.63 for ss-EPI, Table 3). To test for a statistically significant difference between sequences, the difference between paired diffusion measurements was tracked. Subtraction was performed such that the ss-EPI measurement was always subtracted from the RESOLVE measurement. The median difference (assuming symmetry of the distribution) between paired RESOLVE and ss-EPI lesion-to-background contrast ratios revealed a significant difference between paired contrast ratios of the two sequences, favoring higher contrast ratios using RESOLVE (median difference 0.11 (95%CI: 0.01, 0.22); p=0.031).
Table 3.
Comparison of RESOLVE and standard (ss-EPI) diffusion methods.
| N | RESOLVE (Mean ± SD) | ss-EPI | Median difference (95% CI) | pwsr | |
|---|---|---|---|---|---|
| Lesion to Background Signal Intensity Ratio | |||||
| All lesions | 38 | 1.80 ± 0.71 | 1.62 ± 0.63 | 0.11 (0.01, 0.22) | 0.031 |
| Mean ADC (10−3 mm2/s) | |||||
| Normal Tissue | 38 | 1.76 ± 0.05 | 1.78 ± 0.05 | −0.04 (−0.08, 0.00) | 0.035 |
| Lesion: | |||||
| Benign | 28 | 1.37 ± 0.29 | 1.43 ± 0.25 | −0.07 (−0.12, −0.01) | 0.025 |
| Malignant | 10 | 0.90 ± 0.13 | 1.00 ± 0.13 | −0.10 (−0.17, −0.02) | 0.014 |
| Pmw | <0.001 | <0.001 | |||
| 5% Percentile ADC (10−3 mm2/s) | |||||
| Normal Tissue | 38 | 1.53 ± 0.06 | 1.57 ± 0.06 | −0.05 (−0.10, 0.00) | 0.050 |
| Lesion: | |||||
| Benign | 28 | 1.10 ± 0.26 | 1.15 ± 0.26 | −0.07 (−0.14, +0.01) | 0.065 |
| Malignant | 10 | 0.56 ± 0.22 | 0.66 ± 0.18 | −0.11 (−0.22, +0.01) | 0.084 |
| Pmw | <0.001 | <0.001 | |||
| 50% Percentile ADC (10−3 mm2/s) | |||||
| Normal Tissue | 38 | 1.73 ± 0.05 | 1.74 ± 0.06 | −0.03 (−0.07, +0.02) | 0.220 |
| Lesion: | |||||
| Benign | 28 | 1.31 ± 0.33 | 1.37 ± 0.30 | −0.06 (−0.14, −0.01) | 0.026 |
| Malignant | 10 | 0.84 ± 0.13 | 0.97 ± 0.17 | −0.12 (−0.24, −0.04) | 0.037 |
| Pmw | <0.001 | <0.001 | |||
| 95% Percentile ADC (10−3 mm2/s) | |||||
| Normal Tissue | 38 | 1.89 ± 0.05 | 1.89 ± 0.06 | −0.02 (−0.07, +0.04) | 0.379 |
| Lesion: | |||||
| Benign | 28 | 1.52 ± 0.35 | 1.60 ± 0.32 | −0.09 (−0.16, −0.02) | 0.012 |
| Malignant | 10 | 1.07 ± 0.22 | 1.19 ± 0.11 | −0.09 (−0.30, +0.04) | 0.106 |
| Pmw | 0.001 | <0.001 | |||
Median difference: estimated median (assuming symmetry of the distributions) and 95% confidence interval of the difference between paired measurements, (RESOLVE – ss-EPI). Note that if the distribution is not symmetric, the estimate is of the (pseudo-) median rather than median.
SD: Standard Deviation
Pmw: p-value based on Mann-Whitney/Wilcoxon rank-sum test comparing measurements between benign and malignant lesions.
Pwsr: p-value based on Wilcoxon signed-rank test of paired RESOLVE and ss-EPI measurements within each MRI exam.
Comparison of ADC Values: Benign versus Malignant
Using either ss-EPI or RESOLVE, the mean ADC of malignant lesions was significantly lower than that of benign lesions (RESOLVE: malignant 0.90 ± 0.13 ×10⁻³ mm2/s, RESOLVE benign: 1.37 ± 0.29 ×10⁻³ mm2/s, p<0.001; ss-EPI malignant: 1.00 ± 0.13 × 10⁻³ mm2/s, ss-EPI benign: 1.43 ± 0.25 × 10⁻³ mm2/s, p<0.001; Table 3). As shown both in Table 3 and Figure 1, malignant lesions demonstrated the lowest mean ADC values (RESOLVE: 0.90 ± 0.13 ×10⁻³ mm2/s; ss-EPI: 1.00 ± 0.13 × 10⁻³ mm2/s), benign lesions had intermediate mean ADC values (RESOLVE: 1.37 ± 0.29 ×10⁻³ mm2/s; ss-EPI: 1.43 ± 0.25 × 10⁻³ mm2/s), and ROI’s drawn in normal tissue demonstrated higher mean ADC than either benign or malignant lesions (RESOLVE: 1.76 ± 0.05 × 10⁻³ mm2/s; ss-EPI 1.78 ± 0.05 × 10⁻³ mm2/s). Average ROI area was well matched between RESOLVE and ss-EPI sequences for benign lesions (mean ± standard deviation: 0.6 ± 1.0 cm2 for both), malignant lesions (0.5 ± 0.5 cm2 for both), and normal tissue (0.6 ± 0.1 cm2 for both).
Figure 1. Comparison of ADC values obtained by standard (ss-EPI) versus RESOLVE.

Box plot demonstrating mean ADC distribution for normal, benign, and malignant breast tissue using the ss-EPI and RESOLVE diffusion methods. The whiskers extend to the most extreme values inside the range defined as 1.5 times the interquartile range. All data points outside this range are plotted as outliers, but were included in the standard deviation calculations of Table 3. For both ss-EPI and RESOLVE diffusion, normal breast tissue demonstrates the highest ADC values. Benign lesions had intermediate ADC values. Malignant lesions had the lowest ADC values, and demonstrated the largest paired differences between RESOLVE and ss-EPI.
Comparison of ADC Values: RESOLVE versus ss-EPI
The distribution of ADC values obtained by RESOLVE versus ss-EPI is shown by box plot in Figure 1. Within benign lesion, malignant lesion, and normal tissue categories, the mean ADC measurements were lower by RESOLVE than by ss-EPI. The greatest difference between the RESOLVE and ss-EPI-derived mean ADC was in the malignant lesion category (RESOLVE 0.90 ± 0.13 × 10⁻³ mm2/s, ss-EPI 1.00 ± 0.13 × 10⁻³ mm2/s, Table 3). To test for statistically significant differences between the sequences, the differences between paired diffusion measurements was again tracked, subtracting the ss-EPI ADC measurement from the RESOLVE ADC measurement for each pair. The median difference between these paired ADC measurements in the malignant category demonstrated a significant difference in ADC values obtained by the two different diffusion methods, favoring lower ADC measurements by RESOLVE (−0.10 (95%CI: −0.17, −0.02) × 10−3 mm2/sec; p=0.01). In contrast, normal tissue demonstrated much smaller median differences between paired RESOLVE and ss-EPI measurements (−0.04 (95%CI:−0.08, 0.00) × 10−3 mm2/sec; p=0.04).
To further investigate the differences in the distribution of ADC values for RESOLVE and ss-EPI, the 5th, 95th, and 50th percentiles were compared between diffusion sequences. In all three percentiles, the RESOLVE ADC values were the same or lower than ss-EPI ADC values (Table 3). Within each of the 5th, 95th, and 50th percentile groups, the malignant category consistently demonstrated the largest median difference between sequences, although only the 50% percentile group had a significant p value (p=0.04). Of note, all three percentile groups demonstrated a significant difference between malignant and benign lesions similar to that seen for the mean ADC, regardless of diffusion method.
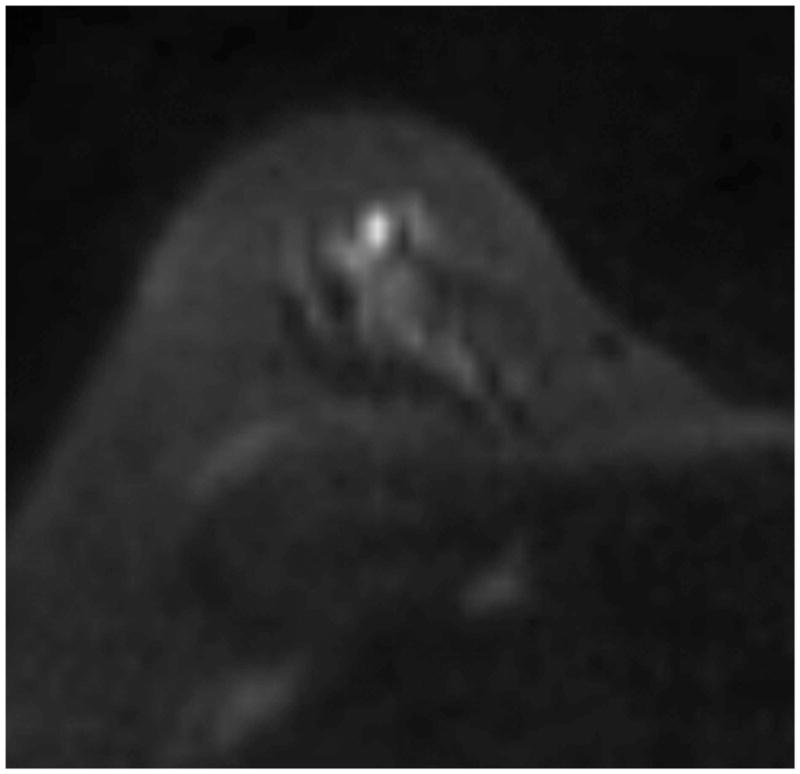
Two examples are presented of suspicious lesions detected on post-contrast T1 MRI (Figure 2a and 3a), however one revealed subsequent malignant and the other benign pathology. RESOLVE generally demonstrated higher lesion-to-background contrast on b800 maps, although the degree of improvement varied (Figure 2b and 3b). For Figure 2, both diffusion methods demonstrated suspicious mean ADC values, although RESOLVE yielded a lower ADC value (0.861 × 10⁻³ mm2/sec by RESOLVE and 1.038 × 10⁻³ mm2/sec by ss-EPI) and better lesion-to-background contrast. This case ultimately proved to be malignant. For Figure 3, the lesion is visible on b800 of both diffusion sequences, however the resulting ADC maps revealed intermediate mean ADC values of 1.241 × 10⁻³ mm2/sec by RESOLVE and 1.413 × 10⁻³ mm2/sec by ss-EPI; this case ultimately proved to be benign.
Figure 2. Example of suspicious lesion, found to be malignant.


Malignant lesion as identified on the axial post-contrast T1 images (a), and on b800 maps using RESOLVE (b) and standard diffusion (ss-EPI) (d). T2 images (not shown) did not demonstrate evidence of T2 shine-through. Window-leveling between RESOLVE and ss-EPI images is equalized on both b800 and ADC images. The lesion-to-background contrast is higher on RESOLVE than ss-EPI b800. Resulting ADC maps reveal a mean ADC of 0.861 × 10⁻³ mm2/sec by RESOLVE (c) and 1.038 × 10⁻³ mm2/sec by ss-EPI (e). Pathology demonstrated 6-mm grade 2 invasive ductal carcinoma.
Figure 3. Example of suspicious lesion, found to be benign.


Benign lesion as identified on the axial post-contrast T1 images (a), and on b800 maps using RESOLVE (b) and standard diffusion (ss-EPI) (d). T2 images (not shown) did not demonstrate evidence of T2 shine-through. Window-leveling between RESOLVE and ss-EPI images is equalized on both b800 and ADC images. RESOLVE demonstrates slightly less banding at fibroglandular-fat interfaces. Resulting ADC maps reveal a mean ADC of 1.241 × 10⁻³ mm2/sec by RESOLVE (c) and 1.413 × 10⁻³ mm2/sec by ss-EPI (e). Pathology demonstrated usual ductal hyperplasia.
DISCUSSION
This study found that mean ADC obtained by RESOLVE had increased separation of malignant from benign lesions among suspicious lesions detected on breast MRI, when compared with conventional ss-EPI diffusion. This increased separation was due to a significantly lower ADC value measured by RESOLVE within malignant lesions. ADC values measured in benign lesions and normal breast tissue were more similar to those obtained by standard diffusion. Despite these differences, the ADC values obtained for normal background tissue, benign lesions, and malignant lesions in this study are in keeping with the ranges seen in current literature (6,11,12).
In our study, RESOLVE demonstrated greater lesion contrast compared to normal tissue than ss-EPI diffusion, similar to observations reported in another recent study (11). We were particularly interested in testing RESOLVE in a population of lesions that we would normally detect during the course of clinical breast MRI. For this reason, we only included new MRI-detected BI-RADS 4/5 lesions. Having escaped detection by physical exam and screening mammography, MRI-detected cancers are often small, or consist of non-mass enhancement that does not have a clear correlate at mammography (such as suspicious calcifications). Indeed, the mean lesion size of the current study was very small (13 mm). Since small lesions and non-mass enhancement are especially prone to volume-averaging effects, they are often challenging for breast diffusion imaging, which often uses larger voxel sizes than the dynamic contrast enhanced portion of the exam. For diffusion imaging to have a measurable impact on the clinical exam, it must reliably visualize and characterize these challenging lesions. Hence, it is valuable to test diffusion sequences directly on this population, which would benefit most from robust diffusion data that could potentially change management decisions.
It has been previously reported that RESOLVE tends to preserve anatomic detail better than ss-EPI because T2* blurring is reduced. This feature of RESOLVE has been reported in pediatric brain (8), and recently in breast (11). We speculate that in the case of malignant lesions near normal fibroglandular tissue, this decreased blurring effectively preserves the lower ADC values in the cancer by decreasing averaging with adjacent normal tissues. The effect would be similar in benign lesions, although less pronounced given the higher ADC values in benign lesions, and the wider range of ADC values corresponding to the great assortment of ‘benign’ pathology. We found this to be the case in our study, which found that benign lesions had lower ADC values on RESOLVE than ss-EPI. However, the effect was most pronounced among the malignant lesions, presumably because of the lower ‘true’ ADC at their core.
Our diffusion images were obtained after the acquisition of the dynamic contrast enhanced portion of the exam, raising the question of how contrast affects diffusion imaging in the breast. The effect of contrast on the current study was minimized by obtaining the diffusion sequences in the very late post contrast phase (more than 8 minutes after injection), and varying the order of the diffusion sequences. Studies on the effect of gadolinium-DTPA on brain lesions have shown near-normalization of the ADC in the late post-contrast period, obtained at a mean time of 6.75 minutes (5–10 min range) after the first post-contrast scan (13). Although the use of DWI in the post-contrast setting has not been widely studied in breast, it has been shown by some to have a negligible effect on ADC (14) and by others to further decrease the ADC value of malignant lesions (15), potentially improving the separation of benign from malignant lesions. Multiple studies have found DWI in the post-contrast setting to discriminate successfully between benign and malignant lesions (5,14,16–18). In practice, many groups choose to place the diffusion at the end of the exam because of the critical importance of the dynamic contrast enhanced images, hence the effect of contrast on breast diffusion deserves further study.
Because we were primarily interested in small lesions, we found slice thickness to be a limiting factor for visualizing these smaller lesions, even when in-plane resolution was optimized. Early in our experience with RESOLVE, we found that lesions would often volume-average with tissue above and below the lesion at a higher slice thickness (5-mm), often completely obscuring smaller lesions. Decreasing our slice thickness to 2.4-mm greatly improved this issue.
This study was limited to a small, retrospective study at a single institution. Findings should be confirmed in a larger, prospective study. Within our series of 10 cancers, only 1 was DCIS, hence the question of whether RESOLVE would perform as well for in situ carcinomas remains open and will require more study. Finally, statistical analysis was performed without explicitly modeling within-subject correlation for the 6 patients that each had two lesions; the main rationale for making this assumption is given in the methods section. We also observed that most of these patients had lesions in different breasts (5 patients), and that the remaining patient had opposite outcome for the two lesions located in a single breast. This heterogeneity in location and outcome across lesions indicates that the within-subject correlation was not particularly strong and therefore the independent lesion assumption might be reasonable. We will address these limitations in future studies with larger patient numbers.
In conclusion, our results suggest increased separation of benign from malignant lesions using ADC values obtained by RESOLVE compared to standard diffusion. It is expected that additional data will further support RESOLVE as a robust, high-resolution diffusion-weighted imaging technique at 3T. The improved detail and decreased image distortion available with this method has potential clinical utility as an adjunct to dynamic-contrast-enhanced breast MRI.
Acknowledgments
Grant Support
This work was supported in part by two grants, Komen SAC 110017 and NIH R01 CA 116182.
References
- 1.Kuhl CK, Schrading S, Bieling HB, Wardelmann E, Leutner CC, Koenig R, et al. MRI for diagnosis of pure ductal carcinoma in situ: a prospective observational study. Lancet. 2007 Aug 11;370(9586):485–92. doi: 10.1016/S0140-6736(07)61232-X. [DOI] [PubMed] [Google Scholar]
- 2.Medeiros LR, Duarte CS, Rosa DD, Edelweiss MI, Edelweiss M, Silva FR, et al. Accuracy of magnetic resonance in suspicious breast lesions: a systematic quantitative review and meta-analysis. Breast Cancer Res Treat. 2011 Apr;126(2):273–85. doi: 10.1007/s10549-010-1326-9. [DOI] [PubMed] [Google Scholar]
- 3.DeMartini W, Lehman C, Partridge S. Breast MRI for cancer detection and characterization: a review of evidence-based clinical applications. Acad Radiol. 2008 Apr;15(4):408–16. doi: 10.1016/j.acra.2007.11.006. [DOI] [PubMed] [Google Scholar]
- 4.Kul S, Cansu A, Alhan E, Dinc H, Gunes G, Reis A. Contribution of diffusion-weighted imaging to dynamic contrast-enhanced MRI in the characterization of breast tumors. AJR American journal of roentgenology. 2011 Jan;196(1):210–7. doi: 10.2214/AJR.10.4258. [DOI] [PubMed] [Google Scholar]
- 5.Partridge SC, Mullins CD, Kurland BF, Allain MD, DeMartini WB, Eby PR, et al. Apparent diffusion coefficient values for discriminating benign and malignant breast MRI lesions: effects of lesion type and size. AJR American journal of roentgenology. 2010 Jun;194(6):1664–73. doi: 10.2214/AJR.09.3534. [DOI] [PubMed] [Google Scholar]
- 6.Ei Khouli RH, Jacobs MA, Mezban SD, Huang P, Kamel IR, Macura KJ, et al. Diffusion-weighted imaging improves the diagnostic accuracy of conventional 3.0-T breast MR imaging. Radiology. 2010 Jul;256(1):64–73. doi: 10.1148/radiol.10091367. [DOI] [PMC free article] [PubMed] [Google Scholar]
- 7.Matsuoka A, Minato M, Harada M, Kubo H, Bandou Y, Tangoku A, et al. Comparison of 3.0-and 1.5-tesla diffusion-weighted imaging in the visibility of breast cancer. Radiation medicine. 2008 Jan;26(1):15–20. doi: 10.1007/s11604-007-0187-6. [DOI] [PubMed] [Google Scholar]
- 8.Porter DA, Heidemann RM. High resolution diffusion-weighted imaging using readout-segmented echo-planar imaging, parallel imaging and a two-dimensional navigator-based reacquisition. Magn Reson Med. 2009 Aug;62(2):468–75. doi: 10.1002/mrm.22024. [DOI] [PubMed] [Google Scholar]
- 9.Holdsworth SJ, Yeom K, Skare S, Gentles AJ, Barnes PD, Bammer R. Clinical application of readout-segmented- echo-planar imaging for diffusion-weighted imaging in pediatric brain. AJNR Am J Neuroradiol. 2011 Aug;32(7):1274–9. doi: 10.3174/ajnr.A2481. [DOI] [PMC free article] [PubMed] [Google Scholar]
- 10.Hayes LL, Jones RA, Palasis S, Aguilera D, Porter DA. Drop metastases to the pediatric spine revealed with diffusion-weighted MR imaging. Pediatr Radiol. 2012 Aug;42(8):1009–13. doi: 10.1007/s00247-011-2295-9. [DOI] [PubMed] [Google Scholar]
- 11.Bogner W, Pinker-Domenig K, Bickel H, Chmelik M, Weber M, Helbich TH, et al. Readout-segmented echo-planar imaging improves the diagnostic performance of diffusion-weighted MR breast examinations at 3.0 T. Radiology. 2012 Apr;263(1):64–76. doi: 10.1148/radiol.12111494. [DOI] [PubMed] [Google Scholar]
- 12.Bogner W, Gruber S, Pinker K, Grabner G, Stadlbauer A, Weber M, et al. Diffusion-weighted MR for differentiation of breast lesions at 3.0 T: how does selection of diffusion protocols affect diagnosis? Radiology. 2009 Nov;253(2):341–51. doi: 10.1148/radiol.2532081718. [DOI] [PubMed] [Google Scholar]
- 13.Firat AK, Sanli B, Karakaş HM, Erdem G. The effect of intravenous gadolinium-DTPA on diffusion-weighted imaging. Neuroradiology. 2006 Jul;48(7):465–70. doi: 10.1007/s00234-006-0091-2. [DOI] [PubMed] [Google Scholar]
- 14.Rubesova E, Grell A-S, De Maertelaer V, Metens T, Chao S-L, Lemort M. Quantitative diffusion imaging in breast cancer: a clinical prospective study. Journal of magnetic resonance imaging: JMRI. 2006 Aug;24(2):319–24. doi: 10.1002/jmri.20643. [DOI] [PubMed] [Google Scholar]
- 15.Yuen S, Yamada K, Goto M, Nishida K, Takahata A, Nishimura T. Microperfusion-induced elevation of ADC is suppressed after contrast in breast carcinoma. Journal of magnetic resonance imaging: JMRI. 2009 May;29(5):1080–4. doi: 10.1002/jmri.21743. [DOI] [PubMed] [Google Scholar]
- 16.Partridge SC, DeMartini WB, Kurland BF, Eby PR, White SW, Lehman CD. Quantitative diffusion-weighted imaging as an adjunct to conventional breast MRI for improved positive predictive value. AJR American journal of roentgenology. 2009 Dec;193(6):1716–22. doi: 10.2214/AJR.08.2139. [DOI] [PubMed] [Google Scholar]
- 17.Pereira FPA, Martins G, Figueiredo E, Domingues MNA, Domingues RC, da Fonseca LMB, et al. Assessment of breast lesions with diffusion-weighted MRI: comparing the use of different b values. AJR American journal of roentgenology. 2009 Oct 1;193(4):1030–5. doi: 10.2214/AJR.09.2522. [DOI] [PubMed] [Google Scholar]
- 18.Peters NHGM, Vincken KL, van den Bosch MAAJ, Luijten PR, Mali WPTM, Bartels LW. Quantitative diffusion weighted imaging for differentiation of benign and malignant breast lesions: the influence of the choice of b-values. Journal of magnetic resonance imaging: JMRI. 2010 May;31(5):1100–5. doi: 10.1002/jmri.22152. [DOI] [PubMed] [Google Scholar]