

Abstract
A biosensor has been developed with a photonic crystal structure used in a total-internal-reflection (PC-TIR) configuration for label-free detection of a cardiac biomarker: Troponin I (cTnI). In contrast to a conventional optical microcavity that has a closed structure with its cavity layer sandwiched between two high-reflection surfaces, the PC-TIR configuration creates a unique open microcavity, which allows its cavity layer (sensing layer) to be easily functionalized and directly exposed to analyte molecules for bioassays. In this study, a PC-TIR sensor has been used for the label-free measurements of cardiac biomarkers by monitoring the changes in the resonant condition of the cavity due to biomolecular binding processes. Antibodies against cTnI are immobilized on the sensor surface for specific detection of cTnI with a wide range of concentrations. Detection limit of cTnI with a concentration as low as 0.1 ng mL−1 has been achieved.
Keywords: Optical biosensor, bioassay, optical microcavity, myocardial infarction
1. Introduction
Myocardial infarction (MI), commonly known as a heart attack, is a major cause of morbidity and mortality worldwide. Approximately one million people in the United States along suffer heart attacks each year (Go et al. 2013). MI is primarily due to ruptures or erosion of vulnerable plaques in the coronary arteries, which cause partial or complete occlusion of blood supply to a part of the heart and damage heart muscles. In spite of a better awareness of manifesting symptoms, approximately 250,000 people die each year before they can be admitted to a hospital, and over 50% of these individuals die from sudden cardiac death. This is because many victims do not know that they are already suffering fatal arrhythmias and are at high risks for impending heart attacks (Aziz et al. 2010, Zipes and Wellens 1998). However, the survival rate for patients hospitalized with MI improves if treatment begins within 1 hour after a heart attack (Go et al. 2013). Therefore, early diagnosis of MI and prompt medical response are of paramount importance for patient survival.
When a heart muscle is damaged or dies, cellular membranes lose integrity and release intracellular biomolecules, often referred to as cardiac biomarkers, into the bloodstream, thus leading to an elevation of biomarker concentrations in blood samples. For more than a decade, cardiac troponin I (cTnI) is one of the most widely used biomarkers, due to its nearly complete cardiac tissue specificity and its long serum half-life (Babuin and Jaffe 2005, Reichlin et al. 2009, Scharnhorst et al. 2011). Clinical data indicated that subjects with even minor elevations of cTnI are at increased risk of premature MI (Palla et al. 2011). When a patient with chest pain is seen in the emergency room, blood is routinely drawn to detect any rise in cardiac biomarker concentrations due to heart muscle damages. In 2000, the World Health Organization (WHO) set forth refined MI diagnostic criteria, giving more prominence to blood testing (Alpert et al. 2000). According to the new guidelines, a cTnl rise in blood testing accompanied by ST elevation/depression in electrocardiogram (ECG) is diagnostic of MI. Although ECG can be easily obtained within minutes at point of patient care, blood testing of cTnI in current clinical practice is time consuming and represents a bottleneck for prompt triage of MI patients.
Analytical techniques that may be employed for cardiac biomarker detection include enzyme linked immunesorbent assay (ELISA) and high performance liquid chromatography (HPLC). However, the blood testing of cTnI and other cardiac biomarkers using these methods has slow turnaround time in obtaining lab results in the current clinical practice. Assay turnaround time may range from hours to days due to laborious bio-analytical methodologies and logistical delays in the transportation of samples between clinical settings and central labs. Although some commercially available test kits for cTnI (Roche; Basel, Switzerland) can provide fast point-of-care assays, detection with these kits usually provides only qualitative results and is expensive. Thus, the current study is to address the unmet demand of a technique for accurate and fast quantification of cardiac biomarker concentrations by developing a sensitive label-free biosensor.
Label-free bioassay technologies have attracted much attention in recent years with the potential to address some of the limitations in fluorescence based methods. Although many different types of label-free biosensors have been constructed by different research groups (Chao et al. 2006, Chow et al. 2004, Chryssis et al. 2005, Cunningham et al. 2004, Fan et al. 2008, Lai et al. 2008, Ramachandran et al. 2008, Schneider et al. 1997, Skivesen et al. 2007, Smith et al. 2006, Ymeti et al. 2003, Zourob et al. 2005), one general challenging issue for label-free methods is to obtain high sensitivity compared with fluorescence based measurements. In this study, the detection mechanism of the biosensor used is unique, which is based on one of our recently patented technologies (Ye et al. 2009) that allows higher detection sensitivity compared with other label-free methods including the state-of-the-art surface-plasmon-resonance-based systems (Guo Y. B. et al. 2008), although its sensitivity still has not reached the level of fluorescence based assays yet. Briefly, a unique open microcavity with a high finesse is created by using a Photonic Crystal structure in a Total-Internal-Reflection (PC-TIR) configuration. In contrast to a closed configuration of a conventional microcavity with a cavity layer sandwiched between two high-reflection surfaces, we open up the closed microcavity structure by splitting the cavity layer through the middle. A microcavity is still formed when we place only half of a conventional microcavity structure in a TIR configuration. This is because when an incident light is beyond the critical angle it can be confined between the PC structure and its mirror image due to TIR. The PC-TIR configuration creates a unique open sensing surface, which allows easy immobilization of analyte-recognition molecules on the surface and direct exposure of the functionalized sensor surface to analyte molecules in real-time bioassays (Dallo et al. 2012, Guo Y. et al. 2010, Guo Y. B. et al. 2008, Ye and Ishikawa 2008, Ye et al. 2009, Zhang B. et al. 2013, Zhang B. L. et al. 2011). Compared to the conventional analytical methods such as ELISA, PCR and HPLC, the PC-TIR biosensor has the advantages of label-free detection, rapid response time, and the potential for continuous in vivo monitoring. In this paper, we demonstrate that a PC-TIR sensor can be functionalized for in vitro cTnI detection and have carried out measurements of cTnI samples with a wide range of concentrations to determine the sensor sensitivity. The optimization of the assay protocol has been achieved for sensitive and specific detection of cTnI.
2. Materials and Methods
2.1. Design and fabrication of PC-TIR sensors
We designed the PC-TIR sensor based on the theoretical calculations discussed in our previous studies (Guo Y. et al. 2010, Guo Y. B. et al. 2008, Ye and Ishikawa 2008, Zhang B. et al. 2013, Zhang B. L. et al. 2011). Basically, the sensor is composed of a PC structure of five alternating layers of two different dielectric materials (titania and silica), and a cavity layer on the top. The titania and silica layers have a designed thickness of 89.8 and 307.2 nm, respectively, for an incident angle of a probe light at 64° into the substrate of the sensor. The multi-layers are fabricated with electron-beam physical vapor deposition on a transparent BK7 glass substrate. The cavity layer of the sensor was formed with 382 nm of silica and 10 nm of silicon on top of the PC structure.
2.2. Functionalization of the PC-TIR sensor
The protocol for surface modification of the PC-TIR sensor is schematically shown in Fig. 1. The surface of a PC-TIR sensor chip and a polydimethylsiloxane (PDMS) based microchannel system (details described in Section 2.3) were first processed with a plasma cleaner (from Harrick Plasma) for 60 seconds, which renders the surface hydrophilic through oxidization in O2 plasma. The silanol (SiOH) groups created on the surface form bridging Si-O-Si bond when the oxidized PDMS surface is placed in contact with the sensor chip surface, creating an irreversible seal of the microchannels on the surface of sensor chip. After that, 2% (v/v) 3-aminopropyltriethoxysilane (APTES) in ethanol was injected into the microchannels for 25 minutes, followed by washing with ethanol for 40 minutes and dry overnight. The amine group bearing sensor surface can then be used for biomolecular immobilization.
Fig. 1.

Surface treatments for immobilization of cTnI antibodies on a PC-TIR sensor chip for cTnI assays.
To obtain the specific detection of cTnI, the PC-TIR sensor chip surface was functionalized by immobilization of cTnI antibodies. For that, carboxylmethylated (CM) Dextran (MW=500,000) was first covalently bound onto the amine terminated sensor surface to maximize the binding activities of cTnI antibodies (Howell et al. 1998, Masson et al. 2006). The CM-Dextran (25 mg/mL) was prepared in 2-(N-morpholino)ethanesulfonic acid (MES) buffer solution (6 mL) with a pH value of 4.7. The carboxyl groups on the CM-Dextran were activated with the aid of 1-ethyl-3(3-dimethyl aminopropyl) carbodiimide (EDC) and N-hydroxysuccinimide (NHS) molecules for 15 minutes. The concentrations of NHS and EDC used were 50 mM and 200 mM, respectively. The CM-Dextran solution with activated carboxyl groups was adjusted to a pH value of 7.2 by adding an appropriate amount of Tris buffer solution. The CM-Dextran was then immobilized by reacting with the amine groups of APTES on the sensor chip surface for about two and half hours at room temperature. Finally, the immobilized CM-Dextran on the sensor chip was activated with a similar EDC/NHS chemistry and reacted with cTnI antibodies (0.02 μg μL−1) to functionalize the sensor for specific cTnI detection. Mouse monoclonal antibodies against cTnI (anti-cTnI) were purchased from Fitzgerald Industries International (Acton, MA). To reduce possible nonspecific binding sites, the sensor chip immobilized with cTnI antibodies was blocked with bovine serum albumin (BSA) (from Sigma-Aldrich, St. Louis, MO) with a concentration of 1% in PBS for 1 hour. This completes the functionalization of the sensor surface and the sensor is ready for cTnI bioassays.
To demonstrate the detection of cTnI in human plasma, cTnI with different concentrations was used to spike plasma solutions. Lyophilized human plasma prepared from pooled human blood and containing 3.8% trisodium citrate as an anticoagulant (P9523, Sigma-Aldrich, St. Louis, MO) was reconstituted and used without dilution. The cTnI-spiked plasma solutions were degassed for 10 minutes before experiments. The matrix effect of plasma due to nonspecific binding on the sensor surface was investigated and discussed in Section 3.
2.3. Fabrication of a microfluidic system for sample delivery
We fabricated a microfluidic system to inject analyte samples onto the PC-TIR sensor chip. PDMS microchannels were designed and fabricated using photolithography and replica molding. Briefly, negative photoresist SU8-2025 (MicroChem) was spin coated on a clean silicon wafer at a spin speed of 1200 rpm, resulting in a film thickness of 80 μm. A photomask was made to have a pattern of five channels and each was 400 μm wide and 6 mm long. The wafer with coated photoresist film was covered with the photomask and then radiated with UV light. After developed, a mode was obtained for making PDMS microchannels via replica molding processes. For that, PDMS base and curing agents (Sylgard184, Dow Corning) were mixed at a ratio of 10:1. The mixture was then degassed in a vacuum chamber before being cast on the mold and cured for overnight at 60°C. The PDMS micro-channels were sealed on the surface of a PC-TIR sensor chip with the method described in section 2.2. A syringe pump was connected to the micro-channels with Teflon tubing to control the flow rate of cTnI samples or buffer solutions onto the sensor chip.
2.4. Binding assays with the PC-TIR sensor
Figure 2 shows the diagram of the experimental setup. A Helium-Neon laser was used as a probe light to monitor the change in the resonance condition of the functionalized PC-TIR sensor due to biomolecular binding. The probe light first went through a polarizer to select s-polarization for the senor mounted on a prism. The probe light then went through a spatial filter composed of a pinhole and a pair of lenses to obtain a high quality spatial mode and expand the beam to 10 mm. Two mirrors were used to direct the probe beam towards the sensor coupled to a prism with index matching oil. A cylindrical lens was used to focus the probe beam into a line crossing the five microchannels on the sensor surface. The reflected beam was collimated with another cylindrical lens and imaged onto a CCD camera. Five short sections of dark lines were observed in the image (shown in the upper right of Fig. 2), which correspond to the resonant angle of the probe beam for the PC-TIR sensor. The positions of the dark lines sensitively shift due to molecular binding events occurring on the sensor surface when analyte sample solutions flow through the channels.
Fig. 2.
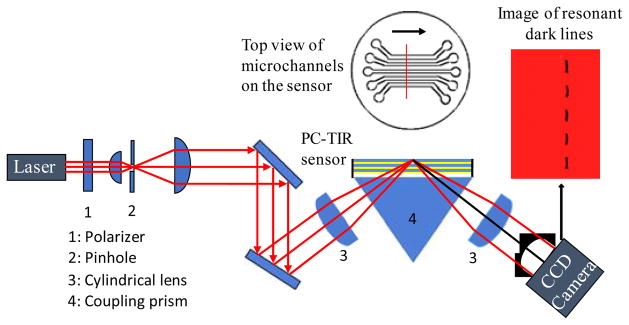
Schematic diagram of experimental setup. A microfluidic system is coupled with a PC-TIR sensor. The insert on the upper right shows resonant dark lines of a reflected probe laser beam from the sensor monitored with a CCD camera.
In order to correlate the shifts of the dark lines in pixel numbers with the changes of the resonant wavelength in the reflectance spectrum of the sensor, we also used a spectral modulation detection mode. For that, a broadband white light source was coupled to a single-mode optical fiber and the output light from the fiber was collimated with an aspherical lens and passed through a linear polarizer to select s-polarization (Zhang B. L. et al. 2011). The light had an incident angle of 64° to a PC-TIR sensor and the spectra of the beam reflected from the sensor were measured with a high-resolution spectrometer (HR4000, Ocean Optics) to monitor the resonant wavelength. Mixtures of ethylene glycol and water at different ratios were injected into microchannels on the sensor. The change in the resonant wavelength was recorded and compared to the shift in the dark line position obtained from the imaging setup.
Since the imaging setup (Fig. 2) allows simultaneous bioassays in multiple parallel microchannels, it was used to measure samples spiked with cTnI (from Fitzgerald Industrial) at various concentrations covering the entire clinical sensing range (0.1–100 ng mL−1). The protocol for the assays is as the following. Firstly, phosphate buffered saline (PBS, pH 7.4) solutions were flowed into all microchannels on the functionalized sensor chip. The dark line position for each channel was recorded to establish the corresponding detection baseline. Secondly, the PBS buffer solutions in four channels were replaced with cTnI solutions, while the fifth channel had the PBS solution continuously flowing as a reference. The shifts of dark lines for different channels were recorded in real-time, which reflect the amount of cTnI molecules captured by the antibodies immobilized on the sensor surface. Thirdly, the sensor surface was washed by flowing PBS through the channels. The positions of the dark lines were recorded again. The net shifts of the dark lines compared with the detection baseline were used to quantify the amount of cTnI molecules bounded on the sensor surface. In addition to the bioassays of cTnI in PBS solutions, the detection of cTnI in human plasma was also performed.
3. Results and Discussion
The 10-nm silicon layer in the cavity of the PC-TIR sensor was designed to serve as an absorptive material, which is responsible for the dark line in the image of the reflected probe beam (the insert of Fig. 2) or the resonant dip in the reflectance spectrum of the sensor (Fig. 3a). The need of the silicon layer is because of the following reasons. For a probe laser beam with its wavelength falling into the photonic band gap of the PC structure, it is reflected by the PC structure and cannot reach the top surface of the cavity layer. Only when the specific incident angle of the probe laser beam satisfies the resonance condition, does the light reach the cavity layer and experience TIR at the top surface of the cavity layer. However, in practice, the portion of light reflected by the PC structure and the portion reflected at the interface by TIR are mixed and difficult to separate in space. In order to distinguish these two cases, a small amount of light absorbing material is necessary to be incorporated into the cavity layer. Due to the field enhancement in this layer at a resonant condition, maximum absorption occurs and the image of the reflected beam from the sensor shows a dark line at the resonant incident angle. Similarly, when a broad band light source is used to probe the sensor at a fixed incident angle, only the frequency component with its wavelength matched with the resonant wavelength of the sensor gets absorbed and results in a resonant dip in the reflectance spectrum of the sensor.
Fig. 3.

(a) Reflectance spectra of the PC-TIR sensor for flowing water or water and ethylene glycol mixtures in the microchannels on the sensor; (b) Resonant wavelength shifts for the water and ethylene glycol mixtures with different ratios; (c) Images of reflected probe laser beam from the PC-TIR sensor with five channels containing water or ethylene glycol and water mixtures. (d) Relative shifts of dark lines for the channels with ethylene glycol/water mixtures compared to the reference channel containing pure water.
Different resonant dips in the reflectance spectra of the sensor for flowing water or water and ethylene glycol mixtures in the microchannels on the sensor are recorded as shown in Fig. 3(a). Figure 3(b) shows the relative shifts of the resonant wavelengths for different ethylene glycol and water mixtures compared to that for pure water. On the other hand, when a HeNe laser beam is used as the probe light instead of a broadband white light source, different dark lines corresponding to different resonant angles were observed in the images of the reflected laser beam from the sensor (Fig. 3c). The left image shows five dark lines corresponding to the five channels containing pure water. The five dark lines are almost aligned along a straight line, although there are some deviations due to variations of the cavity layer thickness of the sensor. These variations did not cause a problem in the measurements because the changes of resonant conditions were measured by the relative shifts of the dark line positions compared to their own original positions. The image on the right in Fig. 3c shows the situation when water in the upper four channels was replaced with ethylene glycol/water mixtures. From the top to the bottom channel, the concentrations of ethylene glycol in water were 23, 18, 10, 5, and 0 %. Figure 3(d) shows the relative shifts of the dark line compared to the reference channel having a continuous flow of pure water. According to the shifts of resonant wavelengths (Fig. 3b) and the corresponding shifts of dark lines (Fig. 3d), the conversion factor between dark-line shifts (pixel numbers) and the wavelength shifts was experimentally determined to be 0.054 nm/pixel.
Figure 4 shows typical profiles of a dark line in the image of the reflected laser beam at several representative time points when flowing a cTnI antibody solution with a concentration of 0.02 μg μL−1 (in PBS) on a PC-TIR sensor. The full width at half maximum (FWHM) of each dark line is only about 38 pixels, which corresponds to 2.0 nm in the reflectance spectrum. This sharp resonance condition allows enhancing the detection sensitivity because a small shift of the dark line can be accurately measured. The position of the dark line was precisely obtained by fitting the curve of the profile with a Lorentzian function.
Fig. 4.

Typical profiles of dark lines at different time points.
Figure 5 shows the results of functionalization processes of the PC-TIR sensor detected by monitoring the shift of the dark line positions in real time while flowing sample solutions through microchannels on the sensor surface. For all the plots, stage I is the detection baseline for flowing buffer solutions; stage II shows the real-time binding kinetics when flowing samples; and stage III gives the final result of resonant shift due to binding after washing with buffer solutions. The results for immobilization of amine group bearing molecule, APTES, on the sensor surface are shown in Fig. 5(a). The binding shift in nanometers was converted from the measured dark line shift in pixel numbers using the conversion factor of 0.054 nm/pixel determined from Fig. 3. It can be seen in Fig. 5(a) that the resonant wavelength shifts by 0.8 nm due to the binding of APTES. Figure 5(b) shows the results of further immobilization of CM-Dextran on the APTES treated sensor surface. The carboxyl groups on the CM-Dextran were activated with the aid of EDC/NHS chemistry, which react with amine groups of APTES on the sensor chip surface. The binding of CM-Dextran has caused a 3-nm shift in the resonant wavelength of the sensor after washing off excess CM-Dextran with PBS buffer solutions.
Fig. 5.

Functionalization of a PC-TIR sensor. In each plot, stage I shows a detection baseline. Stage II shows the binding kinetics when sample solutions are injected through the microchannels onto the sensor surface. Stage III shows the final binding results on the sensor after washing. (a) Immobilization of APTES on a PC-TIR sensor; (b) Immobilization of CM-Dextran on the APTES treated sensor surface; (c) Functionalization of the sensor surface with cTnI antibodies; and (d) Blocking nonspecific binding sites with BSA.
The sensor was then functionalized with cTnI antibodies. The immobilized CM-Dextran on the sensor surface was activated again with EDC/NHS chemistry to allow reacting with cTnI antibodies. Stage I in Fig. 5(c) shows a stable baseline when PBS buffer solutions were flowed over the sensor surface. The resonant wavelength started to shift when anti-cTnI (0.02 μg μL−1) was injected through the microchannels, as shown in Stage II of Fig. 5(c). The shift increased with increasing time, indicating that more and more antibody molecules were bound to the sensor surface. After the initial fast changes in the resonant wavelength, the wavelength shift reached a plateau due to saturation of the number of antibody molecules immobilized on the sensor surface. The sensor surface was then washed with PBS to remove excess and loosely bound anti-cTnI molecules, causing a small reduction of the binding shift. The resonant wavelength was stabilized at a level with a shift of 1.69 nm after continuous flow of PBS for about 15 minutes (Stage III in Fig. 5c). After the immobilization of the antibody molecules, BSA was used to block possible nonspecific binding sites on the sensor surface. A final binding shift of 1.5 nm in the resonant wavelength due to BSA interaction on the sensor surface was observed (Fig. 5d).
The functionalized PC-TIR sensors with or without BSA blocking were evaluated for detecting cTnI samples with different concentrations ranging from 0.1 to 100 ng mL−1. Before detecting cTnI in human plasma, we first used the sensor for the detection of cTnI spiked in PBS buffer solution. A clear shift of resonant wavelength was observed due to the binding of cTnI on the sensor surface even for a low cTnI concentration down to 0.1 ng mL−1 (Fig. 6a). In comparison of the results for the sensor with or without BSA blocking, the binding shifts were reduced for the sensor pretreated in a BSA blocking solution for 1 hour before the cTnI assay. This result indicates that BSA can be utilized to block nonspecific binding sites on the sensor surface. We further performed the measurements of cTnI prepared in human plasma using a PC-TIR sensor pretreated with a BSA blocking solution. As illustrated in Fig. 6b (red bars), the result demonstrates that our PC-TIR sensor has a detection limit of cTnI concentration in human plasma as low as 0.1 ng mL−1. As current standards for cTnI detection vary, different values for the clinically relevant range of cTnI have been reported before, ranging from 0.4 to 2.0 ng/mL in different literatures (Ahammad et al. 2011, Peacock et al. 2008, Ramparany et al. 2011). The detection sensitivity of our PC-TIR sensor is within this range. However, a recent study also reported a clinically relevant cutoff (>99th percentile) at ~ 0.04 ng/mL (Mahajan and Jarolim 2011). Therefore, further improvement of the detection sensitivity of the PC-TIR sensor is needed in order to reach the clinical cutoff level at 0.04 ng/mL. In addition, Figure 6(b) shows that the binding shift increases with increasing cTnI concentrations and saturation effect has been observed at higher concentrations. This saturation effect is typical for specific bindings and may be attributed to the limited binding sites of anti-cTnI available on the sensor surface.
Fig. 6.
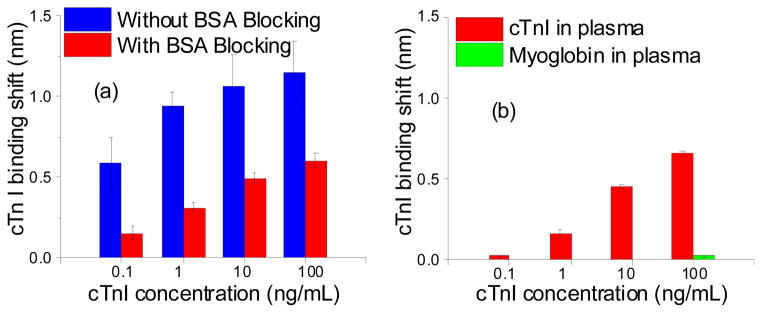
(a) Detection of cTnI spiked in PBS solutions. The blue bars show the results for the sensor without BSA blocking, while the red bars show the results with BSA blocking. (b) Detection of cTnI in human plasma using a functionalized PC-TIR sensor with BSA blocking (red bars). The green bar shows the result of flowing myoglobin in human plasma on the same sensor.
For comparison studies, we also used a PC-TIR sensor without immobilized anti-cTnI molecules on the sensor surface. There was no relative shift in the resonant wavelength observed when cTnI-spiked plasma and pure plasma samples were injected on the sensor surface without anti-cTnI (Fig. 7). The detection baseline was first established by flowing PBS buffer solutions through the microfluidic channels (Stage I, Fig. 7). Two plasma solutions spiked with 1 ng/mL and 100 ng/mL cTnI, respectively, and a pure plasma solution were then flowed through three different microchannels on the sensor surface without anti-cTnI. Large shifts of the resonant wavelength were observed for all the three channels (Stage II, Fig. 7) due to the difference in the refractive indices between plasma and PBS. However, after stopping flow of the plasma samples and washing with PBS, the resonant wavelengths for all the three channels reduced to only 1 nm higher than the detection baseline (Stage III, Fig. 7). The 1-nm shift of the resonant wavelength in the reference channel (flowing just plasma) can be attributed to the matrix effect of the plasma. The matrix effect can be compensated to obtain the net shift of the resonant wavelength in the signal channels by comparing the shift in the signal channel to the reference channel. Here it can be seen that there was no relative shift among the cTnI-spiked plasma samples and the pure plasma for the sensor without functionalization using anti-cTnI. This experimental finding indicates that without immobilizalization of cTnI antibodies, the bare PC-TIR did not capture cTnI molecules, while the resonance shifts observed when flowing cTnI samples on the functionalized PC-TIR sensor were resulted from the capture of cTnI molecules by the immobilized antibodies on the sensor surface.
Fig. 7.

Binding assays using a PC-TIR sensor without immobilized anti-cTnI. Stage I: flowing PBS through microchannels on the sensor surface to establish detection baselines. Stage II: Two plasma solutions spiked with 1 ng/mL (red) and 100 ng/mL (blue) cTnI, respectively, and a pure plasma solution (black) were flowed through three different microchannels on the sensor surface without immobilized cTnI antibody molecules. Stage III: binding shifts after wash with PBS.
Finally, we selected myoglobin as an irrelevant protein molecule for the sensor functionalized with anti-cTnI to further test the detection specificity. Human plasma was spiked with a high concentration of myoglobin (100 ng/mL) and injected onto the sensor through a microchannel. The result is represented with the green bar in Fig. 6b. Compared with cTnI at the same concentration, the myoglobin only caused a negligible binding shift. In addition, the sensor specificity has also been demonstrated in the BSA-only detection regime to avoid the plasma matrix effects and the possible endogenous myoglobin in human plasma. Figure 8 shows the comparison studies when 100-ng/mL cTnI and 100-ng/mL myoglobin in BSA solutions were flowed through the microchannels on the sensor surface with immobilized cTnI antibodies, while a reference channel has just a BSA solution. After wash with PBS, a clear binding shift for the cTnI sample was observed, whereas the myoglobin did not cause a significant shift compared with the reference channel. This result demonstrates that the functionalized PC-TIR sensor has high specificity for cTnI assays.
Fig. 8.

Comparison studies of cTnI and myoblobin in BSA flowing through microchannels on a sensor surface with immobilized cTnI antibody molecules. Stage I: flowing PBS; Stage II: flowing a BSA solution of cTnI (red), a BSA solution of myoglobin (blue), and a BSA solution as a reference (black); Stage III: binding shifts after wash with PBS.
4. Conclusions
A unique label-free biosensor for cTnI assays has been successfully designed and constructed by using a photonic crystal structure in a TIR configuration. This configuration creates an open microcavity that allows easy functionalization of the sensor surface and direct access of analyte molecules to the sensor surface. Anti-cTnI was immobilized on the sensor surface for binding assays of cTnI samples. The sensor is highly sensitive for detection of cTnI with a low concentration that has reached the required sensitivity for detecting the minimum cTnI concentration used as a clinical cut-off level for diagnosing MI patients. The experimental results reported in this paper serve as a necessary step towards potential applications of the PC-TIR sensor for fast and accurate quantification of cTnI concentrations in blood samples from patients in clinical settings.
Highlights.
Our biosensor has a unique open optical microcavity for label-free bioassays.
The open cavity is formed with a photonic crystal structure in a TIR configuration.
The open-cavity sensor allows easy functionalization and fast bioassays.
The biosensor was functionalized with antibodies for bioassays of cTnI.
Detection of cTnI with a concentration as low as 0.1 ng mL−1 has been achieved.
Acknowledgments
This work is supported by the funding from San Antonio Area Foundation and is partially supported by NIH (R21 EB008765).
Footnotes
Publisher's Disclaimer: This is a PDF file of an unedited manuscript that has been accepted for publication. As a service to our customers we are providing this early version of the manuscript. The manuscript will undergo copyediting, typesetting, and review of the resulting proof before it is published in its final citable form. Please note that during the production process errors may be discovered which could affect the content, and all legal disclaimers that apply to the journal pertain.
References
- Ahammad AJS, Choi YH, Koh K, Kim JH, Lee JJ, Lee M. Electrochemical Detection of Cardiac Biomarker Troponin I at Gold Nanoparticle-Modified ITO Electrode by Using Open Circuit Potential. International Journal of Electrochemical Science. 2011;6:1906–1916. [Google Scholar]
- Alpert JS, Thygesen K, Antman E, Bassand JP. Myocardial infarction redefined--a consensus document of The Joint European Society of Cardiology/American College of Cardiology Committee for the redefinition of myocardial infarction. J Am Coll Cardiol. 2000;36:959–969. doi: 10.1016/s0735-1097(00)00804-4. [DOI] [PubMed] [Google Scholar]
- Aziz EF, Javed F, Pratap B, Herzog E. Strategies for the prevention and treatment of sudden cardiac death. Open Access Emerg Med. 2010;2010:99–114. doi: 10.2147/OAEM.S6869. [DOI] [PMC free article] [PubMed] [Google Scholar]
- Babuin L, Jaffe AS. Troponin: the biomarker of choice for the detection of cardiac injury. CMAJ. 2005;173:1191–1202. doi: 10.1503/cmaj.050141. [DOI] [PMC free article] [PubMed] [Google Scholar]
- Chao CY, Fung W, Guo LJ. Polymer microring resonators for biochemical sensing applications. Ieee Journal of Selected Topics in Quantum Electronics. 2006;12:134–142. [Google Scholar]
- Chow E, Grot A, Mirkarimi LW, Sigalas M, Girolami G. Ultracompact biochemical sensor built with two-dimensional photonic crystal microcavity. Optics Letters. 2004;29:1093–1095. doi: 10.1364/ol.29.001093. [DOI] [PubMed] [Google Scholar]
- Chryssis AN, Saini SS, Lee SM, Yi HM, Bentley WE, Dagenais M. Detecting hybridization of DNA by highly sensitive evanescent field etched core fiber bragg grating sensors. Ieee Journal of Selected Topics in Quantum Electronics. 2005;11:864–872. [Google Scholar]
- Cunningham BT, Li P, Schulz S, Lin B, Baird C, Gerstenmaier J, Genick C, Wang F, Fine E, Laing L. Label-free assays on the BIND system. Journal of Biomolecular Screening. 2004;9:481–490. doi: 10.1177/1087057104267604. [DOI] [PubMed] [Google Scholar]
- Dallo SF, Zhang B, Denno J, Hong S, Tsai A, Haskins W, Ye JY, Weitao T. Association of Acinetobacter baumannii EF-Tu with cell surface, outer membrane vesicles, and fibronectin. ScientificWorldJournal. 2012;2012:128705. doi: 10.1100/2012/128705. [DOI] [PMC free article] [PubMed] [Google Scholar]
- Fan XD, White IM, Shopoua SI, Zhu HY, Suter JD, Sun YZ. Sensitive optical biosensors for unlabeled targets: A review. Analytica Chimica Acta. 2008;620:8–26. doi: 10.1016/j.aca.2008.05.022. [DOI] [PMC free article] [PubMed] [Google Scholar]
- Go AS, et al. Heart disease and stroke statistics--2013 update: a report from the American Heart Association. Circulation. 2013;127:e6–e245. doi: 10.1161/CIR.0b013e31828124ad. [DOI] [PMC free article] [PubMed] [Google Scholar]
- Guo Y, Ye JY, Divin C, Thomas TP, Myc A, Bersano-Begey TF, Baker JJR, Norris TB. Real-Time Biomolecular Binding Detection Using a Sensitive Photonic Crystal Biosensor. Anal Chem. 2010;82:5211–5218. doi: 10.1021/ac100576y. [DOI] [PMC free article] [PubMed] [Google Scholar]
- Guo YB, Divin C, Myc A, Terry FL, Baker JR, Norris TB, Ye JY. Sensitive molecular binding assay using a photonic crystal structure in total internal reflection. Optics Express. 2008;16:11741–11749. doi: 10.1364/oe.16.011741. [DOI] [PMC free article] [PubMed] [Google Scholar]
- Howell S, Kenmore M, Kirkland M, Badley RA. High-density immobilization of an antibody fragment to a carboxymethylated dextran-linked biosensor surface. Journal of Molecular Recognition. 1998;11:200–203. doi: 10.1002/(SICI)1099-1352(199812)11:1/6<200::AID-JMR423>3.0.CO;2-7. [DOI] [PubMed] [Google Scholar]
- Lai ZA, Wang YL, Allbritton N, Li GP, Bachman M. Label-free biosensor by protein grating coupler on planar optical waveguides. Optics Letters. 2008;33:1735–1737. doi: 10.1364/ol.33.001735. [DOI] [PubMed] [Google Scholar]
- Mahajan VS, Jarolim P. How to interpret elevated cardiac troponin levels. Circulation. 2011;124:2350–2354. doi: 10.1161/CIRCULATIONAHA.111.023697. [DOI] [PubMed] [Google Scholar]
- Masson JF, Battaglia TM, Cramer J, Beaudoin S, Sierks M, Booksh KS. Reduction of nonspecific protein binding on surface plasmon resonance biosensors. Analytical and Bioanalytical Chemistry. 2006;386:1951–1959. doi: 10.1007/s00216-006-0834-2. [DOI] [PubMed] [Google Scholar]
- Palla AR, Sontineni S, Mani S. Markedly Elevated Cardiac Bio-Markers at Presentation With Normal Ventricular Function: A Novel Clinical Subset of Myocarditis Manifestation. Cardiol Res. 2011;2:123–126. doi: 10.4021/cr15w. [DOI] [PMC free article] [PubMed] [Google Scholar]
- Peacock WFt, De Marco T, Fonarow GC, Diercks D, Wynne J, Apple FS, Wu AH. Cardiac troponin and outcome in acute heart failure. N Engl J Med. 2008;358:2117–2126. doi: 10.1056/NEJMoa0706824. [DOI] [PubMed] [Google Scholar]
- Ramachandran A, et al. A universal biosensing platform based on optical micro-ring resonators. Biosensors & Bioelectronics. 2008;23:939–944. doi: 10.1016/j.bios.2007.09.007. [DOI] [PubMed] [Google Scholar]
- Ramparany L, Ramirez J, Nizou JY, Le Saux D, Richard V, Talarmin A. Evaluation of four rapid immunochromatographic tests for the detection of cardiac troponin I. Clin Vaccine Immunol. 2011;18:414–417. doi: 10.1128/CVI.00502-10. [DOI] [PMC free article] [PubMed] [Google Scholar]
- Reichlin T, et al. Early Diagnosis of Myocardial Infarction with Sensitive Cardiac Troponin Assays. New England Journal of Medicine. 2009;361:858–867. doi: 10.1056/NEJMoa0900428. [DOI] [PubMed] [Google Scholar]
- Scharnhorst V, Krasznai K, van’t Veer M, Michels R. Rapid Detection of Myocardial Infarction With a Sensitive Troponin Test. American Journal of Clinical Pathology. 2011;135:424–428. doi: 10.1309/AJCPA4G8AQOYEKLD. [DOI] [PubMed] [Google Scholar]
- Schneider BH, Edwards JG, Hartman NF. Hartman interferometer: versatile integrated optic sensor for label-free, real-time quantification of nucleic acids, proteins, and pathogens. Clinical Chemistry. 1997;43:1757–1763. [PubMed] [Google Scholar]
- Skivesen N, Horvath R, Thinggaard S, Larsen NB, Pedersen HC. Deep-probe metal-clad waveguide biosensors. Biosensors & Bioelectronics. 2007;22:1282–1288. doi: 10.1016/j.bios.2006.05.025. [DOI] [PubMed] [Google Scholar]
- Smith KH, Ipson BL, Lowder TL, Hawkins AR, Selfridge RH, Schultz SM. Surface-relief fiber Bragg gratings for sensing applications. Applied Optics. 2006;45:1669–1675. doi: 10.1364/ao.45.001669. [DOI] [PubMed] [Google Scholar]
- Ye JY, Ishikawa M. Enhancing fluorescence detection with a photonic crystal structure in a total-internal-reflection configuration. Optics Letters. 2008;33:1729–1731. doi: 10.1364/ol.33.001729. [DOI] [PubMed] [Google Scholar]
- Ye JY, Guo Y, Norris TB, Baker JJR. Patent No. 7,639,362 Novel Photonic Crystal Sensor Patent Issued. 2009
- Ymeti A, Kanger JS, Greve J, Lambeck PV, Wijn R, Heideman RG. Realization of a multichannel integrated Young interferometer chemical sensor. Applied Optics. 2003;42:5649–5660. doi: 10.1364/ao.42.005649. [DOI] [PubMed] [Google Scholar]
- Zhang B, Tamez-Vela J, Solis S, Bustamante B, Peterson R, Rahman S, Morales A, Tang L, Ye JY. Detection of Myoglobin with open-cavity and label-free photonic crystal biosensor. Journal of Medical Engineering. 2013:808056. doi: 10.1155/2013/808056. [DOI] [PMC free article] [PubMed] [Google Scholar]
- Zhang BL, Dallo S, Peterson R, Hussain S, Tao WT, Ye JY. Detection of anthrax lef with DNA-based photonic crystal sensors. Journal of Biomedical Optics. 2011:16. doi: 10.1117/1.3662460. [DOI] [PubMed] [Google Scholar]
- Zipes DP, Wellens HJ. Sudden cardiac death. Circulation. 1998;98:2334–2351. doi: 10.1161/01.cir.98.21.2334. [DOI] [PubMed] [Google Scholar]
- Zourob M, Mohr S, Brown BJT, Fielden PR, McDonnell MB, Goddard NJ. An integrated metal clad leaky waveguide sensor for detection of bacteria. Analytical Chemistry. 2005;77:232–242. doi: 10.1021/ac049627g. [DOI] [PubMed] [Google Scholar]