

Abstract
Aims/Introduction: The efficacy, dose–response relationship and safety of ginsam, a vinegar extract from Panax ginseng, were evaluated in an 8‐week, double‐blind, randomized, placebo‐controlled study in drug‐naïve patients with type 2 diabetes.
Materials and Methods: A total of 72 diabetic patients were randomized to receive 1500, 2000 or 3000 mg of ginsam, or placebo daily for 8 weeks (n = 18 in each group). The primary end‐point was the changes from the baseline HbA1c level. The secondary end‐points were the changes of fasting and postprandial 2‐h glucose concentration, and the proportion of patients achieving a reduction in HbA1c >0.5%.
Results: In the intention‐to‐treat analysis, ginsam treatment reduced HbA1c level significantly: −0.56 ± 0.25% in the 1500 mg group, −0.31 ± 0.12% in the 2000 mg group, and −0.29 ± 0.11% in the 3000 mg group (all P < 0.05), with a significant difference between the 1500 mg ginsam and the placebo group (−0.02 ± 0.12%, P = 0.021). The changes in fasting glucose concentration followed the same pattern: −21.40, −14.27 and −6.76 mg/dL for 1500, 2000, and 3000 mg, respectively, vs −2.25 mg/dL for the placebo. The percentage of patients whose HbA1c level decreased by >0.5% differed significantly between the placebo group (11.1%) and the 1500 mg (27.8%) and 2000 mg (27.8%) groups. No severe adverse events were observed in any group.
Conclusions: An 8‐week treatment with ginsam, a vinegar extract from P. ginseng, moderately improved HbA1c level and was well tolerated in type 2 diabetic patients with inadequate glycemic control. This trial was registered with ClinicalTrial.Gov (no. NCT01008163). (J Diabetes Invest, doi: 10.1111/j.2040‐1124.2011.00185.x, 2011)
Keywords: Ginsam, Oral antidiabetic therapy, Panax ginseng
Introduction
Ginseng is one of the most popular oriental herbal medicines. Ginseng was originally referred to as the root of Panax ginseng CA Mey. In traditional oriental medicine, ginseng is considered an adaptogen, aphrodisiac and nourishing stimulant, and has been used historically in the treatment of various aging‐associated diseases1,2.
The various pharmacological properties of ginseng have been documented3–5. Several studies showed that ginseng had antidiabetic effects6,7. In addition, the berry and leaf of ginseng have been reported to lower blood glucose concentration and bodyweight in models of diabetes and obesity8,9. Most studies use simple extracts from the roots, leaves or berries of ginseng, which contain various concentrations of saponins and non‐saponins. Ginsenosides, which belong to the saponin family, are the major active compounds of ginseng, and more than 30 ginsenosides have been isolated from ginseng10. Among these ginsenoside components, Rg3 is thought to be one of the most active components in terms of its pharmacological effects of ginseng on glucose and lipid levels, as well as obesity11–13. A substantial effort has been focused on improving the pharmacological properties of ginseng by extracting the most biologically active components.
Ginsam is a vinegar extraction from P. ginseng that is enriched with ginsenoside Rg314. A study comparing the effects of ginsam and unprocessed ginseng extracts in an animal model of metabolic syndrome found that ginsam decreased insulin resistance and inhibited weight gain more significantly than the unprocessed ginseng extracts14. In our previous study, ginsam had distinct beneficial effects on glucose metabolism and bodyweight control in an obese animal model of insulin resistance by changing the expression of genes involved in glucose and fatty acid metabolism15. Our group has also reported that Rg3 improves insulin signaling and glucose uptake primarily by stimulating the expression of insulin receptor substrate‐1 and GLUT412. However, no study has investigated the glucose‐lowering effect of ginsam in humans. Identifying the proper dosage of extracts from ginseng associated with antihyperglycemic activity might help develop a new class of antidiabetic agent. We evaluated the efficacy, dose–response relationship and safety of ginsam, a vinegar extract from P. ginseng. We measured the concentrations of biomarkers, such as high‐sensitivity C‐reactive protein (hsCRP), tumor necrosis factor‐α (TNF‐α), interleukin‐6 (IL‐6), adiponectin and leptin, to identify any links between the glucose‐lowering effect of ginsam and changes in these biomarkers.
Materials And Methods
Patients
The inclusion criteria included patients older than 18 years and who had type 2 diabetes without any antidiabetic medication for more than 3 months, fasting plasma glucose (FPG) concentration in the range 7.0–15.0 mmol/L and HbA1c level of 7.0–12.0% (53–108 mmol/mol). The exclusion criteria included subjects who had type 1 diabetes or secondary diabetes; had chronic hepatitis (except healthy hepatitis B virus carriers) or active liver diseases (aspartate aminotransferase [AST] or alanine aminotransferase [ALT] greater than twice the upper normal value), serum creatinine concentration >1.5 mg/dL or a history of malignant neoplasm in the previous 5 years; or were taking medication that can affect glycemic control, such as systemic glucocorticoids; or women who were pregnant or lactating, and women of childbearing potential who intended to become pregnant or who did not agree to use adequate contraceptive methods during the study. Patients taking any other active ingredients, plant extracts or other complementary therapies contributing to blood glucose lowering potentials were excluded. A total of 96 patients were screened, and 24 patients were excluded. Of those excluded, 11 had HbA1c levels >12% (108 mmol/mol), seven had active liver diseases and four took medications that could affect the study results. Another two patients withdrew their consent without giving a reason. Finally, 72 patients (44 men and 28 women) with inadequate glycemic control (7.0–9.0% [53–75 mmol/mol] of HbA1c), despite medical nutritional therapy and exercise, were selected. A total of 11 patients (15.3%) dropped out during the study period: three in the control group, three in the 1500 mg ginsam group, four in the 2000 mg ginsam group and one in the 3000 mg ginsam group (Figure 1).
Figure 1.
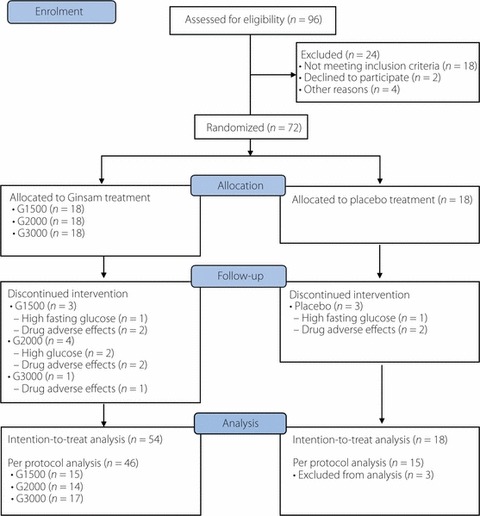
Flow chart of enrolment of the study subjects.
Each patient’s medical history, including use of medication and lifestyle details, such as alcohol intake, smoking status and exercise habits, were recorded by trained nurses. All assessments were carried out at Seoul National University Bundang Hospital in Seongnam, Korea, from January 2008 through to June 2009. The study was approved by the institutional review board of Seoul National University Bundang Hospital (IRB No. B‐0708/048‐002), and all patients gave written, informed consent. The present study was carried out after registration at ClinicalTrials.gov (NCT 01008163).
Study Design
This was a double‐blind, placebo‐controlled, randomized study. Patients were randomized into one of four groups: 1500 mg (500 mg t.i.d.), 2000 mg (1000 mg b.i.d. + placebo before lunch) or 3000 mg (1000 mg t.i.d.) of ginsam (YuYu Pharmaceutical, Seoul, Korea), or a matching placebo (t.i.d.). The dosage of ginsam in the present study was determined on the basis of previous clinical studies16,17. Ginsam or placebo was taken three times daily before meals during the 8‐week study. The taste and smell of the placebo was the same as the active agent. The study was double‐blind, and a permuted block‐randomization method was used. We provided pertinent diabetes education, including a therapeutic lifestyle change program, to standardize every patient’s education level. The study participants were scheduled to visit the research laboratory at baseline and after 4 and 8 weeks of treatment, and were monitored, as a withdrawal criterion was a FPG concentration of ≥15.0 mmol/L. Compliance with medication was assessed by pill count at every visit.
Study End‐points
The primary end‐points were to investigate the efficacy of ginsam treatment by comparing the changes from baseline in HbA1c levels after 8‐week treatment between the ginsam groups and placebo group. The secondary efficacy end‐points were: (i) FPG concentration and 2‐h postload glucose (2‐h PG) concentration after a 75‐g oral glucose tolerance test (OGTT) at 8 weeks; (ii) the proportion of patients achieving a glycemic response, which was defined as a reduction in HbA1c level of >0.5%; (iii) changes from baseline in the homeostasis model assessment of insulin resistance (HOMA‐IR) and β‐cell function (HOMA‐B), and quantitative insulin sensitivity check index (QUICKI); and (iv) changes from baseline in biomarker levels (hsCRP, TNF‐α, IL‐6, adiponectin and leptin).
The safety end‐points included adverse events (AE), serious adverse events (SAE), hypoglycemia, and changes in blood pressure, liver and renal functions. The relationships between AE and treatment were classified as certain, probable, possible, unlikely, not related or not assessable. A SAE was defined as an AE that resulted in death, threat to life, admission to hospital or the prolongation of in‐patient treatment, de novo cancer, or any other important medical events in the opinion of the investigators. Patients were educated to measure their blood glucose concentration whenever they experienced a hypoglycemic symptom and to record the blood glucose value in a diary. This entry was transcribed in the AE form by study nurses.
Measurement of Biochemical Parameters
To evaluate the effects of ginsam on glucose metabolism, plasma glucose and insulin concentrations were measured after a 12‐h fast, and all patients completed a 75‐g OGTT. Plasma glucose concentration was measured using the glucose oxidase method. Plasma insulin concentration was measured by radioimmunoassay (Linco Research, St Charles, MO, USA). Plasma glucose concentration was also measured at 2 h after the 75‐g OGTT. HbA1c level was measured by ion‐exchange high‐performance liquid chromatography. The HOMA‐IR, HOMA‐B and QUICKI were calculated as described previously18,19.
Measurement of Other Biomarkers Related to Glucose Metabolism: hsCRP, Adiponectin, TNF‐α, IL‐6 and Leptin Concentrations
High sensitivity CRP concentration was measured by immunonephelometry. Circulating adiponectin concentration was measured using an enzyme‐linked immunosorbent assay kit (AdipoGen, Seoul, Korea). The intra‐ and interassay coefficient of variation was 3.3 and 7.4% in adiponectin. Plasma TNF‐α, IL‐6 and leptin concentrations were measured using multiplex kits (Linco Research).
Statistical Analyses
The present phase II study aimed to investigate the level of glucose lowering effects of ginsam without superiority or non‐inferiority hypothesis testing for treatment differences among groups. A 95% confidence interval for the difference in HbA1c levels after 8‐week treatment with a total width of 0.8% of HbA1c (absolute) based on previous studies10,15,20 was regarded as sufficient for this exploratory trial and would be obtained with 72 completed participants in the placebo and ginsam groups. We allocated 18 patients to the placebo group and 54 patients to the three ginsam groups (n = 18 each) without prespecified confirmatory hypotheses. A withdrawal rate was assumed to be 15%. Both intention‐to‐treat and per protocol analyses were carried out for the efficacy analysis and safety profile.
Data are expressed as mean ± SD and were analyzed using spss Windows version 14.0 (SPSS, Chicago, IL, USA). Changes in parameters from the baseline values were evaluated using paired t‐tests. The significance of differences in the changes in parameters between groups was evaluated using anova and post‐hoc testing. The percentages of patients achieving a reduction in the HbA1c level of >0.5% and the frequency of AE were compared using the χ2 test. P‐values <0.05 were considered to be statistically significant.
Results
A total of 72 patients with type 2 diabetes were randomly divided into four groups (ginsam 1500, 2000 and 3000 mg, and placebo, n = 18 each). Figure 1 shows the flow of enrolment and end‐points of the study subjects. The baseline demographics and disease characteristics were not significantly different between groups (Table 1). Medical history, use of other medications and lifestyles, such as smoking status, alcohol consumption and diet habit, were not different between the groups (data not shown). On average, patients in each group were moderately hyperglycemic (mean HbA1c 7.6–7.8% [60–62 mmol/mol] for each group) at baseline.
Table 1. Baseline characteristics according to treatment group.
| Placebo | Ginsam 1500 mg | Ginsam 2000 mg | Ginsam 3000 mg | P* | |||||
|---|---|---|---|---|---|---|---|---|---|
| Mean | SD | Mean | SD | Mean | SD | Mean | SD | ||
| Age (years) | 54.8 | 10.0 | 52.7 | 11.0 | 52.7 | 10.0 | 51.1 | 8.6 | NS |
| Male n (%)† | 11 | 61.1 | 9 | 50 | 11 | 61.1 | 13 | 72.2 | NS |
| Duration of diabetes | 2.4 | 2.7 | 2.7 | 2.9 | 3.7 | 3.7 | 2.7 | 2.9 | NS |
| Height (cm) | 163.7 | 8.3 | 163.0 | 7.5 | 165.4 | 6.5 | 166.2 | 6.8 | NS |
| Weight (kg) | 67.9 | 8.6 | 70.2 | 15.2 | 65.9 | 9.3 | 70.2 | 7.8 | NS |
| SBP (mmHg) | 125.9 | 16.0 | 125.2 | 9.8 | 126.2 | 12.3 | 122.9 | 13.0 | NS |
| DBP (mmHg) | 76.3 | 10.1 | 75.6 | 8.2 | 78.2 | 8.6 | 79.2 | 11.3 | NS |
| BMI (kg/m2) | 25.3 | 1.9 | 26.3 | 4.8 | 24.0 | 2.6 | 25.4 | 2.7 | NS |
| Waist circumference (cm) | 89.9 | 6.7 | 91.6 | 9.8 | 86.3 | 8.8 | 88.8 | 7.0 | NS |
| Fasting glucose (mmol/L) | 8.25 | 1.80 | 9.15 | 2.24 | 9.54 | 1.96 | 8.95 | 1.49 | NS |
| Postload 2‐h glucose (mmol/l) | 15.51 | 2.84 | 17.52 | 4.83 | 16.57 | 4.84 | 16.82 | 4.12 | NS |
| Fasting insulin (pmol/L) | 68.76 | 29.17 | 80.56 | 39.59 | 65.98 | 30.56 | 84.03 | 45.84 | NS |
| HbA1c (%) | 7.6 | 0.4 | 7.8 | 1.3 | 7.8 | 1.2 | 7.7 | 0.8 | NS |
| HbA1c (mmol/mol) | 60 | 7 | 62 | 12 | 62 | 13 | 61 | 9 | NS |
| Total cholesterol (mmol/L) | 5.04 | 0.80 | 5.68 | 1.06 | 5.31 | 1.07 | 5.23 | 0.78 | NS |
| Triglyceride (mmol/L) | 1.67 | 0.53 | 2.00 | 1.03 | 1.67 | 0.73 | 2.05 | 1.63 | NS |
| HDL‐cholesterol (mmol/L) | 1.45 | 0.28 | 1.35 | 0.36 | 1.32 | 0.47 | 1.21 | 0.28 | NS |
| LDL‐cholesterol (mmol/L) | 2.62 | 0.61 | 3.03 | 0.74 | 2.92 | 0.80 | 2.82 | 0.59 | NS |
| AST (IU/L) | 24.1 | 7.7 | 26.3 | 7.3 | 24.3 | 6.8 | 23.4 | 8.9 | NS |
| ALT (IU/L) | 26.4 | 12.5 | 33.2 | 11.8 | 27.2 | 10.2 | 27.0 | 13.7 | NS |
| γGT (IU/L) | 44.1 | 35.9 | 55.5 | 38.5 | 43.2 | 36.5 | 37.9 | 17.0 | NS |
| Creatinine (mg/dL) | 1.02 | 0.19 | 0.98 | 0.21 | 0.92 | 0.17 | 0.96 | 0.08 | NS |
| HOMA‐IR | 3.8 | 2.1 | 4.7 | 2.5 | 4.1 | 2.0 | 4.9 | 2.9 | NS |
| HOMA‐B | 43.5 | 14.3 | 47.8 | 29.7 | 34.1 | 17.9 | 46.4 | 26.7 | NS |
| QUICKI | 0.54 | 0.07 | 0.51 | 0.05 | 0.53 | 0.06 | 0.51 | 0.07 | NS |
| hsCRP (mg/L) | 0.14 | 0.29 | 0.23 | 0.24 | 0.13 | 0.16 | 0.16 | 0.13 | NS |
| TNF‐α (pg/mL) | 7.9 | 3.5 | 8.9 | 5.8 | 7.3 | 5.7 | 8.5 | 8.1 | NS |
| IL‐6 (pg/mL) | 24.2 | 29.3 | 25.5 | 30.6 | 31.5 | 43.7 | 24.0 | 22.4 | NS |
| Adiponectin (μg/mL) | 8.6 | 4.4 | 9.4 | 6.4 | 9.4 | 4.1 | 9.1 | 5.0 | NS |
| Leptin (pg/mL) | 9.2 | 11.8 | 9.5 | 9.3 | 7.7 | 5.1 | 8.7 | 11.0 | NS |
| Antihypertensive med.† | 3 | 16.7% | 2 | 11.1% | 3 | 16.7% | 2 | 11.1% | NS |
| Lipid lowering med.† | 2 | 11.1% | 1 | 5.6% | 2 | 11.1% | 3 | 16.7% | NS |
*Significant difference between groups by one‐way anova. †Data are n and %. ALT, alanine aminotransferase; AST, aspartate aminotransferase; BMI, body mass index; CRP, c‐reactive protein; DBP, diastolic blood pressure; γGT, γ‐glutamyl transferase; HOMA‐B, homeostasis model assessment for β‐cell function; HOMA‐IR, homeostasis model assessment for insulin resistance; IL‐6, interleukin‐6; med., medication; NS, not significant; QUICKI, quantitative insulin sensitivity check index; SBP, systolic blood pressure; TNF‐α, tumor necrosis factor‐α.
The between‐treatment difference in drug compliance was assessed for the ginsam and placebo groups. The percentage of pills consumed during the 8 weeks did not differ between groups: 96.4% in the ginsam group and 92.6% in the placebo group. The proportion of pills consumed also did not differ significantly among the three ginsam groups.
Primary End‐point
HbA1c Level
For the primary end‐point of the present study, the change in HbA1c level significantly differed between the placebo and 1500 mg ginsam groups (P = 0.021 in the intention‐to‐treat analysis and P = 0.014 in the per protocol analysis), but not between the placebo and other ginsam groups (Figure 2). Within individual groups, treatment with ginsam for 8 weeks reduced the HbA1c level significantly relative to the baseline values: in the intention‐to‐treat analysis, −0.56 ± 0.25% in the 1500 mg group (P = 0.034), −0.31 ± 0.12% in the 2000 mg group (P = 0.042) and −0.29 ± 0.11% in the 3000 mg ginsam group (P = 0.025) compared with the placebo group (−0.02 ± 0.12%, P = 0.267). In the per protocol analysis, a similar trend was found with greater glucose lowering efficacy in the ginsam group: −0.59 ± 0.25, −0.34 ± 0.12 and −0.33 ± 0.11% in the 1500, 2000 and 3000 mg groups, respectively, and −0.01 ± 0.12% in the placebo group. When one outlier who showed ΔHbA1c > 1.5% in the ginsam 1500 mg arm was excluded, ΔHbA1c (%) decreased from 0.56 ± 0.25 to 0.45 ± 0.23 in this arm with borderline significance (P = 0.087). As a secondary analysis, when ΔHbA1c was compared between placebo and combined ginsam groups, there was significant difference in ΔHbA1c between the two arms irrespective of including the outlier: placebo vs combined ginsam groups with outlier, −0.02 ± 0.12% vs 0.38 ± 0.09% and placebo vs combined ginsam group without outlier, −0.02 ± 0.12% vs 0.36 ± 0.07%, both P < 0.01).
Figure 2.
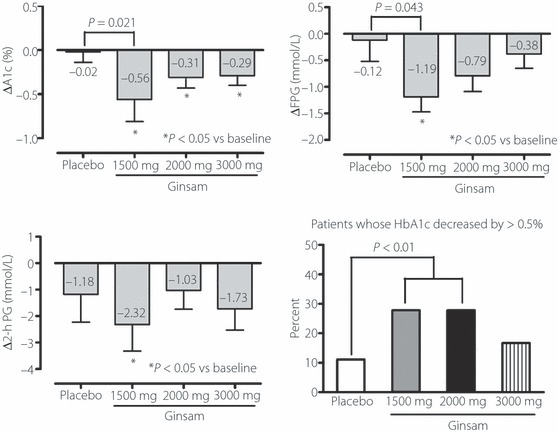
Changes of HbA1c level, and fasting and postload glucose concentration and percentage of patients whose HbA1c decreased by >0.5% during 8 weeks of treatment with ginsam.
Secondary End‐Points
FPG and 2‐h PG Concentrations
FPG concentration tended to decrease after ginsam treatment. The mean changes in FPG concentration from baseline to 8 weeks were −0.12 ± 1.62 mmol/L (P = 0.719) in the placebo group and −1.19 ± 0.85 mmol/L (P = 0.021), −0.79 ± 1.28 mmol/L (P = 0.094), and −0.38 ± 0.91 mmol/L (P = 0.119) in the 1500, 2000 and 3000 mg ginsam groups, respectively. There was a statistical significance between the change in the placebo and 1500 mg ginsam groups (P = 0.043; Figure 2).
The mean changes in 2‐h PG concentration from baseline to 8 weeks were −1.18 ± 1.62 mmol/L (P = 0.262) in the placebo group, and −2.32 ± 3.01 mmol/L (P = 0.047), −1.03 ± 2.36 mmol/L (P = 0.179) and −1.73 ± 2.79 mmol/L (P = 0.054) in the 1500, 2000 and 3000 mg ginsam groups, respectively. The changes in 2‐h PG concentration did not differ significantly between the placebo and ginsam‐treated groups.
Potency of the Glucose‐lowering Effect (HbA1c Level By >0.5%) and Changes in the Index of Insulin Resistance and β‐Cell Function
The percentage of patients whose HbA1c decreased by >0.5% differed significantly between the placebo group (11.1%) and the 1500 mg ginsam (27.8%) and 2000 mg ginsam (27.8%) groups, but not between the placebo and 3000 mg ginsam (16.7%) groups (Figure 2). However, the percentage of patients achieving a glycemic response, defined as a HbA1c level of ≤7.0% (53 mmol/mol) at 8 weeks, did not differ between groups. This result might be attributed to the differences in the baseline HbA1c levels, albeit statistically non‐significant. The changes in HOMA‐B, HOMA‐IR and QUICKI, which are indicators of insulin secretory function and insulin resistance, did not differ significantly between groups (Table 2).
Table 2. Changes of anthropometric and biochemical parameters after 8 weeks of Ginsam treatment.
| Placebo | Ginsam 1500 mg | Ginsam 2000 mg | Ginsam 3000 mg | P* | |||||
|---|---|---|---|---|---|---|---|---|---|
| Mean | SD | Mean | SD | Mean | SD | Mean | SD | ||
| ΔSBP (mmHg) | −0.55 | 12.33 | 1.22 | 10.91 | 1.55 | 14.18 | −1.75 | 10.51 | NS |
| ΔDBP (mmHg) | −1.45 | 6.74 | 1.56 | 7.04 | 3.27 | 5.62 | −2.83 | 9.90 | NS |
| ΔBMI (kg/m2) | 0.06 | 0.94 | 0.29 | 0.30 | 0.06 | 0.45 | 0.23 | 0.42 | NS |
| ΔWaist circumference (cm) | 0.50 | 2.12 | 0.79 | 1.20 | 0.89 | 3.12 | −0.33 | 3.99 | NS |
| ΔFasting glucose (mmol/L) | 0.12 | 1.62 | 1.19 | 0.85 | 0.79 | 1.28 | 0.38 | 0.91 | A |
| Δ2‐h PG (mmol/L) | 1.18 | 1.62 | 2.32 | 3.01 | 1.03 | 2.36 | 1.73 | 2.79 | NS |
| ΔHbA1c (%) | 0.02 | 0.43 | 0.56 | 0.62 | 0.31 | 0.32 | 0.29 | 0.34 | A |
| ΔInsulin (pmol/L) | −0.35 | 33.06 | 5.07 | 30.14 | −5.49 | 22.71 | −4.10 | 16.74 | NS |
| ΔTotal cholesterol (mmol/L) | −0.05 | 0.88 | 0.37 | 0.72 | 0.18 | 0.74 | 0.24 | 0.69 | NS |
| ΔTriglycerides (mmol/L) | −0.05 | 0.40 | 0.15 | 1.02 | 0.11 | 0.53 | 0.18 | 1.03 | NS |
| ΔHDL‐cholesterol (mmol/l) | 0.04 | 0.19 | 0.01 | 0.18 | 0.01 | 0.12 | 0.04 | 0.12 | NS |
| ΔLDL‐cholesterol (mmol/L) | −0.06 | 0.61 | 0.24 | 0.37 | 0.17 | 0.42 | 0.25 | 0.67 | NS |
| ΔAST (IU/L) | 2.36 | 4.50 | 5.11 | 4.34 | 1.00 | 4.36 | 4.92 | 5.14 | NS |
| ΔALT (IU/L) | 3.91 | 6.12 | 8.89 | 10.24 | 2.09 | 6.80 | 7.38 | 11.67 | NS |
| ΔγGT (IU/L) | 2.27 | 14.04 | 15.33 | 30.98 | 5.00 | 11.09 | −3.15 | 18.15 | NS |
| ΔCreatinine (mg/dL) | 0.08 | 0.02 | 0.12 | 0.09 | −0.16 | 0.12 | 0.14 | 0.12 | NS |
| ΔHOMA‐IR | 0.25 | 1.89 | 0.66 | 1.32 | −0.24 | 2.20 | −0.06 | 1.19 | NS |
| ΔHOMA‐B | −5.25 | 27.87 | −2.87 | 26.14 | −6.29 | 9.62 | −4.84 | 10.24 | NS |
| ΔQUICKI | 0.01 | 0.07 | −0.02 | 0.06 | −0.01 | 0.04 | 0.01 | 0.03 | NS |
| ΔhsCRP (mg/L) | −0.01 | 0.06 | 0.05 | 0.28 | 0.06 | 0.17 | −0.01 | 0.09 | NS |
| ΔTNF‐α (pg/mL) | −0.09 | 3.21 | 2.48 | 2.32 | 1.73 | 1.80 | 2.20 | 3.42 | A,C |
| ΔIL‐6 (pg/mL) | 1.72 | 10.41 | 10.11 | 12.83 | 8.44 | 19.19 | 7.06 | 14.91 | NS |
| ΔAdiponectin (μg/mL) | −0.47 | 2.05 | −0.50 | 2.27 | −0.70 | 1.34 | −1.19 | 3.74 | NS |
| ΔLeptin (pg/mL) | 0.67 | 2.54 | 0.18 | 2.38 | 0.38 | 2.76 | −0.53 | 2.08 | NS |
*Statistical significance by anova between groups. Post‐hoc analysis by least‐significant difference (mean difference between groups, P < 0.05 in all cases). A, placebo vs 1500 mg; ALT, alanine aminotransferase; AST aspartate aminotransferase; B, placebo vs 2000 mg; C, placebo vs 3000 mg; γGT, γ‐glutamyl transferase; HOMA‐B, homeostasis model assessment for β‐cell function; HOMA‐IR, homeostasis model assessment for insulin resistance; IL‐6, interleukin‐6; PG, postload glucose; QUICKI, quantitative insulin sensitivity check index; TNF‐α, tumor necrosis factor‐α.
Changes in Biomarkers (Concentrations of Adiponectin, hsCRP, TNF‐α, IL‐6 and Leptin) From Baseline
Adiponectin concentration did not change significantly during the 8 weeks in the placebo or ginsam groups. TNF‐α concentration in all ginsam groups and IL‐6 concentration in the 1500 mg ginsam group decreased significantly after 8 weeks (P < 0.05). TNF‐α concentration after the 8‐week treatment was significantly lower in the 1500 and 3000 mg ginsam groups than in the placebo group. The plasma concentrations of hsCRP and leptin did not change significantly after 8 weeks of treatment in any group (Table 2).
Other Parameters
Bodyweight, body mass index and waist circumference did not differ between groups, and did not change during the 8 weeks. Low‐density lipoprotein cholesterol concentration decreased slightly, by 0.24 ± 0.37 mmol/L in the 1500 mg ginsam group (P = 0.089). Other lipid concentrations did not change significantly after the 8 weeks in any group (Table 2).
Correlations Between Changes in HbA1c Level and Biomarkers
Because TNF‐α and IL‐6 concentrations were decreased after ginsam treatment, correlation analysis was carried out to investigate the relationships between the changes in HbA1c level and these markers. The change in HbA1c level of ginsam treatment correlated positively and significantly with the changes in TNF‐α and IL‐6 concentrations (Figure 3).
Figure 3.
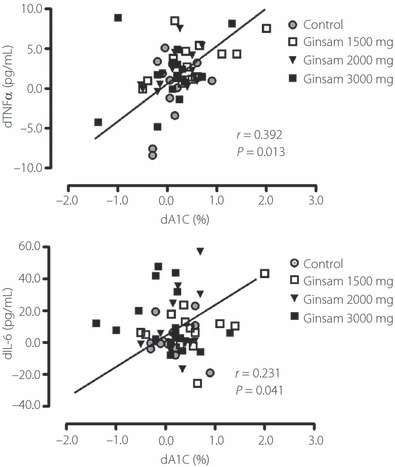
Correlations between the changes of HbA1c and the changes of tumor necrosis factor‐α (TNF‐α) or interleukin‐6 (IL‐6) levels. The changes of HbA1c were positively and significantly correlated with changes of TNF‐α and IL‐6.
Tolerability and Safety
Overview of AE
AE were reported by 11 (61.1%) patients treated with the placebo and by 36 (63.0%) patients treated with ginsam: 14 in the 1500 mg, 11 in the 2000 mg and 11 in the 3000 mg ginsam group. The most commonly reported AE were general weakness (16.7%) and gastrointestinal disturbance (11.1%) in the placebo group, and general weakness (16.7%), gastrointestinal disturbance (9.3%), upper respiratory infection (9.3%), musculoskeletal pain (7.4%) and pruritus (3.7%) in the ginsam‐treated groups (Table S1). The double‐blind therapy was discontinued as a result of all‐cause AE in five (9.3%) ginsam‐treated patients and in two (11.1%) placebo‐treated patients; the difference was not significant. No SAE were reported in any group, and no patient reported hypoglycemic symptoms during the study.
Blood Pressure and Biochemical Parameters
The changes in systolic and diastolic blood pressure did not differ significantly between groups. Within‐ and between‐treatment differences in liver function, as assessed by AST, ALT and γ‐glutamyl transferases levels, and in renal function, as assessed by serum creatinine concentration, were not significant.
Discussion
In the present study, ginsam, which was produced by vinegar extraction from P. ginseng to yield high concentrations of ginsenoside Rg3, showed possible glucose‐lowering effects in drug‐naïve patients with type 2 diabetes. The percentage of patients achieving >0.5% HbA1c reduction was greater in the ginsam‐treated group than in the placebo group. This glucose‐lowering effect was possibly attributable to the inflammatory process where TNF‐α and IL‐6 concentrations were decreased after ginsam treatment, and their changes were correlated with the changes in HbA1c level.
Various standardized formulas of ginseng products have been introduced4. Different preparation methods for processing ginseng products, and variable ages and species of ginseng contribute to the variability in the ginsenoside composition and the antihyperglycemic efficacy of individual ginseng products6,9,14,20–22. Among the many bioactive compounds contained in ginseng, the most representative active compounds are ginseng‐specific saponins (ginsenosides)8. Ginsenosides are comprised of a steroid skeleton and sugar moieties, and the type, number and position of the sugars determine its structure and function. Among the known species of ginsenosides, ginsenosides Rg1, Rh2, Rb1, Re and Rg3 have been reported to have glucose‐lowering effects in animal studies10,13,23,24. Recently, Reeds et al.25 reported that ginsenoside Re therapy does not improve β‐cell function or insulin sensitivity in overweight/obese subjects with impaired glucose tolerance or newly diagnosed diabetes. In the current study, we used ginsam, which was enriched with Rg3 and the main component of steam‐treated ginseng (red ginseng) or acid‐treated ginseng26. In an animal study, treatment of ginsam improved the metabolic profile in high‐fat fed ICR mice14. We reported recently that ginsam treatment decreased glucose excursion during the intraperitoneal glucose tolerance test by 21.5% in an obese insulin‐resistant rat model15. These beneficial effects of ginsam were related to an increased GLUT4 protein level in skeletal muscle, and increased peroxisome proliferator‐activated receptor‐γ protein level and AMP‐activated protein kinase phosphorylation in liver and skeletal muscle. Rg3 enhanced both basal and insulin‐induced glucose uptake in a dose‐dependent manner and increased the levels of phosphorylated IRS‐1/Akt and GLUT4 mRNA12.
Furthermore, there have been several studies documenting the role of Rg3 in improving pancreatic β‐cell function. A group reported that Rg3 increased glucose‐stimulated insulin secretion13, and another group showed that Rg3 suppressed palmitate‐induced apoptosis of pancreatic β‐cell lines27.
Interestingly, the ginsam‐induced improved glucose homeostasis was associated with decreased concentrations of pro‐inflammatory cytokines, TNF‐α and IL‐6, in the current study. Many studies have provided evidence of a critical role of TNF‐α and IL‐6 in the pathogenesis of diabetes and its complications through impairment of insulin signaling28–30, leading to a surge of interest in finding new antidiabetic agents that suppress the inflammatory pathway31. A recent study reported that a fermented form of P. ginseng protected against pancreatic β‐cell damage by downregulating inducible nitric oxide synthase and TNF‐α gene expression by blocking nuclear factor kappa B activities22. These data, along with the current study results, provide evidence for the anti‐inflammatory and anti‐oxidative effects of ginsam that contributed to improvement of glucose metabolism.
In the present study, treatment with ginsam for 8 weeks significantly reduced HbA1c level by 0.29–0.56%, which was lower than the potency of other oral antidiabetic agents proved in Korean drug‐naïve type 2 diabetic patients32. Furthermore, a dose–response relationship was not found. The reason for the lack of a linear relationship is not entirely clear. Drug compliance did not differ significantly between groups. It is possible that the dose range studied was too high, as was the case in a previous study16 and that a threshold of around 1500 mg of ginsam might be the most effective in improving glucose homeostasis. Also, the 8‐week treatment period might not have been long enough to assess the full effect of ginsam on glucose control.
Currently available oral antidiabetic drugs have a number of adverse effects, such as hypoglycemia, lactic acidosis and weight gain33. In the present study, ginsam was well tolerated, as there were no treatment‐related SAE and the frequency of side‐effects did not differ significantly between the ginsam and placebo groups. The number of patients who stopped the study medication for any reason did not differ between the ginsam and placebo groups (9.3% vs 11.1%). In addition, treatment with ginsam was at least weight neutral and did not cause hypoglycemia. Furthermore, ginsam did not alter hepatic or renal functions and did not modify cardiovascular risk factors, such as blood pressure or lipid profile.
There were some limitations in the present study. First, the gold standard technique for evaluating pancreas β‐cell function and insulin resistance, such as clamp study, were not used. Second, the study duration of 8 weeks did not allow assessment of long‐term results. Given the positive impact of low dose ginsam, it is conceivable that longer‐term ginsam use would result in a more durable glucose lowering effect. Third, just 18 patients were assigned to four respective arms, although 72 patients were enrolled as a whole. The relatively small number in each arm might be associated with weak significance. Finally, the baseline characteristics among the study groups were not strictly comparable, even though the differences were not statistically significant.
In conclusion, an 8‐week treatment with 1500 mg ginsam moderately improved the HbA1c level in type 2 diabetic patients with inadequate glycemic control. The present study suggests that 1500 mg ginsam might possibly be a viable option for glucose lowering in patients with diabetes who do not trust ‘Westernized’ medicine and would prefer to use botanical therapies without major side‐effects, but future phase III clinical studies are needed.
Supplementary Material
Table S1 All‐cause adverse events n (%) occurring in patients receiving placebo or ginsam
Supporting info item
Acknowledgments
This work was supported by a research grant from the Gyeonggi Biocenter and Yuyu pharmaceutical company. The opinions expressed in this paper are those of the authors and do not necessarily represent those of Yuyu. All authors had no potential conflicts of interest. The funding agency had no role in the study design, data collection and analysis, decision to publish, or preparation of the manuscript. The sole responsibility for the content of this manuscript lies with the authors.
References
- 1.Bahrke MS, Morgan WR. Evaluation of the ergogenic properties of ginseng: an update. Sports Med 2000; 29: 113–133 [DOI] [PubMed] [Google Scholar]
- 2.Dubick MA. Historical perspectives on the use of herbal preparations to promote health. J Nutr 1986; 116: 1348–1354 [DOI] [PubMed] [Google Scholar]
- 3.Vogler BK, Pittler MH, Ernst E. The efficacy of ginseng. A systematic review of randomised clinical trials. Eur J Clin Pharmacol 1999; 55: 567–575 [DOI] [PubMed] [Google Scholar]
- 4.Leung KW, Wong AS. Pharmacology of ginsenosides: a literature review. Chin Med 2010; 5: 1–7 [DOI] [PMC free article] [PubMed] [Google Scholar]
- 5.Lu JM, Yao Q, Chen C. Ginseng compounds: an update on their molecular mechanisms and medical applications. Curr Vasc Pharmacol 2009; 7: 293–302 [DOI] [PMC free article] [PubMed] [Google Scholar]
- 6.Vuksan V, Sung MK, Sievenpiper JL, et al. Korean red ginseng (Panax ginseng) improves glucose and insulin regulation in well‐controlled, type 2 diabetes: results of a randomized, double‐blind, placebo‐controlled study of efficacy and safety. Nutr Metab Cardiovasc Dis 2008; 18: 46–56 [DOI] [PubMed] [Google Scholar]
- 7.Sotaniemi EA, Haapakoski E, Rautio A. Ginseng therapy in non‐insulin‐dependent diabetic patients. Diabetes Care 1995; 18: 1373–1375 [DOI] [PubMed] [Google Scholar]
- 8.Yin J, Zhang H, Ye J. Traditional chinese medicine in treatment of metabolic syndrome. Endocr Metab Immune Disord Drug Targets 2008; 8: 99–111 [DOI] [PMC free article] [PubMed] [Google Scholar]
- 9.Yun SN, Moon SJ, Ko SK, et al. Wild ginseng prevents the onset of high‐fat diet induced hyperglycemia and obesity in ICR mice. Arch Pharm Res 2004; 27: 790–796 [DOI] [PubMed] [Google Scholar]
- 10.Attele AS, Zhou YP, Xie JT, et al. Antidiabetic effects of Panax ginseng berry extract and the identification of an effective component. Diabetes 2002; 51: 1851–1858 [DOI] [PubMed] [Google Scholar]
- 11.Hwang JT, Lee MS, Kim HJ, et al. Antiobesity effect of ginsenoside Rg3 involves the AMPK and PPAR‐gamma signal pathways. Phytother Res 2009; 23: 262–266 [DOI] [PubMed] [Google Scholar]
- 12.Kim M, Ahn BY, Lee JS, et al. The ginsenoside Rg3 has a stimulatory effect on insulin signaling in L6 myotubes. Biochem Biophys Res Commun 2009; 389: 70–73 [DOI] [PubMed] [Google Scholar]
- 13.Park MW, Ha J, Chung SH. 20(S)‐ginsenoside Rg3 enhances glucose‐stimulated insulin secretion and activates AMPK. Biol Pharm Bull 2008; 31: 748–751 [DOI] [PubMed] [Google Scholar]
- 14.Yun SN, Ko SK, Lee KH, et al. Vinegar‐processed ginseng radix improves metabolic syndrome induced by a high fat diet in ICR mice. Arch Pharm Res 2007; 30: 587–595 [DOI] [PubMed] [Google Scholar]
- 15.Lim S, Yoon JW, Choi SH, et al. Effect of ginsam, a vinegar extract from Panax ginseng, on body weight and glucose homeostasis in an obese insulin‐resistant rat model. Metabolism 2009; 58: 8–15 [DOI] [PubMed] [Google Scholar]
- 16.Vuksan V, Sievenpiper JL, Wong J, et al. American ginseng (Panax quinquefolius L.) attenuates postprandial glycemia in a time‐dependent but not dose‐dependent manner in healthy individuals. Am J Clin Nutr 2001; 73: 753–758 [DOI] [PubMed] [Google Scholar]
- 17.Yun TK, Choi SY. Non‐organ specific cancer prevention of ginseng: a prospective study in Korea. Int J Epidemiol 1998; 27: 359–364 [DOI] [PubMed] [Google Scholar]
- 18.Matthews DR, Hosker JP, Rudenski AS, et al. Homeostasis model assessment: insulin resistance and beta‐cell function from fasting plasma glucose and insulin concentrations in man. Diabetologia 1985; 28: 412–419 [DOI] [PubMed] [Google Scholar]
- 19.Quon MJ. QUICKI is a useful and accurate index of insulin sensitivity. J Clin Endocrinol Metab 2002; 87: 949–951 [DOI] [PubMed] [Google Scholar]
- 20.Xie JT, Aung HH, Wu JA, et al. Effects of American ginseng berry extract on blood glucose levels in ob/ob mice. Am J Chin Med 2002; 30: 187–194 [DOI] [PubMed] [Google Scholar]
- 21.Yang CY, Wang J, Zhao Y, et al. Anti‐diabetic effects of Panax notoginseng saponins and its major anti‐hyperglycemic components. J Ethnopharmacol 2010; 130: 231–236 [DOI] [PubMed] [Google Scholar]
- 22.Yuan HD, Chung SH. Protective effects of fermented ginseng on streptozotocin‐induced pancreatic beta‐cell damage through inhibition of NF‐kappaB. Int J Mol Med 2010; 25: 53–58 [PubMed] [Google Scholar]
- 23.Lai DM, Tu YK, Liu IM, et al. Mediation of beta‐endorphin by ginsenoside Rh2 to lower plasma glucose in streptozotocin‐induced diabetic rats. Planta Med 2006; 72: 9–13 [DOI] [PubMed] [Google Scholar]
- 24.Yang CY, Xie ZG, Cheng WB, et al. Effects of Panax notoginseng saponins on anti‐hyperglycemic, anti‐obese and prevention from kidney pathological changes in KK‐Ay mice. Zhong Yao Cai 2009; 32: 1571–1576 [PubMed] [Google Scholar]
- 25.Reeds DN, Patterson BW, Okunade A, et al. Ginseng and ginsenoside re do not improve {beta}‐cell function or insulin sensitivity in overweight and obese subjects with impaired glucose tolerance or diabetes. Diabetes Care 2011; 34: 1071–1076 [DOI] [PMC free article] [PubMed] [Google Scholar]
- 26.Bae EA, Han MJ, Choo MK, et al. Metabolism of 20(S)‐ and 20(R)‐ginsenoside Rg3 by human intestinal bacteria and its relation to in vitro biological activities. Biol Pharm Bull 2002; 25: 58–63 [DOI] [PubMed] [Google Scholar]
- 27.Kim K, Park M, Young Kim H. Ginsenoside Rg3 suppresses palmitate‐induced apoptosis in MIN6N8 pancreatic beta‐cells. J Clin Biochem Nutr 2010; 46: 30–35 [DOI] [PMC free article] [PubMed] [Google Scholar]
- 28.Solomon SS, Odunusi O, Carrigan D, et al. TNF‐alpha inhibits insulin action in liver and adipose tissue: a model of metabolic syndrome. Horm Metab Res 2010; 42: 115–121 [DOI] [PubMed] [Google Scholar]
- 29.Pradhan AD, Manson JE, Rifai N, et al. C‐reactive protein, interleukin 6, and risk of developing type 2 diabetes mellitus. JAMA 2001; 286: 327–334 [DOI] [PubMed] [Google Scholar]
- 30.Spranger J, Kroke A, Mohlig M, et al. Inflammatory cytokines and the risk to develop type 2 diabetes: results of the prospective population‐based European Prospective Investigation into Cancer and Nutrition (EPIC)‐Potsdam Study. Diabetes 2003; 52: 812–817 [DOI] [PubMed] [Google Scholar]
- 31.Goldfine AB, Fonseca V, Jablonski KA, et al. The effects of salsalate on glycemic control in patients with type 2 diabetes: a randomized trial. Ann Intern Med 2010; 152: 346–357 [DOI] [PMC free article] [PubMed] [Google Scholar]
- 32.Yoon KH, Shin JA, Kwon HS, et al. Comparison of the efficacy of glimepiride, metformin, and rosiglitazone monotherapy in Korean drug‐naive type 2 diabetic patients: the practical evidence of antidiabetic monotherapy study. Diabetes Metab J 2011; 35: 26–33 [DOI] [PMC free article] [PubMed] [Google Scholar]
- 33.Inzucchi SE. Oral antihyperglycemic therapy for type 2 diabetes: scientific review. JAMA 2002; 287: 360–372 [DOI] [PubMed] [Google Scholar]
Associated Data
This section collects any data citations, data availability statements, or supplementary materials included in this article.
Supplementary Materials
Table S1 All‐cause adverse events n (%) occurring in patients receiving placebo or ginsam
Supporting info item