

Abstract
Aims/Introduction: Accumulation of intramyocellular lipid (IMCL) is associated with insulin resistance. However, the factors affecting the change in IMCL remain to be elucidated. The aim of the present study was to determine the factors that influence the change in IMCL level after high‐fat loading.
Materials and Methods: The study subjects were 37 non‐obese men. Each subject consumed a high‐fat diet for 3 days after a normal‐fat diet for 3 days. After each diet program, IMCL levels in the tibialis anterior (TA‐IMCL) and soleus (SOL‐IMCL) were measured by proton magnetic resonance spectroscopy. Glucose infusion rate (GIR) was evaluated by euglycemic hyperinsulinemic clamp as an index of peripheral insulin sensitivity.
Results: The high‐fat diet significantly increased TA‐IMCL and SOL‐IMCL by ∼30 and ∼20%, respectively (P < 0.05), whereas it did not significantly alter GIR. The increase in SOL‐IMCL, but not in TA‐IMCL, negatively correlated with serum high molecular weight (HMW)‐adiponectin (r = −0.36, P < 0.05) and HMW‐/total‐adiponectin ratio (r = −0.46, P < 0.05). Although high‐fat diet‐related changes in SOL‐IMCL showed high inter‐individual variations, in subjects doing exercise, changes in SOL‐IMCL (r = 0.55, P < 0.05) and TA‐IMCL (r = 0.61, P < 0.05) positively correlated with daily physical activity level. In contrast, in sedentary subjects, changes in SOL‐IMCL (r = −0.50, P < 0.01) and TA‐IMCL (r = −0.48, P < 0.05) negatively correlated with daily physical activity.
Conclusions: HMW‐adiponectin and daily physical activity are determinants of IMCL accumulation by a high‐fat diet. Intriguingly, the effect of daily physical activity on the change in IMCL depends on the level of regular exercise. (J Diabetes Invest,doi: 10.1111/j.2040‐1124.2010.00091.x, 2011)
Keywords: Adiponectin, Intramyocellular lipid, Physical activity
Introduction
One of the main features of type 2 diabetes is insulin resistance in skeletal muscles1–3. Previous studies have shown that intracellular fat accumulation in skeletal muscle correlates closely with insulin sensitivity4–6. Intracellular substances related to intramyocellular lipid (IMCL), such as diacylglycerol and ceramide, activate signal transduction pathways and might elicit insulin resistance in skeletal muscle3.
The level of IMCL is affected by dietary composition. Several groups reported that a high‐fat diet increases IMCL levels in healthy subjects4,7,8 and endurance runners7,9. Of these, Bachmann et al.4 reported that 3‐day high‐fat diet intake increased IMCL levels in the tibialis anterior muscle (TA) and decreased insulin sensitivity. They also reported a high inter‐individual variation of IMCL changes after fat loading. We have also investigated the effect of high‐fat loading on IMCL level in TA, and found that a 3‐day fat challenge significantly altered IMCL levels in endurance runners, but not in sprinters9. These results also support the existence of inter‐individual differences in the susceptibility to accumulation of IMCL on fat loading.
Physical activity also affects IMCL level7,10,11. For example, 1‐h exercise at 65% maximum oxygen uptake was reported to decrease the IMCL level by ∼25% in healthy subjects7. These results suggest that vigorous physical activity rapidly decreases the IMCL level in healthy subjects7,11. However, the long‐term effects of exercise on IMCL level seem to be more complex. We reported previously that calorie restriction with moderate intensity physical activity (50–60% of maximum oxygen uptake) resulted in a decrease in IMCL and increase in insulin‐mediated glucose uptake in peripheral tissues in type 2 diabetic patients10. In the same study, we also found that changes in total physical activity correlated negatively with changes in IMCL10. In contrast, in endurance athletes, the IMCL level is higher than in healthy subjects, although their insulin sensitivity is higher than healthy subjects12. This phenomenon is known as the athlete’s paradox and is related to chronic vigorous physical activity, which increases IMCL level12,13. In addition, maximum oxygen uptake is positively correlated with IMCL levels in lean subjects9,14. Recently, Dube et al.15 showed that vigorous physical activity (75% heart rate maximum) can also increase IMCL, insulin sensitivity and maximum oxygen uptake in sedentary overweight‐obese subjects. Taken together, it seems that moderate physical activity (e.g., daily physical activity) decreases IMCL, whereas high‐intensity physical activity (e.g., regular exercise) chronically increase IMCL level.
Taking these findings into consideration, we hypothesized that inter‐individual variation of IMCL accumulation by high‐fat loading might be partly be a result of individual variation of daily physical activity and regular exercise. Thus, the present study was designed to investigate the effect of 3‐day fat loading on IMCL and insulin sensitivity in non‐obese healthy subjects, and searched for the determinants of IMCL accumulation by high‐fat loading taking the individual habit of exercise into consideration.
Materials and methods
Subjects
The study subjects were 37 non‐obese male volunteers (age 23.6 ± 0.5 years, body mass index 22.8 ± 0.4 kg/m2, total body fat 17.2 ± 1.0%, mean ± SEM). They were in good health as determined by medical history, a physical examination and standard blood chemistry analyses. For further analysis, the subjects were divided into two groups, depending on their engagement in regular exercise before the present study: the regular exercise group (RE, n = 20) included subjects who exercised for more than 30 min more than once a week, compared with the non‐regular exercise group (NRE, n = 17). All subjects gave written informed consent to the study, which was approved by the Ethics Committee of Juntendo University.
Study Design and Measurement of Various Parameters
Regular exercise was prohibited from 7 days before dietary intervention to the end of dietary intervention in all subjects. At 7 days before dietary intervention, the mean daily physical activity level without regular exercise was estimated with an ambulatory accelerometer (Lifecorder; Suzuken, Nagoya, Japan). Then, each subject consumed a 3‐day isocaloric normal‐fat diet, which was followed by a 3‐day high‐fat diet. All subjects were told to keep their daily physical activity at mean daily physical activity level ± 10% during dietary intervention, which was monitored by an accelerometer.
After the completion of both diet protocols, blood samples were taken after overnight fasting. The IMCL levels were measured by proton magnetic resonance spectroscopy (1H‐MRS) and peripheral insulin sensitivity was evaluated by euglycemic hyperinsulinemic clamp. Fasting blood glucose and free fatty acid (FFA) were measured using an autoanalyzer (SRL Laboratory, Tokyo, Japan). Plasma insulin concentrations were determined by radioimmunoassay (LINCO Research, St Charles, MO, USA). Serum adiponectin concentrations were measured by an enzyme‐linked immunosorbent assay (Daiichi Pure Chemicals, Tokyo, Japan)16. Total body fat content was measured by using the bioimpedance method (InBody; BIOSPACE, Tokyo, Japan). The maximum oxygen uptake was determined by an incremental exercise test with a calibrated mechanically braked cycle ergometer (818E; Monark, Vansbro, Sweden) and open‐circuit auto O2 and CO2 analyzers with a hot‐wire flow meter (MetaMax, Leipzig, Germany) as described previously (n = 27)9.
Dietary Manipulation
During the intervention period, subjects were provided a packed meal. Each subject was provided a 3‐day isocaloric normal‐fat loading (25% fat, 55% carbohydrate, 20% protein) and a 3‐day high‐fat diet (60% fat, 20% carbohydrate, 20% protein). The fat composition of the high‐fat diet was ∼45% saturated, ∼30% monounsaturated and ∼25% polyunsaturated fatty acid. This fat composition is a relatively high saturated fat and low unsaturated fat diet compared with the common Japanese diet (∼30% saturated, ∼40% monounsaturated and ∼30% polyunsaturated fatty acid). Weight‐maintained dietary calorie intake was estimated by basal metabolic rate and daily physical activity level. The energy and food content‐controlled diets were prepared by a food company (Musashino Foods, Saitama, Japan)9 and food intake was monitored during the study.
Proton Magnetic Resonance Spectroscopy
IMCL was measured in the overnight fasting state, as described previously9,10,17,18. Briefly, IMCL values of the right TA and soleus muscle (SOL) were measured by 1H‐MRS using a knee coil (VISART 1.5T EX V4.40; Toshiba, Tokyo, Japan). Voxels (1.2 × 1.2 × 1.2 cm3) were positioned in the muscle, avoiding visible interfascial fat and blood vessels, and the voxel sites were matched carefully at each examination. The imaging parameters were set as follows: repetition time, 1500 ms; echo time, 136 ms; acquisition numbers, 192 and 1024 data points over a 1000‐kHz spectral width. After examination, resonance was quantified by reference to the methylene signal intensity (S‐fat), with peaks being observed at ∼1.25 ppm. IMCL was quantified by the S‐fat and using a creatine signal at 3.0 ppm (Cre) as the reference, and was expressed as the ratio relative to Cre (S‐fat/Cre).
Euglycemic Hyperinsulinemic Glucose Clamp
Intravenous cannulas were placed in both forearms; one was used for insulin and glucose infusion, and the other for blood glucose sampling. Using an artificial pancreas (STG22; Nikkiso, Shizuoka, Japan), an euglycemic hyperinsulinemic glucose clamp study (target plasma glucose level of 95 mg/dL and insulin infusion rate of 100 mU/m2/min) was carried out as reported previously10. The steady‐state glucose infusion rate (GIR) was observed from 105 to 120 min. Peripheral insulin concentration rose to 198 ± 3 μU/mL (mean ± SEM), which is known to completely suppress endogenous glucose production19. Thus, the mean GIR during that period was used as a marker of peripheral insulin sensitivity9,10,17,18. Respiratory gases were analyzed using open‐circuit auto O2 and CO2 analyzers with a hot‐wire flow meter (MetaMax) before and after the clamp study. Metabolic flexibility was defined as insulin stimulated change in respiratory quotient (ΔRQ)20.
Statistical Analysis
All data are expressed as mean ± SEM. Differences between the two groups were tested using the unpaired t‐test. Data collected before and after treatment were compared using the paired t‐test. Spearman’s non‐parametric rank correlation coefficient was used to evaluate the correlation among various metabolic parameters. Multiple linear regression analysis was used to analyze independent determinants of changes in IMCL after high‐fat loading. The data of total adiponectin and HMW‐adiponectin were log‐transformed to yield a normal distribution before analysis. Statistical significance was set at P < 0.05.
Results
Characteristics of Subjects and High‐Fat Diet Induced Changes in Metabolic Parameters
Table 1 shows the effects of dietary intervention on various metabolic parameters and physical activity levels. Physical activity level was comparable during both dietary interventions. Fasting blood glucose and FFA levels were also comparable, whereas insulin concentrations were significantly decreased after the high‐fat diet. Total adiponectin concentrations were slightly, but significantly, decreased after the high‐fat diet, whereas high molecular weight (HMW)‐adiponectin level was not changed.
Table 1. Various clinical parameters after normal‐fat and high‐fat diet.
| Normal fat | High fat | |
|---|---|---|
| Daily physical activity (kcal/day) | 276.3 ± 16.3 | 269.9 ± 15.1 |
| Insulin (μU/mL) | 4.26 ± 0.32 | 3.32 ± 0.24* |
| Glucose (mg/dL) | 86.2 ± 0.9 | 85.9 ± 0.8 |
| FFA (mmol/L) | 0.42 ± 0.02 | 0.41 ± 0.02 |
| Total adiponectin (mg/mL) | 4.03 ± 0.31 | 3.79 ± 0.28* |
| High molecular weight adiponectin (mg/mL) | 1.46 ± 0.17 | 1.37 ± 0.16 |
| High molecular weight/total adiponectin ratio | 0.34 ± 0.02 | 0.34 ± 0.02 |
Data are mean ± SEM. FFA, free fatty acid. *P < 0.05 compared with normal‐fat diet.
Changes in GIR and Regional IMCL Levels After High‐Fat Diet
We investigated the effect of high‐fat loading on IMCL and GIR. High‐fat loading increased the TA‐IMCL level significantly by ∼30% (from 2.13 ± 0.19 to 2.68 ± 0.23 S‐fat/Cr, P < 0.01, Figure 1a), as well as SOL‐IMCL level by ∼20% (from 8.32 ± 0.69 to 10.1 ± 0.82 S‐fat/Cr, P < 0.01, Figure 1b). In contrast, the high‐fat diet did not significantly change the steady‐state GIR (Figure 1c). As shown in Figure 1, a high inter‐individual variation was noted in the effects of fat loading on IMCL and GIR changes. Next, we investigated the correlation between both parameters. There was a significant correlation between changes in TA‐ and SOL‐IMCL (r = 0.49, P = 0.005). Although changes in TA‐IMCL did not significantly correlate with those in GIR (r = −0.17, P = 0.33), changes in SOL‐IMCL significantly and negatively correlated with those in GIR (r = −0.41, P < 0.05).
Figure 1.
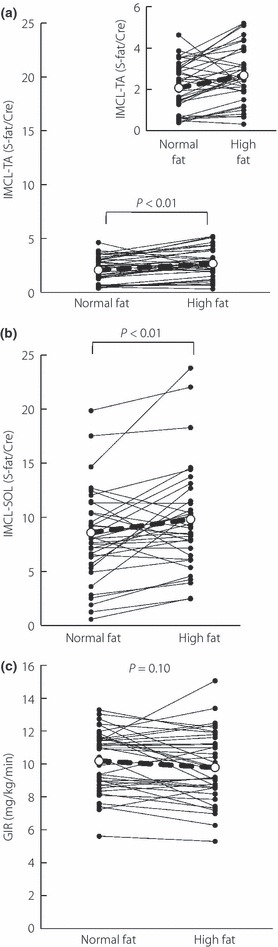
Changes in intramyocellular lipid (IMCL) and glucose infusion rate (GIR) during euglycemic hyperinsulinemic glucose clamp study in a high‐fat diet. (a) IMCL level in the tibialis anterior muscle (TA) after a normal‐fat and high‐fat diet. Close‐up figure is also shown. (b) IMCL level in soleus muscle (SOL) after normal fat and high‐fat diet. (c) GIR after normal fat and high‐fat diet.
Factors Associated with Increased IMCL After High‐Fat Loading
To identify the factors responsible for the increase of IMCL after high‐fat loading, we examined the relationship between changes in IMCL and various baseline parameters associated with fat metabolism, including body fat, IMCL level, FFA, GIR, fat oxidation rate, metabolic flexibility (ΔRQ), maximum oxygen uptake, daily physical activity, total‐adiponectin, HMW‐adiponectin and HMW‐ to total‐adiponectin ratio. The percentage change in SOL‐IMCL after the high‐fat diet correlated significantly with baseline SOL‐IMCL (r = −0.57, P < 0.01, Figure 2a), HMW‐adiponectin (r = −0.34, P < 0.05 Figure 2b) and HMW‐/total‐adiponectin ratio (r = −0.46, P < 0.05, Figure 2c), but not with any other parameter listed (data not shown). The multiple linear regression analysis identified baseline SOL‐IMCL (P < 0.001), HMW‐adiponectin (P < 0.05) and HMW‐/total‐adiponectin ratio (P < 0.05) as independent determinants of changes in SOL‐IMCL after high‐fat loading. Similar analyses for TA‐IMCL identified baseline TA‐IMCL level (r = −0.54, P < 0.01, Figure 2d) as the only significant determinant of percentage change in TA‐IMCL after high‐fat loading (data not shown).
Figure 2.
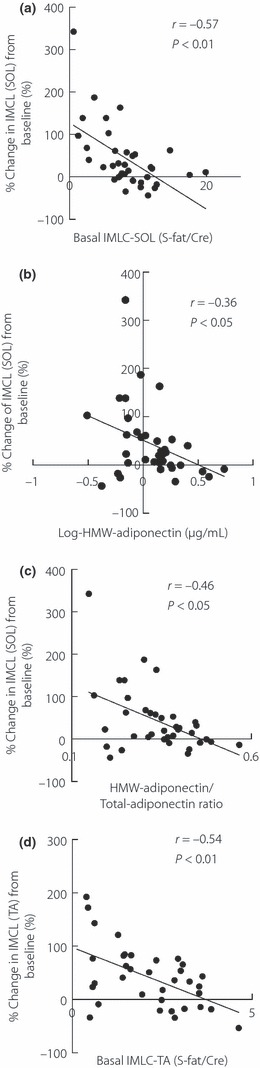
Determinants of percentage changes in intramyocellular lipid (IMCL) in soleus muscle (SOL) in a high‐fat diet and percentage change in IMCL in tibialis anterior muscle (TA) in a high‐fat diet. (a) Correlation between percentage change in IMCL levels in SOL and basal SOL‐IMCL levels. (b) Correlation between percentage change in IMCL levels and log‐transformed high‐molecular weight (HMW)‐adiponectin. (c) Correlation between percentage change in IMCL levels in SOL and HMW‐adiponectin/total‐adiponectin ratio. (d) Correlation between percentage change in IMCL levels in TA and basal TA‐IMCL levels.
Interaction Between Regular Exercise and Daily Physical Activity on IMCL
Evidence suggests that regular exercise and daily physical activity are regarded as candidate susceptible factors for IMCL level after high‐fat loading. Thus, we evaluated the role of daily physical activity after dividing the subjects into two groups depending on the habit of regular exercise: the regular exercise (RE) group and the non‐regular exercise (NRE) group. As shown in Table 2, the NRE group were significantly older. Daily physical activity level and maximum oxygen uptake were significantly higher in the RE group than the NRE group. High‐fat diet did not significantly change the steady‐state GIR in both groups (data not shown). In the NRE group, TA‐IMCL and SOL‐IMCL significantly increased after high‐fat diet (TA; from 2.01 ± 0.31 to 2.57 ± 0.37 S‐fat/Cr, P < 0.05, SOL; from 7.91 ± 1.22 to 10.57 ± 1.46 S‐fat/Cr, P < 0.01). In addition, there was a negative correlation between changes in TA‐IMCL and SOL‐IMCL with daily physical activity in the NRE group (TA; r = −0.48, P < 0.05, Figure 3a, SOL; r = −0.50, P < 0.01, Figure 3b). In contrast, the high‐fat diet did not significantly affect TA‐IMCL and SOL‐IMCL in the RE group (data not shown). Furthermore, changes in TA‐IMCL and SOL‐IMCL positively correlated with daily physical activity (TA; r = 0.61, P < 0.05, Figure 3c, SOL; r = 0.55, P < 0.05, Figure 3d).
Table 2. Clinical basal parameters of the non‐regular exercising and regular exercising groups.
| NRE | RE | |
|---|---|---|
| n | 17 | 20 |
| Age (years) | 24.8 ± 0.7 | 22.6 ± 0.6* |
| Weight (kg) | 68.4 ± 2.5 | 67.8 ± 2.1 |
| BMI (kg/m2) | 22.8 ± 0.7 | 22.8 ± 0.6 |
| Fat (%) | 17.8 ± 1.3 | 16.7 ± 1.4 |
| Daily physical activity (kcal/day) | 239.5 ± 20.2 | 301.7 ± 21.5* |
| Maximum oxygen uptake (mL/kg/min) | 44.5 ± 1.5 | 53.7 ± 2.3* |
| RQ | 0.82 ± 0.01 | 0.81 ± 0.01 |
| IMCL‐TA (S‐fat/Cre) | 2.01 ± 0.31 | 2.23 ± 0.25 |
| IMCL‐SOL (S‐fat/Cre) | 7.91 ± 1.22 | 8.67 ± 0.76 |
| GIR (mg/kg/min) | 9.7 ± 0.5 | 10.6 ± 0.4 |
| Total adiponectin (mg/mL) | 3.61 ± 0.40 | 4.39 ± 0.45 |
| High molecular adiponectin (mg/mL) | 1.20 ± 0.21 | 1.68 ± 0.25 |
Data are mean ± SEM. BMI, body mass index; GIR, glucose infusion rate; IMCL‐TA, intramyocellular lipid in tibialis anterior muscles; RQ, respiratory quotient; SOL‐IMCL, intramyocellular lipid in soleus muscle. *P < 0.05 compared with the non‐regular exercising (NRE) group.
Figure 3.
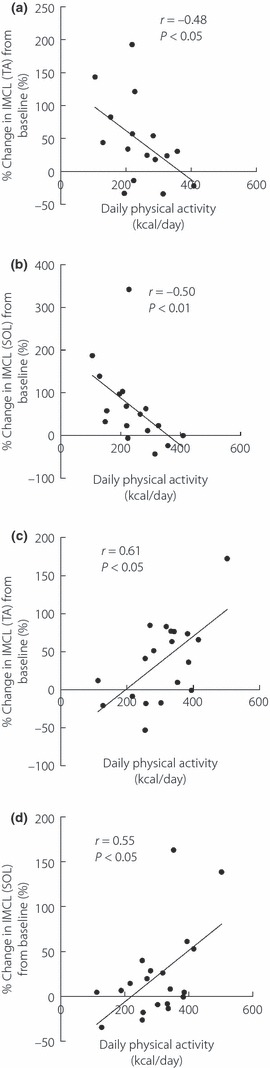
Relationship between daily physical activity and percentage change in intramyocellular lipid (IMCL) levels in regular exercise (RE) and non‐regular exercise group (NRE) groups. (a,b) Correlation between daily physical activity and percentage change in IMCL levels in (a) tibialis anterior muscle (TA) and (b) soleus muscle (SOL) in NRE group. (c,d) Correlation between daily physical activity and percentage change in IMCL levels in (c) TA and (d) SOL in the RE group.
Next, we divided the subjects into two groups depending on maximum oxygen consumption: low maximum oxygen uptake (<50 mL/kg/min, n = 16) group and high maximum oxygen uptake (≥50 mL/kg/min, n = 11) group. As estimated, in the low maximum oxygen uptake group, both changes in TA‐IMCL and SOL‐IMCL negatively correlated with daily physical activity (TA; r = −0.54, P < 0.05, Figure 4a, SOL; r = −0.55, P < 0.01, Figure 4b). In contrast, changes in TA‐IMCL positively correlated with physical activity in the high maximum oxygen uptake group (TA; r = 0.74, P < 0.01, Figure 4c, SOL; r = 0.36, P = 0.29, Figure 4d).
Figure 4.
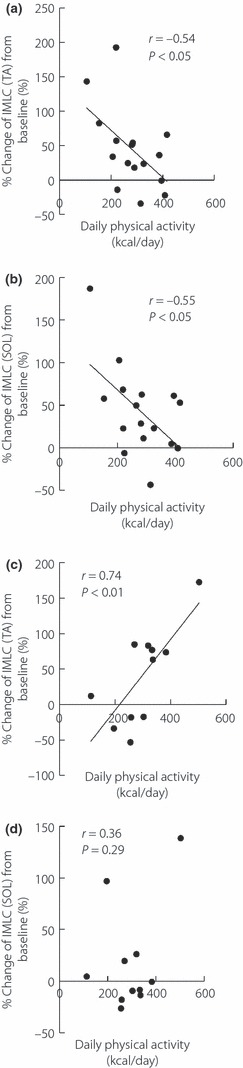
Relationship between daily physical activity and percentage change in intramyocellular lipid (IMCL) levels in higher and lower maximum oxygen uptake groups. The correlation between daily physical activity and percentage change in IMCL levels in (a) tibialis anterior muscle (TA) and (b) soleus muscle (SOL) in the low maximum oxygen uptake (<50 mL/kg/min, n = 16) group. The correlation between daily physical activity and percentage change in IMCL levels in (c) TA and (d) SOL in the high maximum oxygen uptake (≥50 mL/kg/min, n = 11) group.
Discussion
The present study evaluated the effect of 3‐day high‐fat loading on IMCL in non‐obese healthy subjects. High‐fat loading significantly increased IMCL, whereas a high inter‐individual variation in IMCL changes was observed. Serum HMW‐adiponectin and HMW‐/Total‐adiponectin ratio were identified as determinants of changes in IMCL by a high‐fat diet. Intriguingly, the change in IMCL correlated positively with daily physical activity in the RE group, whereas the change in IMCL correlated negatively with daily physical activity in the NRE group.
In the present study, GIR was not changed after the high‐fat diet, although we observed a significant increase in IMCL. IMCL is partly metabolized to diacylglycerol (DAG), which activates PKC that, in turn, impairs insulin signal transduction. Thus, DAG could be, at least partly, involved in the mechanism of lipid induced insulin resistance in skeletal muscle1–3. However, most of the lipid detected by 1H‐MRS method is triglyceride, which might not affect insulin sensitivity1–3. Therefore, increased IMCL does not always indicate elevated DAG level in myocytes. The inconsistency between IMCL and GIR might be, at least in part, a result of the methodological limitation of IMCL measurement by 1H‐MRS.
Adiponectin, a 30‐kDa protein, is secreted from adipocytes and has been shown to increase AMP‐activated protein kinase (AMPK) activity and decrease IMCL level, resulting in improved insulin sensitivity in animal models21. Adiponectin exists in a wide range of multimer complexes and circulates in plasma in three forms: a trimer (low‐molecular weight [LMW]), a hexamer (trimer–dimer) of medium‐molecular weight (MMW), and a larger multimeric high‐molecular weight (HMW) form22. It has been suggested that HMW‐adiponectin level and HMW‐to‐total adiponectin ratio might be superior biomarkers than total adiponectin level for insulin resistance and glucose intolerance23–25. In fact, our data showed that HMW‐adiponectin and HMW‐/total‐adiponectin ratio are good predictors of changes in IMCL level after high‐fat loading, whereas total‐adiponectin level did not significantly correlate with the change in IMCL. In contrast, some data showed that adiponectin is negatively associated with IMCL in humans26,27, whereas the other group reported no significant correlation between adiponectin and IMCL28. This discrepancy might be due to the fact that total adiponectin is not as sensitive a biomarker as HMW‐adiponectin to represent IMCL level.
It has been shown that increased physical activity augments fat oxidation during high‐fat loading29. In addition, it has been reported that uncontrolled physical activity level during 3‐day fat loading affects the susceptibility for IMCL accumulation after a high‐fat diet4. Consistent with these data, in the NRE group or in the low maximum oxygen uptake group, we observed a negative correlation between daily physical activity level and IMCL change after high‐fat loading.
In contrast, the daily physical activity level positively correlated with the change in IMCL level in the RE group. Similar correlations were also observed in the high maximum oxygen uptake group. Moderate exercise carried out after a meal reportedly results in several times higher plasma triglyceride (TG) and FFA uptake in the exercising legs, as well as for at least 4 h post‐exercise, whereas leg TG uptake is almost unchanged after meal ingestion without exercise30. It has been consistently shown that high‐fat loading after one bout of exercise results in an overshoot of IMCL level from baseline7. In addition, it has been shown that FFA uptake in skeletal muscles during prolonged exercise is higher in trained subjects compared with the untrained31. FFA uptake in skeletal muscle is regulated, at least in part, by lipoprotein lipase (LPL). LPL hydrolyzes TG and several transport proteins transport FFA into myocytes32, and its activity was acutely reduced by only ∼4‐h of physical inactivity33 and was augmented by vigorous exercise34. In addition, the amount of LPL protein in skeletal muscle is elevated by regular exercise35. Interestingly, it has been reported that the mRNA level of LPL in skeletal muscle positively correlated with the rate of IMCL repletion after exhaustive exercise36. Because IMCL level is determined by a balance between FFA influx and expenditure, these results suggest that physical activity‐induced FFA uptake might be exaggerated by regular exercise compared with the consumption of IMCL, thus enhancing IMCL accumulation. Further studies, including measurement of FFA kinetics, are required to confirm this hypothesis.
One limitation of the present study is that regular exercise has been defined at a relatively lower physical activity level (more than 30 min more than once a week), thus all of the regular exercise might not lead to the same conclusion. Another limitation of the present study is that we included only male subjects. It has been reported that fatty acid metabolism in skeletal muscle in males is different from females. Higher levels of IMCL were observed in female subjects compared with male subjects14,37. mRNA level of LPL in skeletal muscle was 160% higher in women than in men38. In addition, IMCL depletion during exercise was significantly higher in males compared with females39. Thus, the effects of a high‐fat diet and physical activity on IMCL accumulation and insulin sensitivity might differ between males and females.
Type I muscle fibers (oxidative slow‐twitch) have relatively higher fat oxidation and IMCL level compared with type II fibers (glycolytic fast‐twitch)2. Previous studies reported a tight correlation between TA‐ and SOL‐IMCL, although TA muscle contains relatively more type II fibers9,40. Our data also showed a good correlation between changes in TA‐ and SOL‐IMCL levels, suggesting that inter‐individual variation in IMCL change after a high‐fat diet might be conserved in all types of skeletal muscles.
In conclusion, 3‐day high‐fat loading in normal men resulted in a significant increase in IMCL. Inter‐individual variations in IMCL change might modulate insulin sensitivity after high‐fat loading. HMW‐adiponectin, daily physical activity and regular exercise might be susceptibility factors for IMCL accumulation during high‐fat loading.
Acknowledgements
This study was supported in part by a High Technology Research Center Grant and Grants‐in‐Aid for Scientific Research (B) from the Ministry of Education, Culture, Sports, Science and Technology of Japan, Ono Medical Foundation, Diabetes Masters Conference, and MIZUNO Sports Foundation. We thank Mrs Mutsuko Yoshikawa, Naoko Daimaru, Eriko Magoshi and Kiyomi Nakamura for their excellent technical assistance. This work was carried out in Juntendo University School of Medicine, Tokyo, Japan. We declare that we have no conflict of interest.
References
- 1.Boden G, Shulman GI. Free fatty acids in obesity and type 2 diabetes: defining their role in the development of insulin resistance and beta‐cell dysfunction. Eur J Clin Invest 2002; 32(Suppl. 3): 14–23 [DOI] [PubMed] [Google Scholar]
- 2.Kelley DE, Goodpaster BH, Storlien L. Muscle triglyceride and insulin resistance. Annu Rev Nutr 2002; 22: 325–346 [DOI] [PubMed] [Google Scholar]
- 3.Perseghin G, Petersen K, Shulman GI. Cellular mechanism of insulin resistance: potential links with inflammation. Int J Obes Relat Metab Disord 2003; 27(Suppl. 3): S6–S11 [DOI] [PubMed] [Google Scholar]
- 4.Bachmann OP, Dahl DB, Brechtel K, et al. Effects of intravenous and dietary lipid challenge on intramyocellular lipid content and the relation with insulin sensitivity in humans. Diabetes 2001; 50: 2579–2584 [DOI] [PubMed] [Google Scholar]
- 5.Krssak M, Falk Petersen K, Dresner A, et al. Intramyocellular lipid concentrations are correlated with insulin sensitivity in humans: a 1H NMR spectroscopy study. Diabetologia 1999; 42: 113–116 [DOI] [PubMed] [Google Scholar]
- 6.Virkamaki A, Korsheninnikova E, Seppala‐Lindroos A, et al. Intramyocellular lipid is associated with resistance to in vivo insulin actions on glucose uptake, antilipolysis, and early insulin signaling pathways in human skeletal muscle. Diabetes 2001; 50: 2337–2343 [DOI] [PubMed] [Google Scholar]
- 7.Decombaz J, Schmitt B, Ith M, et al. Postexercise fat intake repletes intramyocellular lipids but no faster in trained than in sedentary subjects. Am J Physiol Regul Integr Comp Physiol 2001; 281: R760–R769 [DOI] [PubMed] [Google Scholar]
- 8.Schrauwen‐Hinderling VB, Kooi ME, Hesselink MK, et al. Intramyocellular lipid content and molecular adaptations in response to a 1‐week high‐fat diet. Obes Res 2005; 13: 2088–2094 [DOI] [PubMed] [Google Scholar]
- 9.Tamura Y, Watada H, Igarashi Y, et al. Short‐term effects of dietary fat on intramyocellular lipid in sprinters and endurance runners. Metabolism 2008; 57: 373–379 [DOI] [PubMed] [Google Scholar]
- 10.Tamura Y, Tanaka Y, Sato F, et al. Effects of diet and exercise on muscle and liver intracellular lipid contents and insulin sensitivity in type 2 diabetic patients. J Clin Endocrinol Metab 2005; 90: 3191–3196 [DOI] [PubMed] [Google Scholar]
- 11.Larson‐Meyer DE, Newcomer BR, Hunter GR. Influence of endurance running and recovery diet on intramyocellular lipid content in women: a 1H NMR study. Am J Physiol 2002; 282: E95–E106 [DOI] [PubMed] [Google Scholar]
- 12.Goodpaster BH, He J, Watkins S, et al. Skeletal muscle lipid content and insulin resistance: evidence for a paradox in endurance‐trained athletes. J Clin Endocrinol Metab 2001; 86: 5755–5761 [DOI] [PubMed] [Google Scholar]
- 13.van Loon LJ, Goodpaster BH. Increased intramuscular lipid storage in the insulin‐resistant and endurance‐trained state. Pflugers Arch 2006; 451: 606–616 [DOI] [PubMed] [Google Scholar]
- 14.Thamer C, Machann J, Bachmann O, et al. Intramyocellular lipids: anthropometric determinants and relationships with maximal aerobic capacity and insulin sensitivity. J Clin Endocrinol Metab 2003; 88: 1785–1791 [DOI] [PubMed] [Google Scholar]
- 15.Dube JJ, Amati F, Stefanovic‐Racic M, et al. Exercise‐induced alterations in intramyocellular lipids and insulin resistance: the athlete’s paradox revisited. Am J Physiol 2008; 294: E882–E888 [DOI] [PMC free article] [PubMed] [Google Scholar]
- 16.Ebinuma H, Miyazaki O, Yago H, et al. A novel ELISA system for selective measurement of human adiponectin multimers by using proteases. Clin Chim Acta 2006; 372: 47–53 [DOI] [PubMed] [Google Scholar]
- 17.Sato F, Tamura Y, Watada H, et al. Effects of diet‐induced moderate weight reduction on intrahepatic and intramyocellular triglycerides and glucose metabolism in obese subjects. J Clin Endocrinol Metab 2007; 92: 3326–3329 [DOI] [PubMed] [Google Scholar]
- 18.Tamura Y, Watada H, Sato F, et al. Effects of metformin on peripheral insulin sensitivity and intracellular lipid contents in muscle and liver of overweight Japanese subjects. Diabetes Obes Metab 2008; 10: 733–738 [DOI] [PubMed] [Google Scholar]
- 19.Groop LC, Bonadonna RC, DelPrato S, et al. Glucose and free fatty acid metabolism in non‐insulin‐dependent diabetes mellitus. Evidence for multiple sites of insulin resistance. J Clin Invest 1989; 84: 205–213 [DOI] [PMC free article] [PubMed] [Google Scholar]
- 20.Kelley DE, Mandarino LJ. Fuel selection in human skeletal muscle in insulin resistance: a reexamination. Diabetes 2000; 49: 677–683 [DOI] [PubMed] [Google Scholar]
- 21.Yamauchi T, Kamon J, Minokoshi Y, et al. Adiponectin stimulates glucose utilization and fatty‐acid oxidation by activating AMP‐activated protein kinase. Nat Med 2002; 8: 1288–1295 [DOI] [PubMed] [Google Scholar]
- 22.Kadowaki T, Yamauchi T, Kubota N, et al. Adiponectin and adiponectin receptors in insulin resistance, diabetes, and the metabolic syndrome. J Clin Invest 2006; 116: 1784–1792 [DOI] [PMC free article] [PubMed] [Google Scholar]
- 23.Pajvani UB, Hawkins M, Combs TP, et al. Complex distribution, not absolute amount of adiponectin, correlates with thiazolidinedione‐mediated improvement in insulin sensitivity. J Biol Chem 2004; 279: 12152–12162 [DOI] [PubMed] [Google Scholar]
- 24.Hara K, Horikoshi M, Yamauchi T, et al. Measurement of the high‐molecular weight form of adiponectin in plasma is useful for the prediction of insulin resistance and metabolic syndrome. Diabetes Care 2006; 29: 1357–1362 [DOI] [PubMed] [Google Scholar]
- 25.Fisher FF, Trujillo ME, Hanif W, et al. Serum high molecular weight complex of adiponectin correlates better with glucose tolerance than total serum adiponectin in Indo‐Asian males. Diabetologia 2005; 48: 1084–1087 [DOI] [PubMed] [Google Scholar]
- 26.Thamer C, Machann J, Tschritter O, et al. Relationship between serum adiponectin concentration and intramyocellular lipid stores in humans. Horm Metab Res 2002; 34: 646–649 [DOI] [PubMed] [Google Scholar]
- 27.Weiss R, Dufour S, Groszmann A, et al. Low adiponectin levels in adolescent obesity: a marker of increased intramyocellular lipid accumulation. J Clin Endocrinol Metab 2003; 88: 2014–2018 [DOI] [PubMed] [Google Scholar]
- 28.Perseghin G, Lattuada G, De Cobelli F, et al. Serum retinol‐binding protein‐4, leptin, and adiponectin concentrations are related to ectopic fat accumulation. J Clin Endocrinol Metab 2007; 92: 4883–4888 [DOI] [PubMed] [Google Scholar]
- 29.Smith SR, de Jonge L, Zachwieja JJ, et al. Concurrent physical activity increases fat oxidation during the shift to a high‐fat diet. Am J Clin Nutr 2000; 72: 131–138 [DOI] [PubMed] [Google Scholar]
- 30.Enevoldsen LH, Simonsen L, Bulow J. Postprandial triacylglycerol uptake in the legs is increased during exercise and post‐exercise recovery. J Physiol 2005; 568: 941–950 [DOI] [PMC free article] [PubMed] [Google Scholar]
- 31.Turcotte LP, Richter EA, Kiens B. Increased plasma FFA uptake and oxidation during prolonged exercise in trained vs. untrained humans. Am J Physiol 1992; 262: E791–E799 [DOI] [PubMed] [Google Scholar]
- 32.Goldberg IJ, Eckel RH, Abumrad NA. Regulation of fatty acid uptake into tissues: lipoprotein lipase‐ and CD36‐mediated pathways. J Lipid Res 2009; 50(Suppl): S86–S90 [DOI] [PMC free article] [PubMed] [Google Scholar]
- 33.Bey L, Hamilton MT. Suppression of skeletal muscle lipoprotein lipase activity during physical inactivity: a molecular reason to maintain daily low‐intensity activity. J Physiol 2003; 551: 673–682 [DOI] [PMC free article] [PubMed] [Google Scholar]
- 34.Hamilton MT, Etienne J, McClure WC, et al. Role of local contractile activity and muscle fiber type on LPL regulation during exercise. Am J Physiol 1998; 275: E1016–E1022 [DOI] [PubMed] [Google Scholar]
- 35.Seip RL, Angelopoulos TJ, Semenkovich CF. Exercise induces human lipoprotein lipase gene expression in skeletal muscle but not adipose tissue. Am J Physiol 1995; 268: E229–E236 [DOI] [PubMed] [Google Scholar]
- 36.Schmitt B, Fluck M, Decombaz J, et al. Transcriptional adaptations of lipid metabolism in tibialis anterior muscle of endurance‐trained athletes. Physiol Genomics 2003; 15: 148–157 [DOI] [PubMed] [Google Scholar]
- 37.Perseghin G, Scifo P, Pagliato E, et al. Gender factors affect fatty acids‐induced insulin resistance in nonobese humans: effects of oral steroidal contraception. J Clin Endocrinol Metab 2001; 86: 3188–3196 [DOI] [PubMed] [Google Scholar]
- 38.Kiens B, Roepstorff C, Glatz JF, et al. Lipid‐binding proteins and lipoprotein lipase activity in human skeletal muscle: influence of physical activity and gender. J Appl Physiol 2004; 97: 1209–1218 [DOI] [PubMed] [Google Scholar]
- 39.Zehnder M, Ith M, Kreis R, et al. Gender‐specific usage of intramyocellular lipids and glycogen during exercise. Med Sci Sports Exerc 2005; 37: 1517–1524 [DOI] [PubMed] [Google Scholar]
- 40.Hwang JH, Pan JW, Heydari S, et al. Regional differences in intramyocellular lipids in humans observed by in vivo 1H‐MR spectroscopic imaging. J Appl Physiol 2001; 90: 1267–1274 [DOI] [PubMed] [Google Scholar]