

Abstract
Cholesterol 24-hydroxylase is a cytochrome P450 (CYP46A1) that is selectively expressed in the brain and is responsible for the majority of cholesterol turnover in the central nervous system. Mice deficient in 24-hydroxylase exhibit impaired learning and defective hippocampal long-term potentiation, suggesting that the metabolism of cholesterol by this enzyme is required for learning and memory formation. To determine where in the neuron cholesterol turnover was taking place, monoclonal antibodies directed against 24-hydroxylase were generated by immunization of mice with recombinant protein and used to detect the enzyme in brain homogenates, cultured neurons, and histological sections. 24-Hydroxylase was localized to the endoplasmic reticulum and was distributed throughout the cell bodies and dendrites of multiple types of neurons; the enzyme was not detected in axon terminals or in the cells of 24-hydroxylase knockout mice. 24-Hydroxylase was highly expressed in pyramidal neurons of the hippocampus and cortex, in Purkinje cells of the cerebellum, and in hippocampal and cerebellar interneurons. Within the retina, 24-hydroxylase was detected in ganglion cells and some but not all cells of the inner nuclear layer. These findings reveal the microsomal localization of 24-hydroxylase and provide subcellular insight into cholesterol turnover in the brain.
Indexing terms: monoclonal antibody, P450, cholesterol turnover, hippocampus, long-term potentiation
The human brain contains ~25% of the total body cholesterol pool but represents only a small percentage of body mass (~2%; Bjorkhem, 2006; Dietschy and Turley, 2004). The majority of brain cholesterol is contained within myelin sheaths elaborated by oligodendrocytes that surround and insulate neuronal axons, whereas smaller amounts are found in the plasma membranes of neurons and glial cells. Unvarying cholesterol levels are essential for oligodendrocytes to maintain the insulatory properties of their myelin sheaths (Bjorkhem, 2006; Dietschy and Turley, 2004). In contrast, the continued synthesis and turnover of cholesterol are necessary in neurons for learning and the production of long-term potentiation (LTP), an electrophysiological correlate of learning (Kotti et al., 2006). The adult brain meets these seemingly disparate needs by exactly balancing cholesterol synthesis and catabolism (Quan et al., 2003).
To these ends, small amounts of cholesterol are synthesized and broken down daily within select neurons of the central nervous system. Synthesis involves the conversion of acetyl-CoA into cholesterol by ≥20 enzymes, whereas a majority of catabolism is accomplished by a single enzyme, cholesterol 24-hydroxylase, which converts cholesterol into 24(S)-hydroxycholesterol (Bjorkhem and Meaney, 2004; Lund et al., 1999). 24(S)-hydroxycholesterol is membrane permeable and, once synthesized, crosses the cellular membrane and the blood–brain barrier and enters the peripheral circulation from which it is cleared by the liver (Bjorkhem et al., 2001; Li-Hawkins et al., 2000). The metabolism of cholesterol to 24(S)-hydroxycholesterol is offset by an equal amount of synthesis, ensuring that steady-state levels of cholesterol do not vary within the tissue. The equilibrium between synthesis and breakdown is illustrated in 24-hydroxylase knockout mice, in which an ~50% reduction in catabolism is balanced by a similar reduction in de novo cholesterol synthesis, thus maintaining wild-type levels of cholesterol in the brains of the mutant animals (Lund et al., 2003). Accordingly, these mice have no observed defects in brain anatomy or myelination; however, the mutant mice do exhibit severe deficiencies in behavioral learning and hippocampal LTP (Kotti et al., 2006).
Expression of 24-hydroxylase has been documented in multiple regions of the brain, including the hippocampus, cortex, and cerebellum, by immunohistochemistry using a polyclonal antiserum raised against a peptide antigen and by in situ mRNA hybridization (Lund et al., 1999). These regions of the brain, especially area CA1 of the hippocampus, are involved in learning and memory (Sweatt, 2003; Whitlock et al., 2006). The enzyme appears to be expressed in only a subset of neurons, suggesting that constant cholesterol synthesis and turnover are crucial for the specific functions of these select cells. One of these functions is LTP of synaptic transmission at Schaffer collateral-CA1 synapses, as shown by the deficit in LTP production at these synapses in 24-hydroxylase knockout mice. The metabolic basis of this defect was traced to the lack of adequate amounts of newly synthesized geranylgeranyl-pyrophosphate, a nonsterol end product of the cholesterol biosynthetic pathway (Kotti et al., 2006).
It is currently unknown what roles the cellular distribution and subcellular localization of 24-hydroxylase have in cholesterol turnover and higher order brain functions. To gain insight into these roles, we generated three monoclonal antibodies that recognize 24-hydroxylase and used these probes to determine the enzyme’s cell type-specific expression patterns and subcellular localizations within individual neurons. The data confirm and extend the exclusive neuronal expression of 24-hydroxylase reported previously and show that, within neurons, the protein is localized throughout the endoplasmic reticulum (ER) of the soma and dendrites.
MATERIALS AND METHODS
Production of mouse monoclonal antibodies recognizing 24-hydroxylase
Partially purified, recombinant human 24-hydroxylase protein (HΔ46A1) was prepared as described by Mast et al. (2003). This protein contained four histidine residues at the amino terminus and lacked the membrane anchor region of the protein (amino acids 3–27). Four 8-week-old female BALB/c mice (Harlan Sprague Dawley, Inc., Indianapolis, IN) were each injected with 75 μg of HΔ46A1 emulsified in an equal volume of RIBI Adjuvant R-700 (Corixa, Hamilton, MT). These and all other experiments involving mice in this study followed protocols approved by the UT Southwestern Institutional Animal Care and Use Committee. The mice each received three priming injections of 25 μg HΔ46A1 consisting of two dorsal subcutaneous injections and one intraperitoneal injection. After 4 weeks, one mouse received a booster intraperitoneal injection of 100 μg HΔ46A1 mixed with an equal volume of phosphate-buffered saline (PBS), pH 7.4. Three days later, this mouse was killed, the spleen was dissected under sterile conditions, and the tissue was dissociated into a single-cell suspension using a 150-mesh sieve (CD-1; Sigma-Aldrich, St. Louis, MO). Spleenocytes and Sp 2/0 myeloma cells were washed separately in PBS three times, collected by centrifugation for 10 minutes at 228g, and then combined (~108 spleenocytes: 2.5 × 10⁶ myeloma cells) and pelleted in the same tube. The cells were resuspended in 1 ml of 50% (w/v) polyethylene glycol 1500 (10783641001; Roche Applied Science, Indianapolis, IN) and allowed to fuse for 1 minute. Treated cells were collected by centrifugation at 100g for 8 minutes and resuspended in complete medium [Dulbecco’s modified Eagle’s medium (DMEM) containing 4.5 g/liter glucose supplemented with 10% (v/v) fetal calf serum, 10 mM HEPES pH 7.0, 50 μM β-mercaptoethanol, 100 units/ml penicillin, 100 μg/ml streptomycin sulfate, and 1% (v/v) mouse interleukin-6 (mIL-6; 11444581001; Roche Applied Science)] to approximately 2.5 × 10⁶ cells/ml, and then plated (100 μl/well) into five 96-well flat-bottom tissue-culture plates. The plates were transferred to an incubator maintained at 37°C in a 5% CO2 atmosphere. After 24 hours, the cultures were supplemented with 100 μl of 2× HAT (H0262; Sigma-Aldrich) in complete medium containing IL-6 to achieve a final concentration of 100 μM hypoxanthine (H), 0.4 μM aminopterin (A), and 16 μM thymidine (T). Replacements of 1× HAT medium were performed every second day. As soon as hybridoma growth became macroscopically visible (~day 11), supernatants were screened for relevant antibodies by ELISA (see below).
ELISA-positive clones were expanded to 24-well tissue cultures plates in 1X HT medium (H0137; Sigma-Aldrich) containing 100 μM H and 16 μM T. Twenty-two hybridomas of 100 macroscopically visible clones produced antibodies against the antigen as determined by ELISA. These 22 hybridoma supernatants were further subjected to secondary screening by immunocytochemistry of Chinese hamster ovary (CHO)-K1 cells expressing the mouse 24-hydroxylase (see below) when hybridoma growth reached appropriate levels (~days 13–14). Immunocytochemically positive clones were expanded to 10-ml culture volumes in T-25 tissue culture flasks in 1× HT medium. Three hybridoma supernatants (designated 1A7, 1F11, and 1F4) of 22 specifically stained expressing CHO-K1 cells and were subjected to tertiary screening by immunoblotting of brain homogenates from wild-type and 24-hydroxylase knockout (Lund et al., 2003) mice as described below. Two of the three hybridoma supernatants (1A7 and 1F11) detected a single protein of the predicted molecular weight (~50,000) of 24-hydroxylase that was absent in samples from 24-hydroxylase knockout animals. Subcloning of the three positive hybridoma lines (1A7, 1F11, and 1F4) was performed by limiting dilution as follows: 100, 10, and 1 cells/well were seeded into 96-well flat-bottom tissue-culture plates. When growth was macroscopically visible, hybridoma supernatants were screened by ELISA. All wells of the 100 cells/well and 10 cells/well plates were ELISA-positive, indicating the stability of the hybridoma lines. The culture well with the highest optical density at 450 nm from the 1 cell/well plate was expanded, and subcloning was repeated as described above for a total of four rounds. The immunoglobulin subtypes of the final hybridoma clones were determined with an ELISA-based isotyping kit according to the manufacturer’s instructions (172-2051; Bio-Rad, Hercules, CA). All experiments were performed with monoclonal antibodies produced by the hybridomas arising from the fourth round of subcloning. Hybridomas were maintained in complete medium without IL-6, HAT, or HT.
ELISA
Ninety-six-well microtiter plates (MaxiSorp 442404; Nunc, Rochester, NY) were coated overnight at 4°C with 50 μl/well of HΔ46A1 protein at 5 μg/ml in 50 mM Tris-acetate buffer, pH 7.4, containing 20% (v/v) glycerol. Plates were washed twice with phosphate-buffered saline (PBS) containing 0.05% (v/v) Tween 20 (PBS-T). Tissue culture supernatants were diluted with an equal volume of PBS containing 0.1% (v/v) Tween 20, added to the wells, and incubated for 2–3 hours at 37°C. Plates were then washed three times with PBS-T. Horseradish peroxidase-conjugated goat anti-mouse IgG (170-6516; Bio-Rad) was diluted 1:2,000 in PBS-T, added to the wells, and incubated for 5 minutes at room temperature. Plates were then washed four times with PBS-T. A fresh mixture of peroxidase substrates containing 1 volume of 20 mM tetramethylbenzidine in acetone/methanol (1:9) and 20 volumes of 2 mM H2O2 in 0.1 M potassium citrate buffer, pH 4.25, was prepared, and 0.2 ml was added to each well. The reaction was incubated for 5 minutes at room temperature and stopped with 0.1 ml of 1 M H2SO4. The absorbance at 450 nm was measured on a microtiter plate reader (Opsys MR; Dynex Technologies, Chantilly, VA).
Transfection
For immunocytochemistry, CHO-K1 cells (American Type Culture Collection, Manassas, VA) were plated at a density of 9 × 10³ cells/well in 24-well tissue culture plates containing 22-mm2 glass coverslips in DMEM and Ham’s F12 (50:50 mix) medium supplemented with 5% (v/v) fetal calf serum, 100 U/ml penicillin, and 100 μg/ml streptomycin sulfate. On the following day, cells were transfected with 0.5 μg plasmid DNA per well encoding no protein (pCMV6), the mouse 24-hydroxylase (pCMV6-mc24), the human 24-hydroxylase (pCMV6-hc24), and/or the rat NADPH cytochrome P450 reductase (pCMV6-rat CP450 Red) using Fugene 6 reagent (11988387001; Roche Applied Science) and incubated at 37°C in a 5% CO2 atmosphere for approximately 18 hours prior to fixation as described below.
For immunoblotting of transfected cell lysates, human embryonic kidney-293 (HEK-293; American Type Culture Collection) cells were plated in 60-mm dishes at a density of 4 × 10⁵ cells/dish in DMEM containing 1 g/liter glucose supplemented with 10% (v/v) fetal calf serum, 100 U/ml penicillin, and 100 μg/ml streptomycin sulfate. Two days after plating, cells were transfected with 3 μg plasmid DNA per well (pCMV6, pCMV6-mc24, or pCMV6-hc24) using Fugene 6 reagent and incubated at 37°C in an 8.8% CO2 atmosphere for approximately 18 hours. Cells were washed once with ice-cold PBS and scraped into ice-cold RIPA buffer [50 mM Tris-HCl, pH 8.0, 150 mM NaCl, 1% (v/v) NP-40, 0.5% (w/v) sodium deoxycholate, and 0.1% (w/v) sodium dodecyl sulfate (R0278; Sigma-Aldrich)] containing Complete Protease Inhibitor tablets (EDTA-free; 11836170001; Roche Applied Science). The cells were lysed by passage through a 23-gauge needle 10–15 times. Cellular debris was removed by centrifugation at 2,000g for 5 minutes at 4°C, and the resulting supernatant was removed to a fresh tube, aliquoted, and stored at −20°C. The protein concentration of the cell lysate was determined by bicinchoninic acid assay (BCA Assay; 23225; Pierce Biotechnology, Rockford, IL).
Preparation of tissue homogenates and microsomes
Brain homogenates were prepared from adult wild-type and 24-hydroxylase knockout mice (mixed strain background, C57Bl/6J;129S6/SvEv) as well as from adult rats and one adult rabbit. Whole brains were minced with a scalpel and then homogenized in a glass-Teflon homogenizer in ice-cold Tris-acetate buffer [50 mM Tris-acetate, pH 7.4, 2 mM CaCl2, 10% (w/v) sucrose] containing Complete Protease Inhibitor tablets (EDTA-free; Roche Applied Science). Samples were further homogenized by passage through a 23-gauge needle and clarified by centrifugation at 1,500g for 15 minutes at 4°C in a desktop microcentrifuge. The resulting supernatant was removed to a fresh tube, aliquoted, and stored at −80°C. The protein concentration of the homogenate was determined by BCA assay.
Homogenates and microsomes from embryonic day 16 mouse cortex and hippocampus and from mature primary cell cultures derived from the cortex and hippocampus were prepared. Embryonic cortices and hippocampi from one litter (four to eight embryos) of wild-type or 24-hydroxylase knockout mice were dissected into ice-cold Tris-acetate buffer as described for the preparation of primary cell cultures below. Similarly, primary cells grown for 14 days in vitro were washed once in PBS and scraped into ice-cold Tris-acetate buffer. The samples were homogenized by sequential trituration with P1000 and P200 micropipettors, followed by passage through a 23-gauge needle. The cell debris and nuclei were removed by centrifugation at 1,500g for 15 minutes at 4°C to yield a crude homogenate, which was further centrifuged at 100,000g for 30 minutes at 4°C to yield a microsomal pellet. The pellet was resuspended in a small volume of buffer A [50 mM Tris-HCl, pH 7.4, 1 mM EDTA, 20% (v/v) glycerol] containing Complete Protease Inhibitor (EDTA-free; Roche Applied Science). The protein concentrations of the homogenates and microsomes were determined by BCA assay.
Immunoblotting procedures
To assess the reactivity and specificity of monoclonal antibodies (Fig. 1A), 30 μg of wild-type and knockout total brain homogenates were subjected to SDS-PAGE. For assessment of monoclonal antibody reactivity against the mouse vs. human recombinant 24-hydroxylase proteins (Fig. 1B), increasing amounts (2–10 μg) of pCMV6-mc24-or pCMV6-hc24-transfected cell lysate and 10 μg of pCMV6-transfected lysate were subjected to SDS-PAGE. To determine monoclonal antibody reactivity against the mouse, rat, and rabbit 24-hydroxylase proteins (Fig. 1C), 40 μg total brain homogenates and 1 μg transfected cell lysates were subjected to SDS-PAGE. To examine 24-hydroxylase expression in mouse embryonic cortex and hippocampus and primary cells (Fig. 1D), 75 μg embryonic brain and 25 μg cell microsomal fractions were subjected to SDS-PAGE.
Fig. 1.

Assessment of monoclonal antibody specificity. A: Monoclonal antibodies 1A7, 1F4, and 1F11 were used in immunoblotting experiments of whole-brain homogenates from wild-type and 24-hydroxylase knockout mice as described in Materials and Methods. 1A7 and 1F11 specifically detected a protein with the predicted molecular weight of 24-hydroxylase (~50,000), whereas 1F4 did not. Immunoblotting with an antiserum recognizing βIII-tubulin showed that equal amounts of protein were present in each sample. B: Immunoblotting of 24-hydroxylase in transfected CHO-K1 cells. Increasing amounts of total cell homogenate from cells expressing the mouse 24-hydroxylase (m24, lanes 2–6), human 24-hydroxylase (h24, lanes 7–11), and homogenate from mock-transfected cells (lane 1) were separated by SDS-PAGE and subjected to immunoblotting with antibodies 1A7 and 1F11. Both antibodies recognized the mouse and human 24-hydroxylases. C: Cross-species recognition of 24-hydroxylase by monoclonal antibodies 1A7 and 1F11. Transfected (TF) cell homogenates and whole-brain homogenates from mouse, rat, and rabbit were subjected to immunoblotting with antibodies 1A7 and 1F11. Both antibodies detect 24-hydroxylase from each of the three species. Immunoblotting with an antiserum recognizing α-tubulin showed that equal amounts of protein were present in each sample. D: Immunodetection of 24-hydroxylase in mouse embryonic brain tissue and cultured neurons. Microsomal membrane proteins were isolated from dissected embryonic day 16 cortex and hippocampal regions or from neurons prepared from these regions and cultured for 14 days in vitro. Immunoblotting experiments with 1A7 and 1F11 revealed the 24-hydroxylase protein in both wild-type (WT) preparations but not in the samples prepared from 24-hydroxylase knockout (KO) mice. Immunoblotting with an antiserum recognizing P450 reductase showed that equal amounts of protein were present in each sample analyzed. In the detection of 24-hydroxylase, lanes marked E16 Brain were exposed to film for 1.5 minutes; those marked 1° Neuron were exposed to film for 30 seconds.
All protein samples were diluted 1:1 with 2× Laemmli sample buffer (161-0737; Bio-Rad) containing 5% (v/v) β-mercaptoethanol and boiled at 95°C for 10 minutes. Samples were loaded onto 10% Ready Gel Tris-HCl polyacrylamide gels (161-1155; Bio-Rad) with Kaleidoscope and Precision Plus Blue (161-0324 and 161-0373, respectively; Bio-Rad) molecular weight markers. Gels were electrophoresed at 100 V for approximately 1.5 hours in 1× Tris-glycine-SDS (TGS; 161-0772; Bio-Rad) running buffer, followed by electrophoretic transfer to nitrocellulose membranes (Hybond-C Extra; GE Healthcare Biosciences, Piscataway, NJ) for 1.25 hours in a tank transfer apparatus (Hoefer TE 22; Hoefer, San Francisco, CA) at 100 V. Protein transfer was verified by staining with Ponceau S (P7170; Sigma-Aldrich), and membranes were incubated for at least 1 hour at room temperature in 10% (w/v) milk dissolved in PBS-T. Primary antibodies were incubated overnight at 4°C. Monoclonal antibodies were used as neat hybridoma tissue culture supernatants (20–25 μg/ml antibody) supplemented with Tween 20 to 0.05% (v/v). The membranes were washed three times for 10 minutes each with PBS-T. Horseradish peroxidase-conjugated goat-anti-mouse secondary antibody (115-035-003; Jackson Immunoresearch, West Grove, PA) was diluted 1:10,000 in 10% (w/v) milk-PBS-T and incubated for 1 hour at room temperature. The membranes were washed three times for 10 minutes each with PBS-T, blotted briefly on paper towels, and incubated for 2 minutes in ECL reagent (RPN2106; GE Healthcare Biosciences) or for 5 minutes in SuperSignal West Pico chemiluminescent substrate (34080; Pierce Biotechnology) and exposed to film (X-Omat Blue; Kodak, New Haven, CT). For the detection of proteins that served as loading controls, membranes were stripped for 35 minutes at room temperature with Restore Western Blot Stripping Buffer (21059; Pierce Biotechnology), washed twice in PBS-T, and incubated for 1 hour in 10% (w/v) milk. Mouse anti-βIII-tubulin, mouse anti-α-tubulin, and rabbit anti-NADPH cytochrome P450 reductase antibodies were obtained and diluted (Table 1) in 10% (w/v) milk-PBS-T and then incubated with the filter overnight at 4°C. Washing, secondary antibody incubation, and chemiluminescence detection were repeated as described above. Films were scanned and imported into Adobe Illustrator for figure preparation.
TABLE 1.
Antibodies Used in This Study
| Antigen | Dilution | Clonality | Species | Immunizing antigen | References | Source |
|---|---|---|---|---|---|---|
| NADPH-P450 reductase (P450 red) | 1:800–1:1,000 | Polyclonal | Rabbit | Purified protein | Recognizes a single protein of predicted molecular mass (~78 kDa) in brain and hippocampal neuron homogenates by immunoblotting (mfr’s technical information, Fig. 1; D. Ramirez, unpublished data). Recognizes recombinant and endogenous protein by immunofluorescence (Figs. 2, 5). Enriched in microsomal fractions (D. Ramirez, unpublished data) | Stressgen Bioreagents, Victoria, British Columbia Canada; OSA-300 |
| Protein disulfide isomerase (PDI) | 1:500 | Polyclonal | Rabbit | Purified bovine liver PDI | Recognizes a ~58 kDa protein corresponding to the predicted molecular mass of PDI by immunoblotting (mfr’s technical information; see also (Colombo et al., 2005; Mezgrahani et al., 2000) | Stressgen Bioreagents; SPA-890 |
| Brain lipid binding protein (BLBP) | 1:1,000 | Polyclonal | Rabbit | Recombinant BLBP | Recognizes the ~15 kDa BLBP by immunoblotting (mfr’s technical information). BLBP-positive cells exhibit astrocytic morphology and BLBP staining is not present in cultured neurons (Fig. 3; see also Feng et al., 1994; Rousselot et al., 1997) | Chemicon, Charlottesville, VA; AB9558 |
| Calnexin | 1:500 | Polyclonal | Rabbit | Recombinant fragment containing amino acids 1–70 of human calnexin | Recognizes single protein of ~90 kDa, the predicted molecular mass of calnexin in mouse hippocampal neuron extracts (D. Ramirez, unpublished data; Kotti et al., 2006). Enriched in microsomal fractions (D. Ramirez, unpublished data) | Santa Cruz Biotechnology, Santa Cruz, CA; sc-11397 |
| NADPH-cytochrome b5 reductase 3 (b5 Reductase) | 1:100 | Polyclonal | Rabbit | Recombinant human b5 reductase | Recognizes a single protein of ~35 kDa, the predicted molecular mass of b5 reductase in human liver samples (mfr’s technical information). Independent antibodies generate ER and mitochondrial staining in a variety of cell types (Colombo et al., 2005; Zhu et al., 2004) | ProteinTech Group, Chicago, IL; 10894-1-AP |
| Manganous superoxide dismutase (MnSOD) | 1:100 | Polyclonal | Rabbit | Recombinant human MnSOD | Recognizes the ~24 kDa MnSOD by immunoblotting of L6 skeletal muscle lysates (mfr’s technical information). Staining pattern is similar to MitoTracker (Invitrogen) staining and recombinant fluorescent mitochondrial targeted protein expression in neurons (Beltran-Parrazal et al., 2006; Chang and Reynolds, 2006) | Upstate Biotechnology, Lake Placid, NY; 06-984 |
| Prohibitin | 1:100 | Polyclonal | Rabbit | Amino acids 247–262 (IAYQLSRSRNITYLPA) of human prohibitin conjugated to KLH | Recognizes a single protein of ~30 kDa representing prohibitin by immunoblotting of HeLa, Jurkat, and A431 cell lysates and produces a mitochondrial staining pattern in HeLa cells by immunofluorescence (mfr’s technical information; see also Ikonen et al., 1995) | Abcam, Cambridge, MA; ab28172 |
| Mannose-6-phospate receptor (M6PR) | 1:500 | Monoclonal | Mouse IgG2a | Purified bovine M6PR | Detects a 215-kDa protein representing M6PR under reducing conditions by immunoblotting of HeLa cell lysates; immunofluorescence in HeLa cells results in perinuclear vesicular staining (mfr’s technical information). Staining pattern in neurons is similar (data not shown). | Abcam; ab2733 |
| Golgi matrix protein of 130 kDa (GM130) | 1:1,500 | Polyclonal | Rabbit | Peptide antigen, amino acids 968–983 (GSNPCIPFFYRADEND) of human GM130 with N-terminal lysine, conjugated to KLH | Recognizes GM130 (130 kDa) by immunoblotting of rat NRK cell lysates. Perinuclear staining concentrated on one side of the nucleus is observed in rat NRK cells (mfr’s technical information). An independent antibody produces a similar staining pattern in PC12 cells (data not shown; (Sannerud et al., 2006) | Sigma-Aldrich, St. Louis, MO; G7295 |
| Glutamic acid decarboxylase of 67 kDa (GAD67) | 1:600 | Monoclonal | Mouse IgG2a, clone 1G10.2 | Recombinant fusion protein containing unique N-terminal regions of GAD67 not shared by GAD65 | A single protein of ~67 kDa is detected by immunoblotting of rat cerebellar cortex and mouse brain microsomes (Fong et al., 2005; Kotti et al., 2006). Immunohistochemistry of rat brainstem showed a pattern similar to that previously reported by in situ mRNA hybridization (Fong et al., 2005) | Chemicon; MAB5406 |
| Synaptophysin | 1:200 | Polyclonal | Rabbit | Synthetic peptide conjugated to KLH (GYGDAGYCQGP GGYGPQDSYG PQGGYQPD) | Detects a single protein of the predicted molecular mass (~40 kDa) in immunoblots of mouse brain microsomes (D. Ramirez, unpublished data; see also (Johnston et al., 1989) | Dr. Thomas Sudhof, UT Southwestern Medical Center; K831 |
| Synapsin | 1:200 | Polyclonal | Rabbit | Synthetic peptide of the shared N-terminal regions of synapsins I and II (NYLRRRLSDS NFMANLPNGY MTDLQRPQP) | Detects all four synapsins by immunoblotting of mouse brain homogenates (Rosahl et al., 1993) | Dr. Thomas Sudhof, UT Southwestern Medical Center; E028 |
| Rab3A | 1:200 | Polyclonal | Rabbit | Peptide, (CASCTDSRYGQKE) | Detects a single protein of the predicted molecular mass (28 kDa) in immunoblots of mouse brain microsomes (Kotti et al., 2006; see also Fischer von Mollard et al., 1990) | Dr. Thomas Sudhof, UT Southwestern Medical Center; P583 |
| βIII-Tubulin | 1:5,000 | Monoclonal | Mouse IgG2a | Peptide antigen, residues 436–450 of neuronal-specific βIII tubulin; epitope mapped to EAQGPK | Detects a single protein of the predicted molecular mass (~50 kDa, Fig. 1A; see also Flajollet et al., 2006; Lee et al., 1990; and mfr’s technical information) | Upstate Biotechnology; 05-559 |
| α-Tubulin | 1:2,000 | Monoclonal | Mouse IgG1 | Full-length native chicken α-tubulin purified from brain; epitope mapped to residues 426–450 | Detects a single protein of the appropriate molecular mass (~50 kDa, Fig. 1C; see also Berasi et al., 2006; and mfr’s technical information) | Abcam; ab7291 |
| Microtubule-associated protein 2 | 1:500 | Polyclonal | Rabbit | Recombinant fragment of amino acids 1–300 of human MAP-2 | Detects a single protein of ~70 kDa in immunoblots of IMR-32 and SK-N-SH cell lysates, which is the predicted size of the low-molecular-mass isoform of MAP-2 (mfr’s technical information). Staining pattern is similar to MAP-2 monoclonal antibody (Kosik and Finch, 1987; Longart et al., 2004) | Santa Cruz Biotechnology; sc-20172 |
| Brain spectrin (240/235) | 1:500 | Polyclonal | Rabbit | Mouse brain spectrin isolated from enriched synaptic/axonal membranes | Recognizes an ~240 kDa subunit of brain spectrin in immunoblots of brain and primary neuron proteins. Produces axonal staining in mouse brain sections and primary neurons (data not shown; Riederer et al., 1986) | Chemicon; AB992 |
| Phosphorylated neurofilament protein (SMI-31, 06-17) | 1:500 | Monoclonal IgG1 | Mouse | Homogenized rat hippocampus | Detects phosphorylated neurofilaments (primarily heavy isoform) in immunoblots of purified neurofilament and primary neuron proteins. Axonal staining detected in mouse cerebellar sections and primary neurons (data not shown; Goldstein et al., 1983; Sternberger and Sternberger, 1983) | Covance, Princeton, NJ; SMI-31R |
Primary cell culture
Primary cells from wild-type and 24-hydroxylase knockout mice were prepared using a modification of a protocol described for rat neurons (Banker and Goslin, 2002). A pregnant mouse at 15–17 days of gestation was anesthetized with isoflurane and killed by cervical dislocation. The uterus was dissected, male and female fetuses were decapitated, and heads were removed to ice-cold Hank’s balanced salt solution (HBSS; calcium and magnesium free; 14175-079; Invitrogen, Carlsbad, CA). Brains were extricated and cortical lobes placed in ice-cold HBSS. The meninges were removed, and the hippocampus and cortex were dissected free of the thalamic regions under a dissecting microscope (Leica Wild MZ8). Trypsin-EDTA (15400-054; Invitrogen) was added to the tissue from a 10× stock for a final concentration of 0.05% (v/v) and incubated at 37°C for 15 minutes. The digestion was stopped by the addition of 200 μl fetal bovine serum, and tissue was collected by centrifugation at 800g for 2 minutes. The supernatant was decanted, and 900 μl dissociation medium [HBSS containing 12 mM Mg2+, 0.025% (w/v) deoxyribonuclease, 0.4 mg/ml trypsin inhibitor, and 2 mg/ml bovine serum albumin] was added to the pellet and incubated for 5 minutes at 37°C. The tissue was dissociated by trituration 40 times with a P200 micropipettor or until no clumps remained. Dissociated cells were diluted with 5 ml Neurobasal medium (21103-049; Invitrogen) supplemented with 100 U/ml penicillin, 100 μg/ml streptomycin sulfate, 1 mM L-glutamine, and 2% (v/v) B27 (17504-044; Invitrogen) and collected by centrifugation at 800g for 3 minutes. Supernatant was decanted; the cell pellet was resuspended in 5-ml of Neurobasal medium supplemented as described above, and the cells were collected by centrifugation. The final cell pellet was resuspended in a volume (in ml) of supplemented Neurobasal medium equal to the number of brains dissected, resulting in a cell suspension containing approximately 8 × 10⁶ cells/ml. Cells were plated onto poly-D-lysine (50 μg/ml; P7280; Sigma-Aldrich)-coated six-well tissue culture plates for biochemical experiments at a density of 1.3 × 10⁶ cells/well or onto poly-D-lysine-coated 24-well plates containing prewashed 12-mm-diameter No. 0 round German glass coverslips (63-3009; Carolina Biological Supply, Burlington, NC) for immunocytochemical experiments at a density of 5 × 10⁵ cells/well. On day 4 after plating, one-half of the medium volume was removed and replaced with fresh supplemented Neurobasal medium. Neurons were grown in a 37°C, 5% CO2 incubator and analyzed after 14 days in culture.
Immunocytochemistry
CHO-K1 cells and primary cells grown on coverslips were processed for immunocytochemistry in the same manner. Cells were washed once with 37°C PBS and fixed in 4% (w/v) paraformaldehyde (PFA; 19200; Electron Microscopy Sciences, Hatfield, PA) in PBS at room temperature for 15 minutes. Cells were then rinsed four times with PBS and either processed for immunocytochemistry immediately or stored in PBS at 4°C for up to 2 weeks prior to staining. The cells were incubated for 10 minutes at room temperature in 1% (w/v) glycine in PBS to reduce fixative-induced autofluorescence. Next, cells were permeabilized with 0.2% (v/v) Triton X-100 (Surfact-Amps X-100; 28314; Pierce Biotechnology) in PBS for 10 minutes at room temperature, then treated to reduce nonspecific staining by incubation for at least 1 hour in a solution of 10% (v/v) normal goat serum (G9023; Sigma-Aldrich), 5% (v/v) bovine serum albumin (37525; Pierce Biotechnology), and 0.025% (v/v) Triton X-100 in PBS (NGS blocking solution). Primary antibody incubation was overnight at 4°C. Staining with anti-24-hydroxylase monoclonal antibodies 1A7, 1F4, and 1F11 was performed using neat hybridoma culture supernatants containing 20–25 μg/ml antibody and supplemented with 0.025% (v/v) Triton X-100. For double staining of 24-hydroxylase and subcellular markers, the second antibody (see below) was added directly to the hybridoma supernatant solution containing 0.025% Triton X-100, and the mixture was then transferred to cells.
The primary antibodies used in this study are described in Table 1. They were directed against NADPH-cytochrome P450 reductase, protein disulfide isomerase (PDI; Colombo et al., 2005; Mezgrahani et al., 2000), brain lipid binding protein (Feng et al., 1994; Rousselot et al., 1997), calnexin, NADPH-cytochrome b5 reductase (Colombo et al., 2005; Zhu et al., 2004), manganous superoxide dismutase (MnSOD; Beltran-Parrazal et al., 2006; Chang and Reynolds, 2006), prohibitin (Ikonen et al., 1995), mannose-6-phosphate receptor (M6PR), Golgi matrix protein of 130 kDa (GM130; Sannerud et al., 2006), glutamic acid decarboxylase of 67 kDa (GAD67; Fong et al., 2005), synaptophysin (Johnston et al., 1989), synapsin (Rosahl et al., 1993), Rab3A (Fischer von Mollard et al., 1990), βIII-tubulin (Flajollet et al., 2006; Lee et al., 1990), α-tubulin (Berasi et al., 2006), microtubule-associated protein 2 (MAP2; Kosik and Finch, 1987; Longart et al., 2004), brain spectrin (Riederer et al., 1986), and phosphorylated neurofilament protein (Goldstein et al., 1983; Sternberger and Sternberger, 1983). The specificity of each antiserum was tested in immunoblots of total cell lysate protein prepared from wild-type primary neurons cultured for 14 days as described above. All antisera detected a single protein of the expected molecular weight except for the GM130 antiserum, which also weakly bound two additional proteins; the synaptophysin antiserum, which weakly bound one other protein, and the brain spectrin antiserum, which weakly detected one additional protein and possibly aggregates of spectrin. Antisera against brain lipid binding protein and the M6PR did not recognize any proteins in immunoblotting experiments performed as described above.
For detection of lysosomes, cells were incubated with 60 nM Lysotracker red (L-7528, Invitrogen) in Neurobasal complete medium for 45 minutes at 37°C, washed once, fixed in 4% PFA, and processed for 1A7 immunocytochemistry in the dark. After primary antibody incubation, coverslips were washed three times in PBS-T for 10 minutes each at room temperature. Goat anti-mouse secondary antibodies conjugated to Alexa Fluor 488 and goat anti-rabbit secondary antibodies conjugated to Alexa Fluor 594 (highly cross-adsorbed against other species; A-11029 and A-11037; Invitrogen) were diluted 1:1,000 in NGS blocking solution and incubated with coverslips for 1 hour in the dark. In experiments with 1A7 and the M6PR or GAD67 primary antibodies, subtype-specific goat anti-mouse IgG1 conjugated to Alexa Fluor 488 and goat anti-mouse IgG2a conjugated to Alexa Fluor 594 secondary antibodies were used (A-21121 and A-21135; Invitrogen). The coverslips were washed three times with PBS-T for 10 minutes each. After the last wash, coverslips were mounted using ProLong Gold Antifade reagent (P-36931; Invitrogen) containing 4′,6-diamidino-2-phenylindole (DAPI) and allowed to cure overnight at room temperature in the dark before imaging. Each batch of secondary antibody used in these studies was tested in control experiments to ensure that, when it was applied to cells or sections in the absence of primary antibody, no background staining was observed.
Immunocytochemistry experiments were imaged on an Applied Precision Deltavision RT wide-field epifluorescence deconvolution microscope equipped with a Photometrics CoolSNAPHQ monochromatic digital camera using the associated SoftWorx image acquisition software. Images were subjected to 10 iterations of constrained de-convolution using the enhanced aggressive method. The objectives used consisted of an Olympus U Apo ×40, 1.35 NA, and an Olympus U Plan Apo ×100, 1.35 NA. Exposure times were held constant for images comparing transfected and untransfected or wild-type vs. knockout samples. Images presented in Figures 2–5 represent a single z slice from the stack, selected for the best focus in Image J (National Institutes of Health) software. Image J was also used to adjust the brightness and contrast of the images, levels of which were again held constant for comparison of different samples. For colocalization analysis (see Figs. 2–6 and Table 2), ×100 image stacks of 1A7 and subcellular marker double-stained neurons were rendered in three dimensions in Imaris 3D (Bitplane) software. Background was subtracted from all three channels using a filter width of 16.112249 μm. The images were filtered with an edge preserving filter of width 0.063 μm. The images were thresholded, and intensity was adjusted to reduce background further and to highlight the region of interest (the subcellular structures of the neuron) using the blend feature of the volume projection. The image stack was cropped in the x and y dimensions to remove parts of the image that did not contain the neuron, and out-of-focus slices were deleted from the top and bottom of the stack as necessary. The “coloc” feature, with automatically detected thresholds, was then employed to obtain the Pearson correlation coefficient of colocalization between green (24-hydroxylase) and red (subcellular markers) staining. A Pearson correlation coefficient of greater than 0.5 was considered to indicate significant colocalization. A minimum of three images from two independent experiments (n = 6 neurons) was analyzed in this fashion to determine the average Pearson correlation coefficients shown in Table 2. The colocalized pixels were displayed in white as the coloc channel. To obtain 3D renderings of the images as shown in Figure 6, the volume for the red, green, and white (colocalized) channels was displayed as an Iso Surface projection. The opacity of the red and green channels was adjusted to 75% in the enlarged images (Fig. 5,D,I,E,J) to allow for better visualization of the colocalized pixels. For final figure preparation, TIF files obtained as described above were imported into Adobe Illustrator.
Fig. 2.

Localization of 24-hydroxylase in transfected cells by immunofluorescence. CHO-K1 cells were transfected with a mouse 24-hydroxylase expression plasmid and stained with the DNA binding dye DAPI and an irrelevant monoclonal antibody, 3C11 (A), or monoclonal antibodies 1F11 (B) or 1F4 (C) that recognize 24-hydroxylase. Green fluorescence represents 24-hydroxylase, and nuclear DNA is shown in blue. A reticular staining pattern is observed in expressing cells with 1F11 and 1F4 but not with the irrelevant antibody 3C11. In D–F, CHO-K1 cells were cotransfected with mouse 24-hydroxylase and rat NADPH-cytochrome P450 reductase (P450 Red), then stained with 24-hydroxylase monoclonal antibody 1A7, a rabbit polyclonal antibody recognizing P450 Red, and DAPI. 24-Hydroxylase staining is shown in green, P450 reductase staining in red, and DNA staining in blue. The merged image (F) shows strong colocalization, indicated by a yellow color, between exogenously expressed 24-hydroxylase and P450 reductase. In G–I, CHO-K1 cells transfected with the mouse 24-hydroxylase plasmid were stained with 1A7, a rabbit polyclonal antiserum recognizing endogenous protein disulfide isomerase (PDI), and DAPI. DNA staining appears in blue, 24-hydroxylase staining in green, and PDI in red. Yellow staining in the merged image (I) indicates that 24-hydroxylase colocalized with endogenous PDI. Scale bar = 5 μm.
Fig. 5.

Colocalization of 24-hydroxylase with a known endoplasmic reticulum protein in cultured mouse neurons. A–C: Wild-type (WT) primary neurons were prepared as described in Materials and Methods and stained with DAPI, monoclonal antibody 1A7, and a polyclonal antiserum recognizing the NADPH-cytochrome P450 reductase (P450 Red). 24-Hydroxylase staining is shown in green and P450 reductase staining in red. Nuclei are shown in blue. The merged image shows strong colocalization of the two staining patterns in the cell body and somewhat less colocalization in the dendrites. D–F: 24-Hydroxylase knockout (KO) neurons were stained with DAPI, 1A7, and P450 reductase antibodies. No staining of 24-hydroxylase (green fluorescence) was detected, although the P450 reductase (red fluorescence) staining pattern was the same as that observed in wild-type neurons. Scale bar = 5 μm.
Fig. 6.

24-Hydroxylase is expressed in the endoplasmic reticulum, which extends throughout the dendrites of cultured mouse neurons. Wild-type neurons were prepared as described in Materials and Methods and stained with the 1A7 monoclonal antibody recognizing 24-hydroxylase and a polyclonal antiserum recognizing NADPH-cytochrome P450 reductase (P450 Red; A–E) or 1A7 and a rabbit polyclonal antiserum recognizing synaptophysin (F–J). Sections of proximal dendrites are shown. Merged images on the left (C–E) show many areas of colocalization between 24-hydroxylase (green) and P450 reductase (red), whereas merged images on the right (H–J) show little or no colocalization between 24-hydroxylase (green) and synaptophysin (red). Portions of the dendrites (boxed insets C,H) were rendered in three dimensions, and then enlarged four times (D,I) or 10 times (E,J). Colocalized pixels are shown in white in these three-dimensional images. The reticular patterns of 24-hydroxylase and P450 reductase are visible. Scale bars = 1 μm in A (applies to A–C,F–H); 0.25 μm in D (applies to D,I); 0.1 μm in E (applies to E,J).
TABLE 2.
Average Pearson Correlation Coefficients for 24-Hydroxylase and Various Subcellular Markers as Determined by Double Immunostaining1
| Subcellular marker | Organelle | Average Pearson coefficient |
|---|---|---|
| Calnexin | ER | 0.74 |
| PDI | ER | 0.71 |
| P450 reductase | ER | 0.68 |
| b5 Reductase | ER | 0.6 |
| MnSOD | Mitochondria | 0.45 |
| Prohibitin | Mitochondria | 0.38 |
| M6PR | Endosome | 0.34 |
| Lysotracker | Lysosome | 0.27 |
| GM130 | Golgi | 0.26 |
| GAD67 | Presynaptic | 0.17 |
| Synapsin | Presynaptic | 0.06 |
Wild-type neurons were cultured and immunostained as described in Materials and Methods. Colocalization analysis was performed in Imaris software on a minimum of three neurons from two separate experiments (n ≥ 6 neurons) to obtain average Pearson correlation coefficients. A coefficient greater than 0.5 was considered to indicate substantial colocalization between two compared proteins. Correlation coefficients between 24-hydroxylase and ER resident proteins were consistently higher than those obtained for proteins found in other subcellular compartments. PDI, protein disulfide isomerase; MnSOD, manganous superoxide dismutase; M6PR, mannose 6-phosphate receptor; GM130, Golgi matrix protein of 130 kDa; GAD67, glutamic acid decarboxylase of 67 kDa; ER, endoplasmic reticulum.
Immunohistochemistry
For preparation of brain cryosections, 3-month-old (Figs. 7A–D, 8, 9) or 14-month-old (Fig. 7E,F) female wild-type and 24-hydroxylase knockout mice (C57Bl/6J background) were overdosed with isoflurane and perfused through the heart with PBS, followed by 4% PFA in PBS. The brains were removed and postfixed overnight at 4°C in 4% PFA in PBS. The brains were cryoprotected with three 24-hour incubations at 4°C in graded sucrose solutions of 10%, 18%, and 30% (all w/v) in PBS. After 24 hours of incubation in 30% sucrose, the brains were embedded in Optimal Cutting Temperature (OCT) compound (Sakura Finetek, Torrance, CA) and frozen by immersion of the block in a dry ice/isopentane bath and stored at −80°C until cryosectioning. Various sagittal sections (10 μm) were collected onto positively charged slides, allowed to dry overnight, and stored at −80°C until processed for immunohistochemistry. For preparation of retinal and optic nerve cryosections, 3-month-old male albino wild-type (C57Bl/6J; 129S6/SvEv; SJL/J background) and 24-hydroxylase knockout mice (C57Bl/6J background) were anesthetized with isoflurane and killed by cervical dislocation. The eyes were removed, and the posterior eyecups or dissected optic nerves were immersion fixed in 4% PFA in PBS at 4°C for 30 minutes. The tissues were cryoprotected with 20-minute incubations at 4°C in graded sucrose solutions of 10%, 18%, and 30% (all w/v) in PBS, then embedded in OCT as described above. Transverse sections (6 μm) were collected onto positively charged slides, allowed to dry overnight, and stored at −80°C until processed for immunohistochemistry.
Fig. 7.
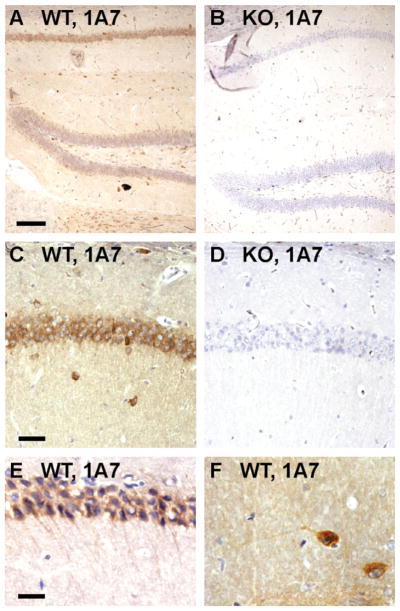
Expression of 24-hydroxylase in the hippocampus. A–F: Cryosections were prepared from female wild-type (WT) and 24-hydroxylase knockout (KO) mouse brains and stained with the monoclonal antibody 1A7, and immunocomplexes were visualized by diaminobenzidine-streptavidin-horseradish peroxidase (DAB-HRP) staining. Strong expression was detected in the CA1 region (A), in which 24-hydroxylase staining was visible in the cell bodies and dendrites of pyramidal neurons. Lower levels of expression were detected in the granule neurons of the dentate gyrus, whereas hilar interneurons had high levels of 24-hydroxylase expression (C). No staining was detected in hippocampal sections from knockout mouse brains (B,D). Higher magnification (×40) images of wild-type sections demonstrate 24-hydroxylase staining in CA1 dendrites (E) and those of an interneuron in the stratum radiatum (F). Scale bars = 100 μm in A (applies to A,B); 50 μm in C (applies to C,D); 25 μm in E (applies to E,F).
Fig. 8.
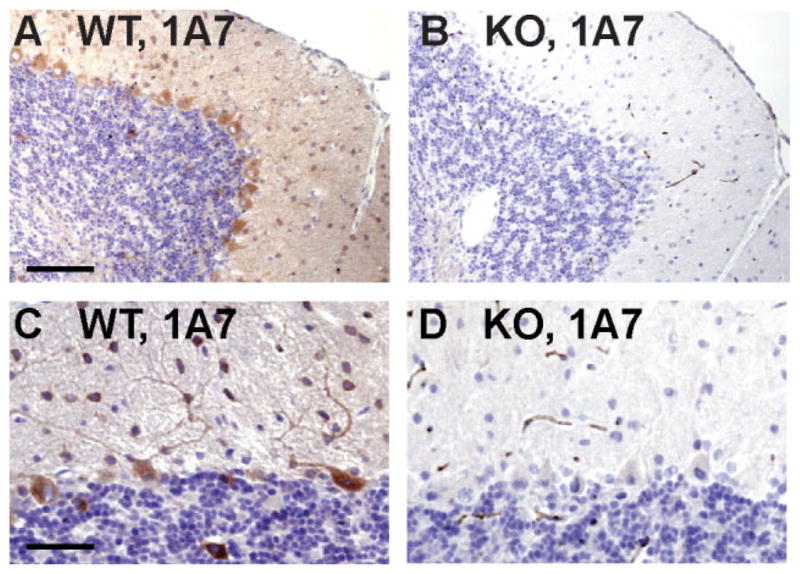
Expression of 24-hydroxylase in the cerebellum. Cryosections were prepared from female wild-type (A,C) and 24-hydroxylase knockout (B,D) mouse brains and stained with the monoclonal antibody 1A7, and immunocomplexes were visualized by DAB-HRP staining. Strong 24-hydroxylase staining was detected in Purkinje cells and their associated dendritic trees as well as in some granule cell layer interneurons, which were provisionally identified as Golgi cells (A,C). Cerebellar sections from knockout brains were devoid of 24-hydroxylase staining (B,D). Scale bars = 100 μm in A (applies to A,B); 50 μm in C (applies to C,D).
Fig. 9.

Expression of 24-hydroxylase in the cortex. Cryosections were prepared from female wild-type (WT) and 24-hydroxylase knockout (KO) mouse brains and stained with the monoclonal antibody 1A7, and immunocomplexes were visualized by DAB-HRP staining. 24-Hydroxylase was detected in the somata of cortical neurons within layers II/III, V, and VI but not in nonpyramidal neurons of layer IV or those of layer I (A). A diffuse staining of the neuropil was present in all layers of the cortex. No staining was visible in cortical sections from knockout brains (B). Scale bar = 100 μm.
The same procedures were followed to immunostain brain, retinal, and optic nerve cryosections. Slides were allowed to warm to room temperature for 30 minutes. Antigen retrieval was performed in sodium citrate buffer [10 mM sodium citrate, pH 6.0, 0.05% (v/v) Tween 20] at 90°C for 30 minutes in a water bath. The holder containing the citrate buffer and slides was allowed to cool to room temperature. The sections were then permeabilized with 0.2% (v/v) Triton X-100 (Surfact Amps X-100; 28314; Pierce Biotechnology) in PBS for 15 minutes at room temperature. The sections were blocked for at least 1 hour with NGS blocking solution as described above for immunocytochemistry. Primary antibody incubation was overnight at 4°C in a humidified chamber. Neat hybridoma culture supernatants containing 20–25 μg/ml antibody and supplemented with Triton X-100 to 0.025% were used as primary antibodies. Slides were washed three times for 10 minutes with PBS containing 0.025% Triton X-100 (PBS-T). Secondary goat anti-mouse biotin-conjugated antibody (115-065-003; Jackson Immunoresearch) was diluted 1:4,000 in NGS blocking and incubated for 1 hour at room temperature. The slides were washed three times for 10 minutes in PBS-T. Streptavidin-horseradish peroxidase conjugate (S911; Invitrogen) was diluted 1:4,000 in 0.5× NGS blocking and incubated for 20 minutes at room temperature. The slides were washed three times for 10 minutes in PBS-T. A fresh mixture (1:10) of metal-enhanced diaminobenzidine (DAB) and stable peroxide buffer (34065; Pierce Biotechnology) was prepared and incubated on the slides for 3–5 minutes.
All slides stained with the same primary antibody were incubated with the substrate for the same amount of time. The reaction was stopped by extensive washing of the slides in PBS. The slides were counterstained with hematoxylin 1 (7221; Richard-Allan Scientific, Kalamazoo, MI) according to the manufacturer’s instructions and mounted using GelMount (G0918; Sigma-Aldrich). All immunohistochemistry experiments were imaged on a Nikon E1000 brightfield microscope equipped with a Nikon DMX1200F color digital camera using ×10 Plan Apo, 0.45 NA; or ×20 Plan Apo, 0.75 NA; or ×40 Plan Fluor, 0.75 NA objectives and ACT-1 image acquisition software. Exposure times were held constant for wild-type and knockout sections in the same experiment. The images were processed in Adobe Photoshop, including cropping and adjustment of brightness and contrast of the complete image. Brightness and contrast were adjusted to the same level when comparing wild-type and knockout images. For final figure preparation, TIF files were imported into Adobe Illustrator.
RESULTS
Assessment of monoclonal antibody specificity
To facilitate detection and localization of 24-hydroxylase in cells and tissues, monoclonal antibodies that recognize the protein were generated as described in Materials and Methods. Multiple immunizations and screenings yielded three hybridomas (1A7, immunoglobulin G1; 1F4, immunoglobulin G2b; and 1F11, immunoglobulin G1) that secreted monoclonal antibodies of high titer that consistently recognized the protein as judged by ELISA. To characterize further the specificity of each antibody, a series of immunoblotting experiments was performed. In Figure 1A, total brain homogenates from wild-type and 24-hydroxylase knockout mice were resolved by SDS-PAGE, transferred to nitrocellulose filters, and incubated with hybridoma supernatants derived from the 1A7, 1F4, and 1F11 clones. A single protein with the predicted molecular weight of 24-hydroxylase (~50,000) was detected by the 1A7 and 1F11 antibodies in homogenates derived from wild-type brains but not those prepared from knockout brains. The 1F4 antibody did not detect any proteins in the brain homogenates. To ensure that equal amounts of protein were examined in these experiments, immunocomplexes formed with the monoclonal antibodies were stripped from the membranes, and the filters were reprobed with an antibody that recognized βIII-tubulin. As indicated in the bottom panels of Figure 1A, the βIII-tubulin signal was equivalent in all lanes.
The abilities of the 1A7 and 1F11 antibodies to recognize mouse and human 24-hydroxylase expressed in transfected HEK 293 cells were determined next. As shown in Figure 1B, when increasing amounts of cell lysates (2–10 μg) containing either the mouse (lanes 2–6) or human (lanes 7–11) recombinant 24-hydroxylase were resolved by SDS-PAGE, transferred to nitrocellulose membranes, and incubated with antibodies 1A7 or 1F11, a single protein with the predicted molecular weight of the enzyme was detected. In contrast, no protein was detected in lysates prepared from mock-transfected cells (lane 1). The 1A7 antibody produced a stronger signal than the 1F11 antibody for a given amount of lysate containing either the mouse or the human protein, and both antibodies produced a stronger signal against the mouse protein than the human protein. Whether these apparent differences in reactivity were due to unequal expression of the two transfected proteins or to the better recognition of epitopes on the mouse vs. the human protein by these antibodies was not determined.
To establish whether the monoclonal antibodies recognized 24-hydroxylase in other species, homogenates from mouse, rat, and rabbit brain as well as homogenates from transfected cells expressing mouse 24-hydroxylase or mock-transfected cells were subjected to SDS-PAGE and immunoblotting with 1A7 and 1F11 (Fig. 1C, upper panels). Both antibodies detected 24-hydroxylase from mouse, rat, and rabbit. The blots were stripped and reprobed with an antibody against α-tubulin to demonstrate that equal amounts of protein were present in the lanes containing transfected cell lysate or brain homogenates (Fig. 1C, lower panel).
24-Hydroxylase expression was next assessed in microsomal fractions from embryonic mouse cortex and hippocampus and in cultured cells (neurons and astrocytes; see below) derived from these tissues (Fig. 1D, upper panels). A low level of 24-hydroxylase was detected with antibodies 1A7 and 1F11 in microsomes prepared from wild-type E16 brain samples but not in those from 24-hydroxylase knockout mice. A larger amount of protein was present in primary cells from wild-type brains that had been cultured for 14 days. Equal amounts of protein were present in each pair of lanes as judged by subsequent blotting with an antibody that recognized NADPH-cytochrome P450 reductase (Fig. 1D, lower panel).
Immunocytochemical detection of 24-hydroxylase in cultured cells
Two types of experiments were performed to assess the abilities of the 1A7, 1F11, and 1F4 monoclonal antibodies to detect 24-hydroxylase within cultured cells. In the first, CHO-K1 cells were transfected with a plasmid vector encoding mouse 24-hydroxylase, and, after a period of expression (18 hours), the cells were permeabilized and stained with these antibodies and with an irrelevant monoclonal antibody (3C11) isolated during the production process (Fig. 2A–D). A reticular pattern of 24-hydroxylase staining was observed with all three specific monoclonal antibodies suggestive of an ER localization. Similar results were obtained with CHO cells expressing the human 24-hydroxylase (data not shown). No staining was detected with these antibodies in nonexpressing cells or in transfected cells incubated with the 3C11 control antibody (Fig. 2A).
To define more precisely the subcellular localization of 24-hydroxylase in transfected cells, double staining was performed with antibody 1A7 and other antisera that recognize known ER markers. To generate the data shown in Figure 2D–F, CHO-K1 cells were transfected with expression constructs encoding the mouse 24-hydroxylase and the rat NADPH-cytochrome P450 reductase and, after 18 hours of expression, fixed and subsequently incubated with 1A7 and a rabbit polyclonal antibody against the P450 reductase. Substantial colocalization between the two overexpressed proteins as indicated by a yellow color in the merged image (Fig. 2F) was observed. To determine whether expressed 24-hydroxylase colocalized with an endogenous ER protein, transfected CHO-K1 cells were stained with the 1A7 monoclonal antibody and a polyclonal antibody that recognized protein disulfide isomerase (PDI; Fig. 2G–I). The merged image in Figure 2I revealed extensive colocalization between 1A7 and endogenous PDI staining. Similar colocalization results were obtained in CHO-K1 cells after 24- and 41-hour expression periods (data not shown).
In the second type of experiment, primary cells from the cortex and hippocampus of embryonic wild-type and 24-hydroxylase knockout mice were cultured for 14 days and then subjected to immunostaining (Fig. 3). 24-Hydroxylase expression was detected in the cell bodies and processes of wild-type neurons by the 1A7, 1F4, and 1F11 antibodies (Fig. 3A,C,E). No staining was observed when the monoclonal antibodies were incubated with cells cultured from knockout embryos (Fig. 3B,D,F). Double staining of cell cultures with monoclonal antibody 1A7 and a rabbit polyclonal antibody that recognized the brain lipid binding protein (BLBP), an astrocyte marker, showed that 24-hydroxylase expression was confined to wild-type neurons and was not present in BLBP-expressing astrocytes (Fig. 3G,H). Furthermore, astrocyte proliferation and morphology in cell cultures established from the knockout mice appeared normal.
Fig. 3.
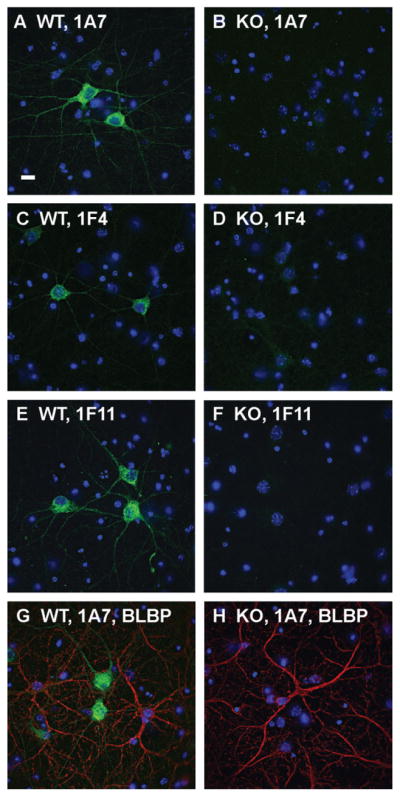
Localization of 24-hydroxylase in cultured neurons by immunofluorescence. Primary neurons prepared as described in Materials and Methods from wild-type (WT) or 24-hydroxylase knockout (KO) mouse embryos as indicated were stained with DAPI and 1A7 (A,B), or 1F4 (C,D), or 1F11 (E,F), or 1A7 and an antiserum recognizing brain lipid binding protein (BLBP), an astrocyte marker (G,H). DAPI staining appears in blue, 24-hydroxylase staining in green, and BLBP staining in red. 1A7, 1F4, and 1F11 reveal 24-hydroxylase signal in cell bodies and processes of cultured wild-type neurons. No 24-hydroxylase staining is detected in neurons from knockout mice. 1A7 staining is present in wild-type neurons but not in BLBP-positive astrocytes. The morphology of astrocytes prepared from knockout mice is indistinguishable from that of wild-type astrocytes as demonstrated by BLBP staining. Scale bar = 10 μm.
Localization of 24-hydroxylase within neuronal processes
To determine the subcellular localization of 24-hydroxylase in neuronal processes, cultured neurons from wild-type and 24-hydroxylase knockout embryos were costained with monoclonal antibody 1A7 and a rabbit polyclonal antiserum recognizing the dendritic marker MAP2 (Fig. 4A–F). When the two expression patterns from wild-type cells were merged (Fig. 4C), 24-hydroxylase fluorescence was present in MAP2-positive dendrites of the neurons. In contrast, costaining of wild-type cells for 24-hydroxylase and the presynaptic marker protein Rab3A revealed little or no colocalization in the soma or processes (Fig. 4G–I). Neurons from the knockout mice exhibited no 24-hydroxylase signal, but the staining patterns for MAP2 and Rab3A were indistinguishable from those of wild-type neurons (Fig. 4D–F,J–L). We concluded from these experiments that 24-hydroxylase was present in the dendrites of cultured neurons but undetectable in the presynaptic termini formed by these cells.
Fig. 4.

Coexpression of 24-hydroxylase with dendritic MAP2 but not presynaptic Rab3A in cultured neurons. Primary neurons prepared as described in Materials and Methods from wild-type (WT) or 24-hydroxylase knockout (KO) mouse embryos were stained with DAPI, 1A7, and a polyclonal antiserum recognizing MAP2 (A–F) or with DAPI, 1A7, and a polyclonal antiserum recognizing Rab3A (G–L). DAPI staining appears in blue, 24-hydroxylase staining in green, and MAP2 and Rab3A staining in red. The merged images from wild-type neurons show overlap between 24-hydroxylase and MAP2 signals (C) but no colocalization of 24-hydroxylase and Rab3A (I). No 24-hydroxylase staining is detected in neurons from knockout mice (D,J). Neurons from the mutant mice show normal morphology as demonstrated by MAP2 and Rab3A staining (E,K). Scale bar = 5 μm.
Immunocytochemical experiments with two axonal markers were performed in an effort to detect 24-hydroxylase expression in this type of process. A polyclonal antiserum raised against brain spectrin (Table 1) preferentially stained the initial segments of axons, but no colocalization with the 1A7 monoclonal antibody against 24-hydroxylase was detected (data not shown). Similarly, a monoclonal antibody that recognized phosphorylated neurofilaments (SMI-31; Table 1) stained entire axons, but the pattern did not overlap with that produced with the 1F4 antibody. Antisera against two other proteins (P450 reductase, calnexin) also failed to colocalize with these axonal markers. We concluded from these experiments that 24-hydroxylase either was not present in axons or was present in amounts too small to be detected by the light microscopic methods employed.
Localization of 24-hydroxylase in the dendritic ER
The photomicrographs in Figure 5 show double staining for 24-hydroxylase and P450 reductase in neurons cultured from the hippocampus and cortex of E16 wild-type and 24-hydroxylase knockout mouse brains. The merged image from the wild-type neurons (Fig. 5C) demonstrated a high degree of colocalization between the two staining patterns, especially in the cell body. Neurons from 24-hydroxylase knockout mice did not express 24-hydroxylase but did show a normal pattern of P450 reductase staining and a normal neuronal morphology (Fig. 5D–F). At the level of resolution afforded by the photomicrographs in Figure 5A–C, the 24-hydroxylase and P450 reductase proteins appeared to be colocalized in vesicle-like structures distributed throughout the cell bodies and dendrites of the cultured neurons. To explore this apparent distribution further, deconvolved z stacks of double-stained wild-type neurons were enlarged and examined by three-dimensional reconstruction. Figure 6 shows a proximal dendrite stained with 1A7 (Fig. 6A) and P450 reductase (Fig. 6B) antibodies and photographed at ×100 magnification. In these single z slices, the vesicular nature of the two staining patterns and their frequent colocalization (Fig. 6C) were still apparent, but the images revealed a faint background staining reminiscent of an interconnected reticular network. When the merged image was rendered three-dimensionally by computer-assisted assembly and presentation of the entire z stack, the contiguous nature of the subcellular membrane in which the proteins were located was revealed (Fig. 6D,E). A substantial portion of the 24-hydroxylase staining colocalized with that of P450 reductase as indicated by the white regions in the three-dimensional images. The data in Figure 6F–J from an experiment of similar design show staining for 24-hydroxylase and synaptophysin, a marker of the pre-synaptic terminal. No colocalization was observed in the merged single z slice image (Fig. 6H) or in the rendered three-dimensional images (Fig. 6I,J).
In additional experiments for which the photomicrographs are not shown, semiquantitative analyses of rendered three-dimensional images of cultured neurons using Bitplane Imaris software revealed that the staining generated with antisera recognizing four different ER markers had significant Pearson correlation coefficients (>0.5) with 24-hydroxylase staining generated with the 1A7 monoclonal antibody (Table 2). No other subcellular markers tested showed significant colocalization in the merged images or had a Pearson correlation of >0.5 (Table 2; and data not shown).
Cholesterol 24-hydroxylase is expressed in specific neurons of the central nervous system
Immunohistochemical detection of 24-hydroxylase in select subregions of the adult mouse brain was performed next. In the hippocampus, staining of sagittal sections with the 1A7 antibody revealed signal in CA1 pyramidal cell bodies as well as in interneurons of the stratum radiatum (Fig. 7A,C). At higher power, 24-hydroxylase staining was also observed in the dendrites of the pyramidal cells and those of some interneurons in the stratum radiatum (Fig. 7E,F), which confirmed the cellular distribution found in cultured neurons (Fig. 3–6). A lower level of expression was detected in the granule cell layer of the dentate gyrus, but hilar interneurons in this subregion showed strong staining. In agreement with this hippocampal staining pattern, double immunocytochemistry of wild-type cultured E16 hippocampal and cortical neurons showed strong expression of 24-hydroxylase in γ-aminobutyric acid-positive cells identified by glutamic acid decarboxylase of 67 kDa (GAD67) expression (data not shown). No staining was detected in hippocampal sections prepared from animals lacking 24-hydroxylase (Fig. 7B,D). A similar staining pattern was detected in wild-type sections using antibody 1F11, which also showed no staining in knockout sections (data not shown).
Staining of cerebellar sections with the 1A7 antibody revealed robust expression of 24-hydroxylase in the soma and dendritic trees of wild-type Purkinje cells (Fig. 8A,C). In addition, the protein was present in some large cells of the granule cell layer that were provisionally identified as Golgi neurons based on their location and morphology (Crook et al., 2006). Again, no staining was visualized in cerebellar sections from 24-hydroxylase knockout mice (Fig. 8B,D). Antibody 1F11 produced a similar cerebellar staining pattern in the wild-type sections, but no staining was observed in knockout sections (data not shown). In these and other immunohistochemical experiments, faint background staining was visible when either antibody was incubated with wild-type sections (e.g., Fig. 8A,C) but not with knockout sections (Fig. 8B,D). We believe that this staining might represent 24-hydroxylase in neuropil, because it was not detected in knockout sections.
The cortical expression pattern of 24-hydroxylase staining was determined next (Fig. 9A). In sections derived from wild-type mice, strong staining of the somata in layers II/III, V, and VI was evident, whereas little or no enzyme was present in the nonpyramidal cell bodies that make up layer IV. Diffuse staining of the neuropil was detected in all cortical layers. The specificity of the antibody was revealed by the absence of staining in cortical sections derived from 24-hydroxylase knockout mice (Fig. 9B). Similar results were obtained in wild-type and knockout cortex with antibody 1F11 (data not shown).
In the next series of immunohistochemical experiments, the expression pattern of 24-hydroxylase in the retina was determined using the 1A7 and 1F11 antibodies (Fig. 10A,C). Both antibodies exhibited similar staining patterns in wild-type sections, revealing abundant expression in neurons of the ganglion cell layer and expression in some but not all cells located along one edge of the inner nuclear layer. The 1A7 antibody detected a low level of 24-hydroxylase expression in the retinal pigmented epithelium, whereas this staining was not detected by the 1F11 antibody. No signal was present in retinal sections prepared from 24-hydroxylase knockout mice after incubation with 1A7 or 1F11 (Fig. 10B,D), nor was 24-hydroxylase staining detected in sections prepared from optic nerve (data not shown).
Fig. 10.

Expression of 24-hydroxylase in the retina. Cryosections were prepared from male wild-type (A,C) and 24-hydroxylase knockout (B,D) mouse eyes, stained with monoclonal antibodies 1A7 (A,B) or 1F11 (C,D), and immunocomplexes were visualized by DAB-HRP treatment. Strong 24-hydroxylase staining was observed with both monoclonal antibodies in retinal ganglion cells of the ganglion cell layer (GCL). A lower level of staining was detected with both antibodies in some but not all cells located at the edge of the inner nuclear layer (INL) and by the 1A7 antibody in the retinal pigmented epithelial layer (RPE). No staining was visible in other retinal layers or in retinal sections from knockout eyes. IPL, inner plexiform layer; OPL, outer plexiform layer; ONL, outer nuclear layer; RL, receptor layer. Scale bar = 50 μm.
In additional experiments not shown, the immunohistochemical staining patterns observed for 24-hydroxylase in sagittal sections of the whole brain using the 1A7 and 1F11 antibodies were identical to those for the mRNA established via in situ hybridization by the Allen Brain Atlas (http://www.brainatlas.org/aba/). For this reason, more extensive histochemical surveys were not pursued.
DISCUSSION
The present work describes the preparation of three mouse monoclonal antibodies (1A7, 1F11, 1F4) that recognize 24-hydroxylase and their use in detecting the protein in cultured cells and brain sections. The 1A7 and 1F11 antibodies interact with mouse, rat, rabbit, and human 24-hydroxylase as determined by immunoblotting, and all three antibodies detect recombinant enzyme expressed in transfected CHO-K1 cells and endogenous enzyme present in cultured mouse neurons as judged from immunostaining. Endogenous enzyme was detected immunohistochemically by antibodies 1A7 and 1F11. Within all types of expressing cells, 24-hydroxylase demonstrates a reticular staining pattern that colocalizes with a variety of subcellular markers of the ER. In the soma and dendrites of primary neurons, 24-hydroxylase is present in a contiguous membrane that extends throughout these regions of the cell. Immunohistochemical detection in brain sections shows high levels of expression in the pyramidal cells of the hippocampus, Purkinje cells of the cerebellum, and neuronal cell bodies in layers II/III, V, and VI of the cortex. Additionally, expression of 24-hydroxylase is found in hippocampal and cerebellar interneurons, in retinal ganglion cells, and in a subset of retinal cells localized to the inner nuclear layer. The enzyme is not detectable using the present procedures in cultured astrocytes or those present in brain sections.
The monoclonal antibodies against 24-hydroxylase described here have distinct properties compared with previously reported rabbit polyclonal antipeptide antibodies (Brown et al., 2004; Lund et al., 1999). One monoclonal antibody (1F4) appears to recognize a conformational epitope, whereas the other two (1A7 and 1F11) detect both the denatured and the native forms of 24-hydroxylase. These properties suggest that the monoclonal antibodies recognize at least two different epitopes on the 24-hydroxylase protein.
The generation of monoclonal antibodies against 24-hydroxylase was undertaken with two goals in mind. The first objective was to use these more selective probes to confirm and extend preliminary results obtained with a polyclonal antiserum raised against a peptide derived from the sequence of the enzyme. The polyclonal anti-serum revealed a neuronal expression pattern for 24-hydroxylase in mouse brain that was substantiated by in situ mRNA experiments (Lund et al., 1999); however, this antiserum recognizes two proteins on immunoblots, including 24-hydroxylase and a protein of molecular weight ~53,000, and 24-hydroxylase knockout mice were not available as negative controls at the time when this initial expression study was done. Furthermore, many genes that are selectively expressed in the brain shared the same expression pattern as that revealed for 24-hydroxylase by the polyclonal antibody and mRNA hybridization probes, raising the specter of false-positive results. These concerns were eliminated in the current study through the use of multiple monoclonal antibodies and 24-hydroxylase knockout mice, thus meeting the first goal.
The second reason for generating monoclonal antibodies was to define more precisely the subcellular localization of 24-hydroxylase and by doing so provide insight into the enzyme’s role in the brain. Previous subcellular fractionation experiments in this laboratory indicated that 24-hydroxylase was evenly distributed between presynaptic and postsynaptic membrane fractions (Kotti et al., 2006), suggesting that cholesterol turnover took place in both compartments. This distribution contrasted with results from electrophysiological studies in which presynaptic aspects of neural transmission (miniature synaptic currents, input–output relationships, paired-pulse facilitation ratios) were shown to be normal in hippocampal slices from 24-hydroxylase knockout mice, whereas postsynaptic aspects associated with LTP were abnormal (Kotti et al., 2006). These data suggested that reduced cholesterol turnover in the postsynaptic compartment caused the impaired LTP observed in the mutant mice.
The current immunocytochemical results clarify these findings by documenting high levels of 24-hydroxylase expression in neuronal cell bodies and dendrites, including those of hippocampal CA1 pyramidal cells in which the electrophysiological measurements were made (Fig. 7A,E). No 24-hydroxylase staining was detected in the axons of primary neurons with the present procedures (data not shown), nor was colocalization observed with presynaptic markers (Figs. 4, 6). Furthermore, 24-hydroxylase was not observed in the axon-rich white matter tracts of the brain or in the optic nerve, which is composed of retinal ganglion cell axons. We now believe that the presynaptic membranes in our earlier study were contaminated with ER based on additional experiments that demonstrated the presence of multiple ER-resident proteins in the fraction (Kotti et al., 2006; data not shown) and the extensive subcellular localization data presented here (Table 2). Furthermore, it appears that the amount of ER present in axons is lower than that present in dendrites, so this subcellular compartment is difficult to detect by light microscopy.
The ER of the neuron as visualized with the 24-hydroxylase monoclonal antibodies is a continuous network that extends throughout the soma and distal dendrites. This picture is consistent with previous ultrastructural observations of the ER in the dendrites and spines of hippocampal pyramidal cells (Spacek and Harris, 1997) and of cerebellar Purkinje neurons (Martone et al., 1993). A morphological study of the ER in these cell types using lipophilic carbocyanine dye (DiI) similarly concluded that the neuronal ER appeared continuous throughout the cell body and dendrites (Terasaki et al., 1994). As an ER resident protein that is present in both the cell body and the dendrites, 24-hydroxylase may affect synaptic activity by modulating membrane cholesterol content. The neuronal ER is postulated to serve a number of important functions related to the generation of synaptic transmission, including release of internal calcium stores. The influx of extracellular calcium through the N-methyl-D-aspartate receptor is an essential mediator of LTP onset; similarly, calcium release from internal stores via ryanodine and inositol (1,4,5)-trisphosphate (IP3) receptors is required for synaptic plasticity (Berridge, 1998; Raymond, 2007). A functional connection between the somatic and the dendritic ER is evident in cultured dopaminergic neurons in which rapid calcium transport occurs between the two compartments, suggesting that dendritic calcium stores are refilled from a somatic reservoir (Choi et al., 2006). Localized changes in membrane cholesterol content mediated by 24-hydroxylase would be expected to change the fluidity of the bilayer and thus perhaps alter calcium flux.
A second major function of the neuronal ER, as in non-neuronal cells, is the synthesis and export of proteins and lipids to the Golgi apparatus. Many secretory organelles have been visualized in dendrites by live-cell imaging, including the ER, exit sites within this organelle, and Golgi “outposts” (Horton and Ehlers, 2003, 2004). Activity-dependent trafficking of α-amino-3-hydroxy-5-methylisoxazole-4-propionic acid (AMPA)-type glutamate receptors to the postsynaptic membrane is necessary for the induction of LTP (Bredt and Nicoll, 2003). The reserve pools of receptors are thought to reside in trans-Golgi-derived recycling endosomes present in dendritic spines (Ehlers, 2000; Gerges et al., 2004, 2006; Horton and Ehlers, 2004). Cholesterol turnover mediated by 24-hydroxylase may affect the progress of AMPA receptors through the secretory pathway, thus influencing the availability of these receptors for exocytosis during an LTP-producing stimulus. Alternatively, the regulation of membrane cholesterol content by 24-hydroxylase may affect activity-dependent spine enlargement that depends on lipids delivered by endosomal exocytosis (Kopec and Malinow, 2006; Park et al., 2006).
Acknowledgments
Grant sponsor: National Institutes of Health; Grant number: HL20948; Grant number: GM08203; Grant sponsor: Perot Family Foundation.
We thank Dr. Irina Pikuleva (UT Medical Branch, Galveston, TX) for providing recombinant 24-hydroxylase protein, Daphne Head for excellent technical assistance, Dr. Kate Luby-Phelps and Abhijit Bugde for microscopic training and advice, Dr. Thomas Sudhof for antibodies, and Drs. Joel Elmquist and Jay Horton for critical reading of the manuscript. All immunofluorescence imaging was performed within the UT Southwestern Live Cell Imaging Facility.
LITERATURE CITED
- Banker G, Goslin K, editors. Culturing nerve cells. 2. Cambridge, MA: MIT Press; 2002. p. 666. [Google Scholar]
- Beltran-Parrazal L, Lopez-Valdes HE, Brennan KC, Diaz-Munoz M, Vellis Jd, Charles AC. Mitochondrial transport in processes of cortical neurons is independent of intracellular calcium. Am J Physiol Cell Physiol. 2006;291:C1193–C1197. doi: 10.1152/ajpcell.00230.2006. [DOI] [PubMed] [Google Scholar]
- Berasi SP, Huard C, Li D, Shih HH, Sun Y, Zhong W, Paulsen JE, Brown EL, Gimeno RE, Martinez RV. Inhibition of gluconeogenesis through transcriptional activation of EGR1 and DUSP4 by AMP-activated kinase. J Biol Chem. 2006;281:27167–27177. doi: 10.1074/jbc.M602416200. [DOI] [PubMed] [Google Scholar]
- Berridge MJ. Neuronal calcium signaling. Neuron. 1998;21:13–26. doi: 10.1016/s0896-6273(00)80510-3. [DOI] [PubMed] [Google Scholar]
- Bjorkhem I. Crossing the barrier: oxysterols as cholesterol transporters and metabolic modulators in the brain. J Intern Med. 2006;260:493–508. doi: 10.1111/j.1365-2796.2006.01725.x. [DOI] [PubMed] [Google Scholar]
- Bjorkhem I, Meaney S. Brain cholesterol: long secret life behind a barrier. Arterioscler Thromb Vasc Biol. 2004;24:806–815. doi: 10.1161/01.ATV.0000120374.59826.1b. [DOI] [PubMed] [Google Scholar]
- Bjorkhem I, Andersson U, Ellis E, Alvelius G, Ellegard L, Diczfalusy U, Sjovall J, Einarsson C. From brain to bile. Evidence that conjugation and ω-hydroxylation are important for elimination of 24S-hydroxycholesterol (cerebrosterol) in humans. J Biol Chem. 2001;276:37004–37010. doi: 10.1074/jbc.M103828200. [DOI] [PubMed] [Google Scholar]
- Bredt DS, Nicoll RA. AMPA receptor trafficking at excitatory synapses. Neuron. 2003;40:361–379. doi: 10.1016/s0896-6273(03)00640-8. [DOI] [PubMed] [Google Scholar]
- Brown J, 3rd, Theisler C, Silberman S, Magnuson D, Gottardi-Littell N, Lee JM, Yager D, Crowley J, Sambamurti K, Rahman MM, Reiss AB, Eckman CB, Wolozin B. Differential expression of cholesterol hydroxylases in Alzheimer’s disease. J Biol Chem. 2004;279:34674–34681. doi: 10.1074/jbc.M402324200. [DOI] [PubMed] [Google Scholar]
- Chang DT, Reynolds IJ. Differences in mitochondrial movement and morphology in young and mature primary cortical neurons in culture. Neuroscience. 2006;141:727–736. doi: 10.1016/j.neuroscience.2006.01.034. [DOI] [PubMed] [Google Scholar]
- Choi YM, Kim SH, Chung S, Uhm DY, Park MK. Regional interaction of endoplasmic reticulum Ca2+ signals between soma and dendrites through rapid luminal Ca2+ diffusion. J Neurosci. 2006;26:12127–12136. doi: 10.1523/JNEUROSCI.3158-06.2006. [DOI] [PMC free article] [PubMed] [Google Scholar]
- Colombo S, Longhi R, Alcaro S, Ortuso F, Sprocati T, Flora A, Borgese N. N-myristoylation determines dual targeting of mammalian NADH-cytochrome b5 reductase to ER and mitochondrial outer membranes by a mechanism of kinetic partitioning. J Cell Biol. 2005;168:735–745. doi: 10.1083/jcb.200407082. [DOI] [PMC free article] [PubMed] [Google Scholar]
- Crook J, Hendrickson A, Robinson FR. Co-localization of glycine and gaba immunoreactivity in interneurons in macaca monkey cerebellar cortex. Neuroscience. 2006;141:1951–1959. doi: 10.1016/j.neuroscience.2006.05.012. [DOI] [PubMed] [Google Scholar]
- Dietschy JM, Turley SD. Cholesterol metabolism in the central nervous system during early development and in the mature animal. J Lipid Res. 2004;45:1375–1397. doi: 10.1194/jlr.R400004-JLR200. [DOI] [PubMed] [Google Scholar]
- Ehlers MD. Reinsertion or degradation of AMPA receptors determined by activity-dependent endocytic sorting. Neuron. 2000;28:511–525. doi: 10.1016/s0896-6273(00)00129-x. [DOI] [PubMed] [Google Scholar]
- Feng L, Hatten ME, Heintz N. Brain lipid-binding protein (BLBP): a novel signaling system in the developing mammalian CNS. Neuron. 1994;12:895–908. doi: 10.1016/0896-6273(94)90341-7. [DOI] [PubMed] [Google Scholar]
- Fischer von Mollard G, Mignery GA, Baumert M, Perin MS, Hanson TJ, Burger PM, Jahn R, Sudhof TC. rab3 Is a small GTP-binding protein exclusively localized to synaptic vesicles. Proc Natl Acad Sci U S A. 1990;87:1988–1992. doi: 10.1073/pnas.87.5.1988. [DOI] [PMC free article] [PubMed] [Google Scholar]
- Flajollet S, Lefebvre B, Rachez C, Lefebvre P. Distinct roles of the steroid receptor coctivator 1 and MED1 in retinoid-induced transcription and cellular differentiation. J Biol Chem. 2006;281:20338–20348. doi: 10.1074/jbc.M603023200. [DOI] [PubMed] [Google Scholar]
- Fong AY, Stornetta RL, Foley CM, Potts JT. Immunohistochemical localization of GAD67-expressing neurons and processes in the rat brainstem: subregional distribution in the nucleus tractus solitarius. J Comp Neurol. 2005;493:274–290. doi: 10.1002/cne.20758. [DOI] [PubMed] [Google Scholar]
- Gerges NZ, Backos DS, Esteban JA. Local control of AMPA receptor trafficking at the postsynaptic terminal by a small GTPase of the Rab family. J Biol Chem. 2004;279:43870–43878. doi: 10.1074/jbc.M404982200. [DOI] [PubMed] [Google Scholar]
- Gerges NZ, Backos DS, Rupasinghe CN, Spaller MR, Esteban JA. Dual role of the exocyst in AMPA receptor targeting and insertion into the postsynaptic membrane. EMBO J. 2006;25:1623–1634. doi: 10.1038/sj.emboj.7601065. [DOI] [PMC free article] [PubMed] [Google Scholar]
- Goldstein ME, Sternberger LA, Sternberger NH. Microheterogeneity (“neurotypy”) of neurofilament proteins. Proc Natl Acad Sci U S A. 1983;80:3101–3105. doi: 10.1073/pnas.80.10.3101. [DOI] [PMC free article] [PubMed] [Google Scholar]
- Horton AC, Ehlers MD. Dual modes of endoplasmic reticulum-to-Golgi transport in dendrites revealed by live-cell imaging. J Neurosci. 2003;23:6188–6199. doi: 10.1523/JNEUROSCI.23-15-06188.2003. [DOI] [PMC free article] [PubMed] [Google Scholar]
- Horton AC, Ehlers MD. Secretory trafficking in neuronal dendrites. Nat Cell Biol. 2004;6:585–591. doi: 10.1038/ncb0704-585. [DOI] [PubMed] [Google Scholar]
- Ikonen E, Fiedler K, Parton RG, Simons K. Prohibitin, an antiproliferative protein, is localized to mitochondria. FEBS Lett. 1995;358:273–277. doi: 10.1016/0014-5793(94)01444-6. [DOI] [PubMed] [Google Scholar]
- Johnston PA, Jahn R, Sudhof TC. Transmembrane topography and evolutionary conservation of synaptophysin. J Biol Chem. 1989;264:1268–1273. [PubMed] [Google Scholar]
- Kopec C, Malinow R. Neuroscience. Matters of size. Science. 2006;314:1554–1555. doi: 10.1126/science.1137595. [DOI] [PubMed] [Google Scholar]
- Kosik KS, Finch EA. MAP2 and tau segregate into dendritic and axonal domains after the elaboration of morphologically distinct neurites: an immunohistochemical study of cultured rat cerebrum. J Neurosci. 1987;7:3142–3153. doi: 10.1523/JNEUROSCI.07-10-03142.1987. [DOI] [PMC free article] [PubMed] [Google Scholar]
- Kotti TJ, Ramirez DM, Pfeiffer BE, Huber KM, Russell DW. Brain cholesterol turnover required for geranylgeraniol production and learning in mice. Proc Natl Acad Sci U S A. 2006;103:3869–3874. doi: 10.1073/pnas.0600316103. [DOI] [PMC free article] [PubMed] [Google Scholar]
- Lee MK, Tuttle JB, Rebhun LI, Cleveland DW, Frankfurter A. The expression and posttranslational modification of a neuron-specific beta-tubulin isotype during chick embryogenesis. Cell Motil Cytoskeleton. 1990;17:118–132. doi: 10.1002/cm.970170207. [DOI] [PubMed] [Google Scholar]
- Li-Hawkins J, Lund EG, Bronson AD, Russell DW. Expression cloning of an oxysterol 7α-hydroxylase selective for 24-hydroxycholesterol. J Biol Chem. 2000;275:16543–16549. doi: 10.1074/jbc.M001810200. [DOI] [PubMed] [Google Scholar]
- Longart M, Liu Y, Karavanova I, Buonanno A. Neuregulin-2 is developmentally regulated and targeted to dendrites of central neurons. J Comp Neurol. 2004;472:156–172. doi: 10.1002/cne.20016. [DOI] [PubMed] [Google Scholar]
- Lund EG, Guileyardo JM, Russell DW. cDNA cloning of cholesterol 24-hydroxylase, a regulator of cholesterol homeostasis in the brain. Proc Natl Acad Sci U S A. 1999;96:7238–7243. doi: 10.1073/pnas.96.13.7238. [DOI] [PMC free article] [PubMed] [Google Scholar]
- Lund EG, Xie C, Kotti T, Turley SD, Dietschy JM, Russell DW. Knockout of the cholesterol 24-hydroxylase gene in mice reveals a brain-specific mechanism of cholesterol turnover. J Biol Chem. 2003;278:22980–22988. doi: 10.1074/jbc.M303415200. [DOI] [PubMed] [Google Scholar]
- Martone ME, Zhang Y, Simpliciano VM, Carragher BO, Ellisman MH. Three-dimensional visualization of the smooth endoplasmic reticulum in Purkinje cell dendrites. J Neurosci. 1993;13:4636–4646. doi: 10.1523/JNEUROSCI.13-11-04636.1993. [DOI] [PMC free article] [PubMed] [Google Scholar]
- Mast N, Norcross R, Andersson U, Shou M, Nakayama K, Bjorkhem I, Pikuleva IA. Broad substrate specificity of human cytochrome P450 46A1 which initiates cholesterol degradation in the brain. Biochemistry. 2003;42:14284–14292. doi: 10.1021/bi035512f. [DOI] [PubMed] [Google Scholar]
- Mezgrahani A, Courageot J, Mani JC, Pugniere M, Bastiani P, Miquelis R. Protein-disulfide isomerase (PDI) in FRTL5 cells. pH-dependent thyroglobulin/PDI interactions determine a novel PDI function in the post-endoplasmic reticulum of thyrocytes. J Biol Chem. 2000;275:1920–1929. doi: 10.1074/jbc.275.3.1920. [DOI] [PubMed] [Google Scholar]
- Park M, Salgado JM, Ostroff L, Helton TD, Robinson CG, Harris KM, Ehlers MD. Plasticity-induced growth of dendritic spines by exocytic trafficking from recycling endosomes. Neuron. 2006;52:817–830. doi: 10.1016/j.neuron.2006.09.040. [DOI] [PMC free article] [PubMed] [Google Scholar]
- Quan G, Xie C, Dietschy JM, Turley SD. Ontogenesis and regulation of cholesterol metabolism in the central nervous system of the mouse. Brain Res Dev Brain Res. 2003;146:87–98. doi: 10.1016/j.devbrainres.2003.09.015. [DOI] [PubMed] [Google Scholar]
- Raymond CR. LTP forms 1, 2 and 3: different mechanisms for the ‘long’ in long-term potentiation. Trends Neurosci. 2007;30:167–175. doi: 10.1016/j.tins.2007.01.007. [DOI] [PubMed] [Google Scholar]
- Riederer BM, Zagon IS, Goodman SR. Brain spectrin (240/235) and brain spectrin (240/235E): two distinct spectrin subtypes with different locations within mammalian neural cells. J Cell Biol. 1986;102:2088–2097. doi: 10.1083/jcb.102.6.2088. [DOI] [PMC free article] [PubMed] [Google Scholar]
- Rosahl TW, Geppert M, Spillane D, Herz J, Hammer RE, Malenka RC, Sudhof TC. Short-term synaptic plasticity is altered in mice lacking synapsin I. Cell. 1993;75:661–670. doi: 10.1016/0092-8674(93)90487-b. [DOI] [PubMed] [Google Scholar]
- Rousselot P, Heintz N, Nottebohm F. Expression of brain lipid binding protein in the brain of the adult canary and its implications for adult neurogenesis. J Comp Neurol. 1997;385:415–426. [PubMed] [Google Scholar]
- Sannerud R, Marie M, Nizak C, Dale HA, Pernet-Gallay K, Perez F, Goud B, Saraste J. Rab1 defines a novel pathway connecting the pre-Golgi intermediate compartment to the cell periphery. Mol Biol Cell. 2006;17:1514–1526. doi: 10.1091/mbc.E05-08-0792. [DOI] [PMC free article] [PubMed] [Google Scholar]
- Spacek J, Harris KM. Three-dimensional organization of smooth endoplasmic reticulum in hippocampal CA1 dendrites and dendritic spines of the immature and mature rat. J Neurosci. 1997;17:190–203. doi: 10.1523/JNEUROSCI.17-01-00190.1997. [DOI] [PMC free article] [PubMed] [Google Scholar]
- Sternberger LA, Sternberger NH. Monoclonal antibodies distinguish phosphorylated and nonphosphorylated forms of neurofilaments in situ. Proc Natl Acad Sci U S A. 1983;80:6126–6130. doi: 10.1073/pnas.80.19.6126. [DOI] [PMC free article] [PubMed] [Google Scholar]
- Sweatt JD. Mechanisms of memory. Amsterdam: Elsevier Academic Press; 2003. p. 400. [Google Scholar]
- Terasaki M, Slater NT, Fein A, Schmidek A, Reese TS. Continuous network of endoplasmic reticulum in cerebellar Purkinje neurons. Proc Natl Acad Sci U S A. 1994;91:7510–7514. doi: 10.1073/pnas.91.16.7510. [DOI] [PMC free article] [PubMed] [Google Scholar]
- Whitlock JR, Heynen AJ, Shuler MG, Bear MF. Learning induces long-term potentiation in the hippocampus. Science. 2006;313:1093–1097. doi: 10.1126/science.1128134. [DOI] [PubMed] [Google Scholar]
- Zhu H, Larade K, Jackson TA, Xie J, Ladoux A, Acker H, Berchner-Pfannschmidt U, Fandrey J, Cross AR, Lukat-Rodgers GS, Rodgers KR, Bunn HF. NCB5OR is a novel soluble NAD(P)H reductase localized in the endoplasmic reticulum. J Biol Chem. 2004;279:30316–30325. doi: 10.1074/jbc.M402664200. [DOI] [PMC free article] [PubMed] [Google Scholar]