

Abstract
Background
Several prognostic models have emerged in alcoholic hepatitis (AH), but lack of external validation precludes their universal use.
Aim
To validate the Maddrey Discriminant Function (DF); Glasgow Alcoholic Hepatitis Score (GAHS); Mayo End-stage Liver Disease (MELD); Age, Bilirubin, INR, Creatinine (ABIC); MELD-Na, UK End-stage Liver Disease (UKELD), and three scores of corticosteroid response at 1 week: an Early Change in Bilirubin Levels (ECBL), a 25% fall in bilirubin, and the Lille score.
Methods
Seventy-one consecutive patients with biopsy-proven AH, admitted between November 2007-September 2011, were evaluated. The clinical and biochemical parameters were analysed to assess prognostic models with respect to 30- and 90-day mortality.
Results
There were no significant differences in the areas under the receiver operating characteristics curve (AUROCs) relative to 30-day/90-day mortality: MELD 0.79/0.84, DF 0.71/0.74, GAHS 0.75/0.78, ABIC 0.71/0.78, MELD-Na 0.68/0.76, UKELD 0.56/0.68. One-week rescoring yielded a trend towards improved predictive accuracies (30-day/90-day AUROCs: 0.69–0.84/0.77–0.86). In patients with admission DF ≥32 (n = 31), response to corticosteroids according to ECBL, 25% fall in bilirubin and the Lille model yielded AUROCs of 0.73/0.73, 0.78/0.72 and 0.81/0.82 for a 30-day/90-day outcome respectively. All models showed excellent negative predictive values (NPVs; range: 86–100%), while the positive ones were low (range: 17–50%).
Conclusions
MELD, DF, GAHS, ABIC and scores of corticosteroid response proved to be valid in an independent cohort of biopsy-proven alcoholic hepatitis. MELD modifications incorporating sodium did not confer any prognostic advantage over classical MELD. Based on excellent NPVs, the models are best to identify patients at low risk of death.
Introduction
Alcoholic hepatitis (AH) is an acute inflammatory hepatic syndrome occurring in patients with alcohol misuse.1 However, the clinical phenotype of AH is very variable. There are mild forms, likely to improve with conservative management, while severe cases have a high risk of death even if treated.2 Currently, corticosteroids, pentoxifylline and N-acetylcysteine are the therapeutic options,3–6 although treatment of AH remains controversial.7 A survival benefit conferred by steroids is indeed disputed in standard meta-analysis,8,9 but supported in individual patient data analysis.10 An ongoing, adequately powered, UK randomised controlled trial will probably answer such therapeutic controversies.11 Due to the potential adverse events associated with corticosteroids (mainly occurrence of sepsis), AH is currently managed on a risk-benefit basis. Thus, prognostic stratification according to short-term mortality is paramount both for disease management and to enable clinical trials targeting new treatments in AH.
For over 3 decades, the Maddrey discriminant function (DF)12 has been the standard surrogate for the assessment of disease severity and to guide treatment in AH. A cut-off value of ≥32 identified patients who had greater than 50% mortality at 30 days and therefore this was instituted as the threshold for corticosteroid therapy. Over the years, alternative prognostic scores have been developed: the Glasgow alcoholic hepatitis score (GAHS)13 and the age, bilirubin, international normalised ratio, creatinine score (ABIC).14 Alongside these disease-specific formulas, previous studies (including 34,15 7316 and 20217 patients) have outlined the utility of the model for end-stage liver disease (MELD) for predicting mortality in AH, whereas the utility of the MELD including sodium (MELD-Na) has been also assessed in a small study.18 A further refinement has been to assess the response to corticosteroid treatment. In this context, the Lille score19 with a threshold of 0.45 has been developed to identify patients with severe AH who might benefit from corticosteroids, whereas also use of GAHS with a threshold of 9 has been proposed.20 Previously, any fall in serum bilirubin levels after 1 week of corticosteroid therapy (Early Change in Bilirubin Levels: ECBL),21 or more specifically a 25% fall,22 have been proposed as simple indicators of corticosteroid response.
In recent years, several prognostic models have become available in AH, all of them advocated as best by their respective authors. External validation and model comparisons are therefore required to guide selection among the models for use in routine clinical practice. However, diagnosis of AH is challenging and patients with other forms of hepatic decompensation (such as decompensated cirrhosis with severe jaundice and acute alcoholic steatosis) may be erroneously classified as AH. This is more likely to happen when liver biopsy is not performed, including a transjugular approach which can obviate clotting problems.23 Indeed, diagnosis of AH based on clinical grounds has been associated with a 10–50% risk of misclassification.24–26 Thus, in the present study, we aimed to cross-validate nine prognostic indices for short-term mortality using an independent cohort of patients with AH confirmed by transjugular liver biopsy. This is standard practice in our centre whenever AH is suspected.
Patients and methods
Study population
Consecutive patients with a histological diagnosis of AH by liver biopsy, between November 2007 and September 2011, were identified through a computerised pathology register. All patients were referred for transjugular liver biopsy by their treating physician (who was a hepatologist in all cases) due to the clinical suspicion of AH. The patients' clinical and biochemical features on admission were compatible with a diagnosis of AH, according to the following criteria: a) history of alcohol abuse within the last 2 months (>40 g/day compatible with or men; >20 g/day for women), b) total serum bilirubin exceeding 2× upper limit of normality (ULN = 17 μmol/L), c) aspartate to alanine aminotransferase ratio exceeding 1.5 with aspartate aminotransferase over 45 U/L and c) absence of concomitant primary cause of liver disease. Patients with pre-existing viral hepatitis (n = 9) were not excluded because the clinical basis of their hospital admission was due to AH. Demographical and laboratory data were extracted by reviewing the electronic medical charts. Survival at 30- and 90-days following hospital admission was established by chart review or phone contact, if necessary. Therapy for AH was also assessed. According to local protocol, patients with a severe AH (DF ≥32) were given a single daily dose of oral prednisolone 40 mg for 28 days, in addition to supportive therapy including gastric acid suppressors, high dose vitamin B and C, vitamin K, dietary supplements often by enteral feeding, and chlordiazepoxide if there were alcohol withdrawal symptoms. In those unable to take oral medication, 32 mg/day of methylprednisolone were administered intravenously. Patients placed on steroids, presence of contraindications to steroid treatment and the exact date of initiation of steroid therapy were all recorded by retrospectively reviewing medical charts.
Derivation of prognostic models
For each patient, laboratory values obtained on the day of hospital admission were used to calculate prognostic models according to their formulas (Table 1). MELD,27 MELD-Na,28 UKELD,29 GAHS,13 ABIC14 and DF12 were all re-calculated using laboratory data from day 7 after admission to establish whether 1-week rescoring could be associated with an improved predictive performance, as outlined previously.13,17,30,31 The Lille score is a combination of six reproducible variables incorporating a dynamic one (i.e. the 1-week evolution in bilirubin).19 This model, as well as ECBL21 and a 25% fall in bilirubin levels,22 do not have the same prognostic basis and so cannot be compared to other models, as they were specifically developed for the assessment of corticosteroid response. Thus, these three scores were validated separately in a subgroup of patients with severe AH (admission DF ≥32) treated with corticosteroids, using clinical and biochemical parameters obtained on the day before treatment start and the evolution in bilirubin at day 7 of treatment with steroids.
Table 1.
Formulas and included variables in prognostic models for alcoholic hepatitis
| Bilirubin | Creatinine | PT/INR | Age | Albumin | Urea | Leucocytes | Na | Δ Bilirubin | |
|---|---|---|---|---|---|---|---|---|---|
| MELD27 | |||||||||
| 9.57 × loge (creatinine, mg/dL) + 3.78 × loge (bilirubin mg/dL) + 11.20 × loge (INR) + 6.43 | + | + | + | − | − | − | − | − | − |
| DF12 | |||||||||
| 4.6 × (patient's PT − control PT) + bilirubin (mg/dL) | + | + | + | − | − | − | − | − | − |
| *GAHS13 | |||||||||
| Age (<50 years = 1, ≥50 years = 2) + Leucocytes (109/L) (<15 = 1, ≥15 = 2) + Urea (mmol/L) (<5 = 1, ≥5 = 2) + PT ratio (<1.5 = 1, 1.5–2.0 = 2, >2.0 = 3) + bilirubin (mmol/L) (<125 = 1, 125–50 = 2, <250 = 3) | + | − | + | + | − | + | + | − | − |
| ABIC14 | |||||||||
| (Age in years × 0.1) + (bilirubin mg/dL × 0.08) + (creatinine mg/dL × 0.3) + (INR × 0.8) | + | + | + | + | − | − | − | − | − |
| MELD-Na28 | |||||||||
| MELD – Na − [0.025 × MELD × (140 − Na)] + 140 (where the serum sodium concentration is bound between 125 and 140 mmol per litre) | + | + | + | − | − | − | − | + | − |
| UKELD29 | |||||||||
| 5 × [1.5 × loge (INR) + 0.3 × loge (creatinine mmol/L) + 0.6 × loge (bilirubin mmol/L) − 13 × loge (Na) + 70] | + | + | + | − | − | − | − | + | − |
| Lille19 | |||||||||
| R-Lille model = 3.19 − 0.101 × (age in years) + 0.147 × (albumin day 0 in g/L) + 0.0165 × (bilirubin-day 0 –bilirubin-day 7 (mmol/L)) − 0.206 × (renal insufficiency^) − 0.0065 × (bilirubin-day 0 mmol/l) − 0.0096 × (PT in seconds); Lille model = exp (−R)/(1 + exp (−R)) | + | + | + | + | + | − | − | − | + |
PT, prothrombin time; INR, international normalised ratio; MELD, model for end-stage liver disease; DF, Maddrey's discriminant function; GAHS, Glascow alcoholic hepatitis score; ABIC, age, bilirubin, international normalised ratio and creatinine score; MELD-Na, modified MELD including sodium; UKELD, United Kingdom model for end-stage liver disease.
Rather than a formula, GAHS is based on a scoring system.
Statistical analyses
Baseline characteristics of the study population were compared by using Chi-squared test for categorical data and Student t-test or Mann–Whitney U test for continuous data, as appropriate. Occurrence of death due to any cause within 30 or 90 days from the hospital admission was the study endpoint. Mortality rates were calculated as the proportion of patients that died within these time intervals. In patients with severe AH (admission DF ≥32), a Cox proportional hazards model was evaluated to assess the crude and adjusted effect of corticosteroid therapy with respect to either 30- and 90-day mortality. The utility of each model to predict 30- or 90-day mortality was evaluated using receiver operating characteristics (ROC) curves, and the area under the receiver operating characteristics curves (AUROCs) was calculated. In this analysis, a model with an AUROC between 0.7 and 0.8 was considered clinically useful and between 0.8 and 0.9 as having very good diagnostic accuracy. If the AUROC approaches 1.0, the model approaches 100% sensitivity and specificity, indicating a perfect diagnostic test.32 Sensitivity, specificity, positive predictive value (PPV) and negative predictive value (NPV) of the models were calculated using originally published cut-offs: 32 for DF, 9 for GAHS, 21 for MELD, 28 for MELD-Na, 6.71 and 9 for the ABIC and 0.45 for the Lille score.12,14,16,18–20 As no disease-specific calibration has been reported for UKELD, we calculated optimised predictive performances using the best cut-off within our cohort (point nearest to the top left corner of the ROC curve, yielding the best relationship between sensitivity and specificity). Comparison between AUROCs was performed by the method of Hanley and McNeil32 and the P-values obtained were considered indicative of nonsimilarity if below 0.05. All analyses were performed using the spss version 22 (SPSS, IBM, Chicago, IL, USA) except for the comparisons between AUROCs which were performed using MedCalc version 12.2.0 (Medisoftware, Mariakerke, Belgium).
Results
Study cohort, biochemical data and scores of the different predictive models
Seventy-one consecutive patients with a biopsy-proven diagnosis of AH who met the inclusion criteria, comprised the study population. The baseline clinical data and prognostic score values are shown in Table 2. There were 47 males and 24 females with a median age of 49 years. Median admission MELD and DF were 18.8 and 47.5 respectively. The median interval between admission and the date of liver biopsy was 1.5 days (range: 0–6 days). This time interval was comparable between survivors and patients who died either within 30 days (P = 0.28) and 90 days (P = 0.76) from hospital admission. Overall, the 30-day mortality was 14.1% (10/71), whereas the 90-day mortality was 19.7% (14/71). The differences between survivors and nonsurvivors at 30 and 90 days from admission are shown in Table 2. With respect to 30-day mortality, patients who died had a higher admission median bilirubin, urea, creatinine, prothrombin time and INR, higher prognostic score values, lower albumin and were more frequently females as compared to patients who survived (Table 2a). Similar differences were detected with respect to 90-day mortality (except there were no significant gender differences and there was a trend for higher admission leucocyte count in those who died), and when comparisons were repeated by taking into account the 1-week biochemical values and scores (Table 2b). Considering the subgroup of patients with severe AH (admission DF ≥32; n = 49), patients who died at 30 days (n = 10) had a lower median albumin (26 vs. 30 g/L; P = 0.04) and were marginally more frequently of female gender (6/10 vs. 11/39; P = 0.07). With respect to 90-day mortality, patients with a severe AH who died (n = 14) had a lower admission median albumin (27 vs. 30 g/L; P = 0.05) and a higher median creatinine (74.5 vs. 53 mmol/L; P = 0.05) as compared to those who survived, whereas no other differences were detected between the two groups considering all 30-/90-day variables included in Table 2 (data not shown).
Table 2.
Comparison of admission and 1 week variables and scores between patients who survived at 30- and 90-days and those who died. All quantitative variables are given as medians (range)
| Variable | Total cohort (n = 71) | 30-day survivors (n = 61) | 30-day nonsurvivors (n = 10) | P-value | 90-day survivors (n = 57) | 90-day nonsurvivors (n = 14) | P-value |
|---|---|---|---|---|---|---|---|
| a, Admission | |||||||
| Age (years) | 49 (26–75) | 49 (26–75) | 50 (30–57) | 0.69 | 49 (26–72) | 50 (30–75) | 0.79 |
| Male Gender n (%) | 47 (66.2) | 43 (70.5) | 4 (40) | 0.08 | 39 (68.4) | 8 (57.1) | 0.53 |
| Bilirubin (μmol/L) | 212 (44–827) | 187 (44–827) | 241 (144–711) | 0.09 | 178 (44–827) | 356 (144–711) | 0.006 |
| Albumin (g/L) | 30 (19–42) | 32 (19–42) | 26 (20–34) | 0.006 | 32 (19–42) | 27 (20–34) | 0.005 |
| Creatinine (μmol/L) | 57 (31–292) | 54 (31–240) | 74.5 (31–292) | 0.02 | 53 (31–240) | 74.5 (31–292) | 0.03 |
| Urea (mmol/L) | 3.5 (0.8–17.3) | 3.4 (0.8–17.3) | 6.7 (2.8–15) | 0.04 | 3.4 (0.8–12.8) | 5.4 (2.3–17.3) | 0.08 |
| Sodium (mmol/L) | 133 (121–155) | 136 (131–155) | 133 (121–144) | 0.09 | 134 (121–155) | 133 (121–144) | 0.72 |
| Prothrombin time (s) | 22.2 (12.2–45.4) | 21.8 (12.2–45.4) | 26.1 (16.1–39.6) | 0.03 | 21.7 (12.2–45.4) | 24.5 (16.1–39.6) | 0.02 |
| INR | 1.8 (0.9–4) | 1.7 (0.9–4) | 2.2 (1.3–3.2) | 0.02 | 1.7 (0.9–4) | 2.2 (1.3–3.2) | 0.009 |
| Leucocytes (109/L) | 11.2 (2.8–34.7) | 11.2 (2.8–25.2) | 11.8 (9.2–34.7) | 0.21 | 11.2 (2.8–25.2) | 11.8 (9.2–34.7) | 0.08 |
| DF | 47.5 (2.2–157.7) | 42.3 (2.2 157.7) | 57.4 (34–150.1) | 0.04 | 40.1 (2.2–157.7) | 58.3 (34–150.1) | 0.007 |
| GAHS | 8 (5–12) | 8 (5–12) | 10 (7–12) | 0.009 | 8 (5–12) | 10 (7–12) | 0.001 |
| ABIC score | 7.8 (4.4–12.1) | 7.6 (4.4–11.6) | 9.4 (6.9–12.1) | 0.03 | 7.5 (4.4–11.6) | 9.5 (6.9–12.1) | 0.001 |
| MELD score | 18.8 (7.9–40.3) | 18.7 (7.9–36.9) | 25.6 (15.4–40.3) | 0.004 | 18.2 (7.9–36.9) | 25.4 (15.4–40.3) | 0.0001 |
| MELD-Na score | 21.2 (6.3–40.2) | 20.3 (6.3–38.2) | 23.6 (15.4–40.2) | 0.08 | 20.2 (6.3–38.2) | 26.4 (15.4–40.2) | 0.003 |
| UKELD score | 57.7 (48.7–72.8) | 57.7 (48.7–72.8) | 57.5 (52.7–69.2) | 0.52 | 56.8 (48.7–72.8) | 59.6 (52.7–69.2) | 0.04 |
| (n = 63) | (n = 56) | (n = 7) | (n = 52) | (n = 11) | |||
| b, Day 7 from admission | |||||||
| Bilirubin (μmol/L) | 146 (25–647) | 128 (25–647) | 214 (165–568) | 0.01 | 120.5 (25–647) | 420 (165–568) | 0.0001 |
| Creatinine (μmol/L) | 55 (26–343) | 54 (26–101) | 154 (36–343) | 0.02 | 54 (26–101) | 95 (36–343) | 0.007 |
| Urea (mmol/L) | 4.1 (1.6–22.3) | 4.1 (1.6–20.8) | 9 (2.8–22.3) | 0.04 | 4.1 (1.6–20.8) | 8.9 (2.8–22.3) | 0.07 |
| Sodium (mmol/L) | 136 (111–161) | 137 (125–161) | 136 (111–149) | 0.51 | 136.5 (111–149) | 133 (125–161) | 0.25 |
| Prothrombin time (s) | 20 (1.5–55.5) | 19.8 (16–35.1) | 23.9 (17.1–55.5) | 0.009 | 19.8 (16–35.1) | 23.2 (17.1–55.5) | 0.02 |
| INR | 1.6 (0.9–16) | 1.6 (0.9–3.1) | 2.1 (1.4–4.8) | 0.004 | 1.6 (0.9–3.1) | 1.9 (1.4–4.8) | 0.01 |
| Leucocytes (109/L) | 11 (3.6–34.1) | 10.9 (3.6–34.1) | 11.8 (5–31.1) | 0.66 | 10.9 (3.6–34.1) | 11.9 (5–31.1) | 0.46 |
| DF | 28.2 (1.46–194.2) | 27.6 (1.5–125.7) | 50.9 (34.4–194.2) | 0.002 | 27.2 (1.5125.7) | 48.6 (34.4–194.2) | 0.001 |
| GAHS | 8 (5–12) | 7 (5–12) | 9.5 (8–11) | 0.01 | 7 (5–12) | 9 (8–11) | 0.003 |
| ABIC score | 7.2 (4.1–17.4) | 7.1 (4.1–17.4) | 8.3 (6.9–11) | 0.04 | 7 (4.1–17.4) | 7.9 (6.9–11) | 0.02 |
| MELD score | 15.7 (1.38–46.5) | 15.1 (1.4–34.1) | 28.7 (13.9–46.5) | 0.002 | 14.6 (1.4–34.1) | 25.6 (13.9–46.5) | 0.0001 |
| MELD-Na score | 18.5 (−7.3–44.1) | 18.4 (−7.3–34.4) | 27.8 (14.8–44.1) | 0.01 | 17.9 (−7.3–34.4) | 25.6 (14.8–44.1) | 0.001 |
| UKELD score | 55.5 (43.2–72.8) | 55.4 (43.2–68.3) | 60.6 (48.4–72.8) | 0.08 | 55 (43.2–68.3) | 61.7 (48.4–72.8) | 0.006 |
INR, international normalised ratio; DF, Maddrey discriminant function; GAHS, Glascow alcoholic hepatitis score; ABIC, age, bilirubin, INR, creatinine score; MELD, model for end-stage liver disease; MELD-Na, modified MELD including sodium; UKELD, United Kingdom model for end-stage liver disease.
Data on corticosteroid treatment
Overall, 49 (69%) patients had a DF ≥32 at presentation and 34 (69.4%) were treated with corticosteroids, whereas no patient received pentoxyfilline or other specific treatment for AH. Contraindications for corticosteroid treatment included variceal bleeding in 3 patients and infection in 5 patients, including 2 patients with spontaneous bacterial peritonitis (diagnosed by a neutrophil count ≥250 cc/mm3 in the ascitic fluid), whereas another two patients refused corticosteroid treatment. In five patients, the decision for not treating with corticosteroids was based on the clinical judgment of the treating physician, despite no obvious treatment contraindications. Mean time between admission to Royal Free Hospital and start of corticosteroid treatment was 2.44 ± 1.88 days (range: 0–8 days). That time interval was comparable between patients who survived at 30 (2.64 ± 1.98) and 90 days (2.61 ± 1.88) and those who did not (1.5 ± 0.84; P = 0.19 and 1.87 ± 1.88; P = 0.21, respectively). Considering 49 patients with an admission DF ≥32 (i.e. those expected to benefit from corticosteroids22), the 30-day survival rate was 28/34 (82.4%) in steroid-treated patients vs. 11/15 (73.3%) in nontreated (P = 0.47). At 90 days, the survival rate was 26/34 (76.5%) in patients receiving corticosteroids vs. 9/15 (60%) in nontreated (P = 0.31). In patients with a severe AH (admission DF ≥32), the crude hazard ratio (HR) for corticosteroid treatment was 0.57 [95% confidence interval (CI): 0.16–2.05; P = 0.40) with respect to 30-day mortality and 0.55 (95% CI: 0.19–1.58; P = 0.27) with respect to 90-day mortality. Lack of a significant corticosteroid effect on mortality persisted after adjustment for admission variables differing (P < 0.1) between survivors and nonsurvivors (i.e. gender and bilirubin with respect to 30-day mortality; creatinine and albumin for 90-day mortality), yielding for 30-day mortality: HR = 0.69 (95% CI: 0.19–2.50; P = 0.57) and for 90-day mortality: HR = 0.56 (95% CI: 0.18–1.71; P = 0.31).
Use of the MELD, DF, GAHS, ABIC, MELD-Na and UKELD for the assessment of 30- and 90-day mortality
The ROC curves of the models with respect to 30-day and 90-day mortality are shown in Figure 1. The AUROCs for the prediction of 30-day mortality ranged from 0.56 for UKELD to 0.79 for MELD and for the prediction of 90-day mortality between 0.68 (UKELD) and 0.84 for MELD (Table 3A). No significant differences were found in pairwise comparisons between the AUROCs of the different models (data not shown). Re-calculation of the scores at day 7 from admission was possible for 63 patients; three patients died before day seven, and five patients (all of whom survived) did not have all the required biochemical data available at this time point. Re-scoring on day 7 generally yielded a trend towards increased AUROCs, ranging to 0.69–0.85 for 30-day and 0.75–0.86 for 90-day mortality (Table 3B). However, none of the differences reached statistical significance, and there were no statistically significant differences in the pairwise comparisons between models (data not shown). Figure S1 shows scatter plots of admission score values related to 30- and 90-day mortality, including representation of both originally published and optimal cut-off points within our cohort. The later were 44 for DF, 28 for MELD-Na and 56 for UKELD. A high ABIC cut-off of 9.5 resulted in increased specificity as compared to the originally suggested value of 9 (90% vs. 80% and 95% vs. 84% for a 30- and 90-day outcome respectively). Previously suggested MELD (21), GAHS (9) and low ABIC (6.7) cut-off points performed optimally within our cohort.13,14,16 Using originally proposed cut-points, the negative predictive values (NPV) for ruling out short-term mortality were high (mostly exceeding 90%), whereas ability of the models to correctly predict occurrence of death (positive predictive value; PPV) was substantially lower, in most cases less than 50% (range: 17–57%) (Table 3a). These properties remained largely unchanged when the predictive performances of the models were re-assessed 1 week from admission (NPV: 0.85–1.00, PPV: 0.20–0.57; Table 3b).
Figure 1.
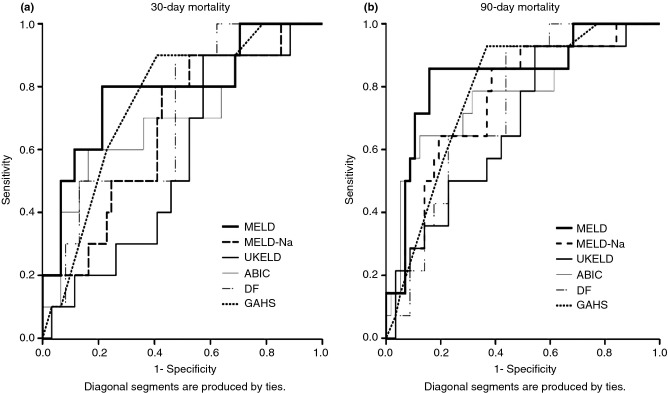
Receiver operating characteristic curve of the different prognostic scores for alcoholic hepatitis calculated on admission, used to predict 30-day (a) and 90-day (b) mortality.
Table 3.
The AUROC and optimal operational characteristics in predicting 30- and 90-day mortality for the different prognostic scores calculated on the day of admission (a) and re-calculated after 7 days (b)
| Score | AUROC | Std. err | 95% CI | Sensitivity* | Specificity* | PPV* | NPV* |
|---|---|---|---|---|---|---|---|
| a, Admission (n = 71) | |||||||
| 30-day mortality | |||||||
| MELD | 0.79 | 0.085 | 0.62–0.95 | 0.80 | 0.79 | 0.38 | 0.96 |
| DF | 0.71 | 0.092 | 0.53–0.89 | 1.00 | 0.36 | 0.20 | 1.00 |
| GAHS | 0.75 | 0.073 | 0.61–0.89 | 0.90 | 0.59 | 0.27 | 0.94 |
| ABIC | 0.71 | 0.079 | 0.55–0.86 | 1.00/0.60 | 0.20/0.80 | 0.17/0.33 | 1.00/0.92 |
| MELD-Na | 0.68 | 0.087 | 0.50–0.84 | 0.30 | 0.82 | 0.22 | 0.88 |
| UKELD | 0.56 | 0.087 | 0.39–0.73 | 0.90 | 0.43 | 0.21 | 0.96 |
| 90-day mortality | |||||||
| MELD | 0.84 | 0.064 | 0.71–0.96 | 0.86 | 0.84 | 0.57 | 0.96 |
| DF | 0.74 | 0.062 | 0.61–0.86 | 1.00 | 0.39 | 0.29 | 1.00 |
| GAHS | 0.78 | 0.060 | 0.67–0.90 | 0.93 | 0.63 | 0.38 | 0.97 |
| ABIC | 0.78 | 0.072 | 0.64–0.92 | 1.00/0.64 | 0.21/0.84 | 0.24/0.50 | 1.00/0.91 |
| MELD-Na | 0.76 | 0.069 | 0.62–0.89 | 0.43 | 0.86 | 0.43 | 0.86 |
| UKELD | 0.68 | 0.076 | 0.53–0.83 | 0.93 | 0.46 | 0.30 | 0.96 |
| b, Day 7 from admission (n = 63) | |||||||
| 30-day mortality | |||||||
| MELD | 0.84 | 0.084 | 0.68–1.00 | 0.60 | 0.87 | 0.43 | 0.93 |
| DF | 0.85 | 0.058 | 0.74–0.96 | 1.00 | 0.48 | 0.24 | 1.00 |
| GAHS | 0.77 | 0.070 | 0.63–0.91 | 0.60 | 0.70 | 0.25 | 0.91 |
| ABIC | 0.74 | 0.092 | 0.54–0.90 | 0.80/0.30 | 0.46/0.93 | 0.20/0.43 | 0.94/0.89 |
| MELD-Na | 0.78 | 0.090 | 0.61–0.96 | 0.40 | 0.93 | 0.40 | 0.92 |
| UKELD | 0.69 | 0.106 | 0.48–0.89 | 0.50 | 0.69 | 0.21 | 0.89 |
| 90-day mortality | |||||||
| MELD | 0.86 | 0.062 | 0.73–0.98 | 0.50 | 0.88 | 0.50 | 0.88 |
| DF | 0.84 | 0.054 | 0.73–0.94 | 1.00 | 0.51 | 0.33 | 1.00 |
| GAHS | 0.79 | 0.061 | 0.67–0.91 | 0.64 | 0.74 | 0.37 | 0.89 |
| ABIC | 0.75 | 0.077 | 0.58–0.88 | 0.79/0.29 | 0.49/0.95 | 0.28/0.57 | 0.90/0.57 |
| MELD-Na | 0.83 | 0.068 | 0.69–0.96 | 0.36 | 0.91 | 0.50 | 0.85 |
| UKELD | 0.77 | 0.084 | 0.60–0.93 | 0.57 | 0.72 | 0.33 | 0.87 |
AUROC, area under the receiver operating characteristics curve; Std. err, standard error; CI, confidence interval; PPV, positive predictive value; NPV, negative predictive value; MELD, model for end-stage liver disease; DF, Maddrey discriminant function; GAHS, Glascow alcoholic hepatitis score; ABIC, age, bilirubin, international normalised ratio and creatinine score; MELD-Na, modified MELD including sodium; UKELD, United Kingdom model for end-stage liver disease.
Cut-off values used: MELD: 21, DF: 32, GAHS: 9, ABIC: 6.71/9, MELD-Na: 28, UKELD: 56.
Models proposed to assess corticosteroid responsiveness
Calculation of the ECBL, a fall in serum bilirubin by 25% and the Lille score was possible for 31 of 34 patients with severe AH (admission DF ≥32) receiving corticosteroids; two patients died before day 7 of corticosteroids, whereas an additional patient did not have all the required biochemical data. Comparisons in biochemical and clinical parameters between corticosteroid-treated patients who survived and those who died (six patients by day 30 and eight patients by day 90) are shown in Table 4. After 1 week of corticosteroids, 14 (45.2%) patients had a 25% fall in bilirubin from baseline, 22 (71%) had an ECBL, and 22 (71%) achieved a Lille response using the proposed cut-point of 0.45. The AUROC analysis and operational characteristics of the three models with respect to 30- and 90-day mortality are shown in Figure 2. Overall, no statistically significant differences were found in AUROC comparisons between the different models relative to either a 30- and 90-day outcome. Notably, a good response to corticosteroids according to all three criteria yielded an excellent NPV for excluding short-term mortality (>85%), whereas the PPVs were substantially lower, in all cases <60%.
Table 4.
Clinical and biochemical parameters used for the calculation of the Lille score in patients with severe alcoholic hepatitis (admission Maddrey ≥32) treated with corticosteroids (n = 31). Comparisons regard patients who survived at 30- and 90-days and those who died. Quantitative variables are given as medians (range)
| Variable | 30-day survivors (n = 25) | 30-day nonsurvivors (n = 6) | P-value | 90-day survivors (n = 23) | 90-day nonsurvivors (n = 8) | P-value |
|---|---|---|---|---|---|---|
| Age (years) | 49 (26–59) | 50 (30–54) | 0.88 | 49 (26–59) | 49 (26–59) | 0.96 |
| Male gender n (%) | 21 (84) | 3 (50) | 0.11 | 19 (82.6) | 5 (62.5) | 0.33 |
| Bilirubin-day 0 (μmol/L) | 328 (87–786) | 397 (176–647) | 0.63 | 318 (87–768) | 456.5 (176–647) | 0.31 |
| Bilirubin-day 7 (μmol/L) | 209 (45–768) | 368 (175–851) | 0.09 | 202 (45–768) | 427.5 (175–851) | 0.03 |
| ΔBilirubin (μmol/L) | 64 (−117–286) | −31.5 (−204–87) | 0.03 | 64 (−117–286) | −31.5 (−204–129) | 0.03 |
| Albumin (g/L) | 30 (18–41) | 28.5 (20–36) | 0.25 | 30 (18–41) | 28.5 (20–36) | 0.25 |
| Creatinine (μmol/L) | 53 (29–209) | 103.5 (26–267) | 0.05 | 52 (29–209) | 90 (26–267) | 0.03 |
| Prothrombin time (s) | 23 (18.7–35.6) | 26 (18.3–50.5) | 0.09 | 23.8 (18.7–35.6) | 23.5 (18.3–50.5) | 0.23 |
| INR | 2 (1.4–3.1) | 2.25 (1.4–4.7) | 0.12 | 2 (1.4–3.1) | 2.15 (1.4–4.7) | 0.16 |
| Lille score | 0.14 (0.01–0.91) | 0.75 (0.18–0.99) | 0.02 | 0.09 (0.01–0.91) | 0.75 (0.14–0.99) | 0.009 |
Figure 2.

AUROC analysis and operational characteristics for three different indicators of response to corticosteroid treatment, used to predict 30-day (a) and 90-day (b) mortality.
Discussion
The present study is an external evaluation of nine prognostic models of AH using a 100% biopsy-proven cohort, including the first disease-specific assessment of the UKELD used for prioritizing liver recipients in UK.33 Overall, MELD, DF, GAHS and the ABIC proved to be clinically useful scores, performing comparably and with an acceptable accuracy (AUROCs exceeding 0.70) for both 30- and 90-day mortality. Our findings are congruent with those of previous validation studies in which, however, diagnosis of AH was based solely on clinical grounds. In a Danish study including 274 patients, MELD, MELD-Na, GAHS, Lille score and the ABIC also performed comparably in predicting 28-, 84- and 180-day mortality.30 Similarly, in another study, MELD, DF, ABIC and GAHS performed equally in predicting short-term (30- and 90-day) survival, although all models were uniformly poor in predicting longer-term (6-month and 1-year) outcome.34 In a prospective comparison of 182 patients, DF, GAHS, MELD and ABIC performed well with no statistically significant difference for either 28 or 90 days mortality after admission.35 We observed a tendency towards better prognostic accuracies with respect to 90-day mortality (90-days AUROCs: 0.68–0.86 vs. 30-days AUROCs: 0.56–0.79), and when assessment of prognosis was repeated 1 week from admission (90-days AUROCs: 0.75–0.86 and 30 day AUROCs: 0.69–0.85). This is consistent with previous observations on the utility of repeated scoring, 6–9 days from hospital admission.13,17,30,31
DF was developed several decades ago based on patient cohorts that might have had different supportive care than in current patients. Our study, in agreement with previous observations, indicates an inadequate specificity (<40%) for mortality of DF: 39/49 (79.6%) of patients with DF ≥32 were alive by day 30 and 35/49 (71.4%) by day 90. Obsolescence of the cut-point of 32 may account, at least partially, for the inaccuracy of DF, and higher cut-offs have been proposed: 37 in the study by Dunn et al.,16 and 42 in the study by Sheth et al.15 Optimal cut-off within our cohort corresponds to 44, although even by using this value, specificity of DF would be still less than 60%. This inaccuracy of DF has been suggested as the basis of the long-standing debate on the efficacy of corticosteroid treatment.13 Moreover, poor standardisation of PT across different laboratories represents another limitation affecting the reproducibility of this index.36
Previous studies15–17 have proposed use of MELD as an alternative model, more specific for mortality, as compared to DF. As well as INR which has problems in reproducibility of measurement,36 MELD includes creatinine, a relevant prognostic indicator in AH, but which measurement in a context of hyper-bilirubinemia is also problematic.37 Our data, consistent with these older reports, shows sensitivity/specificity of 0.80/0.79 (30-days) and 0.86/0.84 (90-days) for the MELD vs. 1.00/0.36 (30-days) and 1.00/0.39 (90-days) for the DF. In a study by Srikureja et al., 1-week MELD has been shown to be more accurate, as compared to admission MELD, for the prediction of in-hospital mortality.17 Our results are further validating this observation with respect to both the prediction of 30-day (AUROC: 0.84 for 1 week MELD vs. 0.79 for admission MELD) and 90-day risk of death (AUROC: 0.86 for 1 week MELD vs. 0.84 for admission MELD). However, in contrast to this last study, we could not identify any advantage in 1-week re-testing of MELD over DF, as re-calculation of the DF 1 week from admission also yielded excellent prognostic accuracies (AUROC >0.80), comparable to those obtained by recalculating MELD. Disease-specific calibration of MELD is an issue: in our cohort the optimal cut-off value was 21, similarl to the study by Dunn et al.16 However, lower thresholds such as 11 reported by Sheth et al.15 and 18 reported by Shrikureja et al.17 have been proposed, probably reflecting differences in the grade of severity of disease between different cohorts. Neither MELD-Na nor UKELD, both modifications of MELD incorporating sodium, were prognostically superior to classical MELD within our cohort. Previously, MELD-Na was shown a stronger predictor of 180-day mortality (vs. MELD) when patients with clinically diagnosed AH and ascites were considered. However, the small sample size in this study (26 patients, 13 with ascites) precludes definitive conclusions.18
GAHS and ABIC are disease-specific formulas which also include creatinine14,20 but are easier to calculate at the bedside in comparison to MELD. The ABIC score includes similar parameters as the MELD score, except for patient's age, whereas GAHS is the only index to consider an inflammatory parameter (white cell count) (Table 1). Although GAHS and ABIC have been shown to perform significantly better than DF within their internal validation cohorts, our results suggest comparable predictive accuracies of these three models. In a head to head comparison of GAHS and ABIC using 181 patients from the GAHS validation cohort, the two models also performed equally.31 ABIC is a dual cut-off model which generates a trichotomous classification into low, intermediate and high risk of death.14 Critically, such ability was questioned in a recent study in which the 3 stages did not result in differences in 90-day outcomes between the ‘low’ and ‘intermediate’ groups, although there was a clearly worse outcome in those with ABIC >9.35 Unfortunately, the relatively small number of events precluded us from undertaking a similar analysis.
The Lille score is a combination of six reproducible variables including a dynamic one, i.e. the evolution in bilirubin following 1 week of corticosteroid treatment.19 Within our biopsy-proven cohort, use of the Lille model proved an accurate predictor of both 30- and 90-day outcome (AUROC 0.81/0.82). However, our data do not justify its complexity over the much easier bedside calculation of ECBL and 25% fall in bilirubin, both performing with an acceptable grade of accuracy within our cohort (AUROC 0.72–0.78). Our findings are congruent with those of a recent prospective assessment, in which, however, diagnosis of AH relied solely on clinical criteria.35 As availability of 7-day biochemical data are necessary in order to calculate the Lille score, it is interesting to note that re-calculation at 7 days of either the MELD or DF, also provided excellent predictive accuracies (AUROCs >0.80).However, their dynamic evolution (i.e. ΔΜELD and ΔDF) has been reported to have less prognostic power in comparison with changes in Lille score.19 Thus, the Lille model represents the best currently validated dynamic criterion for the assessment of mortality in AH, and the only one linked to specific stopping rules for corticosteroid management: in poor responders (Lille >0.45) discontinuation of corticosteroids is recommended,19 particularly when Lille >0.56 (i.e. considered null responders).4,10
Importantly, all prognostic models and in particular DF, MELD, GAHS, ABIC and the Lille score showed excellent NPV, in most cases exceeding 90%. This is in contrast with PPV which were low, in most instances lower than 50% (Table 3). This finding suggests that the paradigm in clinical decision making and the designation of clinical trials targeting specific treatments in AH, should be to exclude low-risk patients, rather than to identify those with high death risk, using these models. Clearly, some patients identified at high risk may receive futile treatment but evaluating different thresholds or different weighting or new variables may refine prognosis.
The present study has limitations. We did not perform a sample size calculation, and our study cohort was based on the available patients but it does reflect a 4-year single-centre experience of histologically diagnosed AH. Therefore, although our sample size is comparable16 and more than double15 than that of previous publications, our study may be underpowered to detect a significant difference in the predictive performances between models. This is more likely to be true in the analysis of the Lille score and its variants, which was restricted to 31 patients receiving corticosteroids. Treatment with corticosteroids may have led in underestimation of the predictive ability of general prognostic scores, although a survival benefit conferred by this treatment remains in some dispute8,9 and corticosteroid-treated patients have been previously included for the development and/or validation of the models.14,16 Despite adjustment for confounding variables there was no demonstrable corticosteroid effect on survival, which is unsurprising, considering that our study was not designed nor powered to detect a therapeutic effect. However, this may indicate that treatment effects are not a significant source for biassing predictive performances in the present study. Transjugular liver biopsy23 is routinely performed in our institution whenever AH is suspected. Although inclusion of less severe cases by this institutional policy (and thus changes in predictive accuracies of the models) could be possible, the admission MELD in our series is comparable to that of other cohorts in which diagnosis of AH relied solely on clinical criteria.16,30 Congruently, the 30- and 90-day mortality in our cohort was 14.1% and 17.9% respectively, which is consistent with previous studies reporting short-term mortality ranging to 14.4–27%.15–17,30
In conclusion, the negative predictive values of MELD, DF, GAHS and the ABIC as well as those of three different scores to assess corticosteroid response, proved to be valid for prognostication when assessed in an independent cohort of patients with biopsy-proven AH. In our series, both MELD-Na and UKELD did not confer any prognostic advantage in comparison with classical MELD. The choice of prognostic model thus depends on other factors including ease of use, routine use of corticosteroids according to institutional practice and the personal preferences of the treating physician. However, there is still room for further refinement, and efforts for improved prognostic models should continue, as there is increasing need for accurate prognostic stratification in AH, particularly with the possibility of early liver transplantation.35,38 Thus, it is important currently to rely on response criteria to corticosteroids, or non-improvement at 7-days if liver transplantation is considered, as the PPV of all models is insufficient to establish a poor prognosis at admission.
Authorship
Guarantor of the article: Andrew K. Burroughs.
Author contributions: VP, GP, ET, AD, SB, TVL collected data. VP, EAT, AKB designed the study and review each draft of the publication. VP performed statistical analyses and wrote the manuscript. VP, EAT, GP, SK, JOB, DP, DT contributed to interpretation and analyses of data. SK, TVL, JOB, DP, DT, AKB critically revised the article for important intellectual content. All authors approved the final version of the manuscript.
Acknowledgments
VP and ET gratefully acknowledge the Hellenic Association for the Study of the Liver for receiving an education support grant.
Declaration of personal and funding interests: None.
SUPPORTING INFORMATION
Additional Supporting Information may be found in the online version of this article:
Scatter plots of admission score values for prognostic scores in alcoholic hepatitis correlated with 30- (a) and 90-day (b) mortality.
References
- 1.Menon KV, Gores GJ, Shah VH. Pathogenesis, diagnosis, and treatment of alcoholic liver disease. Mayo Clin Proc. 2001;76:1021–9. doi: 10.4065/76.10.1021. [DOI] [PubMed] [Google Scholar]
- 2.Morgan TR. Treatment of alcoholic hepatitis. Semin Liver Dis. 1993;13:384–94. doi: 10.1055/s-2007-1007367. [DOI] [PubMed] [Google Scholar]
- 3.Cohen SM, Ahn J. Review article: the diagnosis and management of alcoholic hepatitis. Aliment Pharmacol Ther. 2009;30:3–13. doi: 10.1111/j.1365-2036.2009.04002.x. [DOI] [PubMed] [Google Scholar]
- 4.European Association for the Study of the Liver. EASL Clinical Practical Guidelines: management of Alcoholic Liver Disease. J Hepatol. 2012;57:399–420. doi: 10.1016/j.jhep.2012.04.004. [DOI] [PubMed] [Google Scholar]
- 5.Nguyen-Khac E, Thevenot T, Piquet MA, et al. Glucocorticoids plus N-acetylcysteine in severe alcoholic hepatitis. N Engl J Med. 2011;365:1781–9. doi: 10.1056/NEJMoa1101214. [DOI] [PubMed] [Google Scholar]
- 6.Parker R, Armstrong MJ, Corbett C, Rowe IA, Houlihan DD. Systematic review: pentoxifylline for the treatment of severe alcoholic hepatitis. Aliment Pharmacol Ther. 2013;37:845–54. doi: 10.1111/apt.12279. [DOI] [PubMed] [Google Scholar]
- 7.O'Shea R, McCullough AJ. Steroids or cocktails for alcoholic hepatitis. J Hepatol. 2006;44:633–6. doi: 10.1016/j.jhep.2006.01.011. [DOI] [PubMed] [Google Scholar]
- 8.Christensen E, Gluud C. Glucocorticoids are ineffective in alcoholic hepatitis: a meta-analysis adjusting for confounding variables. Gut. 1995;37:113–8. doi: 10.1136/gut.37.1.113. [DOI] [PMC free article] [PubMed] [Google Scholar]
- 9.Rambaldi A, Saconato HH, Christensen E, Thorlund K, Wetterslev J, Gluud C. Systematic review: glucocorticosteroids for alcoholic hepatitis–a Cochrane Hepato-Biliary Group systematic review with meta-analyses and trial sequential analyses of randomized clinical trials. Aliment Pharmacol Ther. 2008;27:1167–78. doi: 10.1111/j.1365-2036.2008.03685.x. [DOI] [PubMed] [Google Scholar]
- 10.Mathurin P, O'Grady J, Carithers RL, et al. Corticosteroids improve short-term survival in patients with severe alcoholic hepatitis: meta-analysis of individual patient data. Gut. 2011;60:255–60. doi: 10.1136/gut.2010.224097. [DOI] [PubMed] [Google Scholar]
- 11.Forrest E, Mellor J, Stanton L, et al. Steroids or pentoxifylline for alcoholic hepatitis (STOPAH): study protocol for a randomised controlled trial. Trials. 2013;14:262. doi: 10.1186/1745-6215-14-262. [DOI] [PMC free article] [PubMed] [Google Scholar]
- 12.Maddrey WC, Boitnott JK, Bedine MS, Weber FL, Jr, Mezey E, White RI., Jr Corticosteroid therapy of alcoholic hepatitis. Gastroenterology. 1978;75:193–9. [PubMed] [Google Scholar]
- 13.Forrest EH, Evans CD, Stewart S, et al. Analysis of factors predictive of mortality in alcoholic hepatitis and derivation and validation of the Glasgow alcoholic hepatitis score. Gut. 2005;54:1174–9. doi: 10.1136/gut.2004.050781. [DOI] [PMC free article] [PubMed] [Google Scholar]
- 14.Dominguez M, Rincon D, Abraldes JG, et al. A new scoring system for prognostic stratification of patients with alcoholic hepatitis. Am J Gastroenterol. 2008;103:2747–56. doi: 10.1111/j.1572-0241.2008.02104.x. [DOI] [PubMed] [Google Scholar]
- 15.Sheth M, Riggs M, Patel T. Utility of the mayo end-stage liver disease (MELD) score in assessing prognosis of patients with alcoholic hepatitis. BMC Gastroenterol. 2002;2:2. doi: 10.1186/1471-230X-2-2. [DOI] [PMC free article] [PubMed] [Google Scholar]
- 16.Dunn W, Jamil LH, Brown LS, et al. MELD accurately predicts mortality in patients with alcoholic hepatitis. Hepatology. 2005;41:353–8. doi: 10.1002/hep.20503. [DOI] [PubMed] [Google Scholar]
- 17.Srikureja W, Kyulo NL, Runyon BA, Hu KQ. MELD score is a better prognostic model than Child-Turcotte-Pugh score or Discriminant Function score in patients with alcoholic hepatitis. J Hepatol. 2005;42:700–6. doi: 10.1016/j.jhep.2004.12.022. [DOI] [PubMed] [Google Scholar]
- 18.Vaa BE, Asrani SK, Dunn W, Kamath PS, Shah VH. Influence of serum sodium on MELD-based survival prediction in alcoholic hepatitis. Mayo Clin Proc. 2011;86:37–42. doi: 10.4065/mcp.2010.0281. [DOI] [PMC free article] [PubMed] [Google Scholar]
- 19.Louvet A, Naveau S, Abdelnour M, et al. The Lille model: a new tool for therapeutic strategy in patients with severe alcoholic hepatitis treated with steroids. Hepatology. 2007;45:1348–54. doi: 10.1002/hep.21607. [DOI] [PubMed] [Google Scholar]
- 20.Forrest EH, Morris AJ, Stewart S, et al. The Glasgow alcoholic hepatitis score identifies patients who may benefit from corticosteroids. Gut. 2007;56:1743–6. doi: 10.1136/gut.2006.099226. [DOI] [PMC free article] [PubMed] [Google Scholar]
- 21.Mathurin P, Abdelnour M, Ramond MJ, et al. Early change in bilirubin levels is an important prognostic factor in severe alcoholic hepatitis treated with prednisolone. Hepatology. 2003;38:1363–9. doi: 10.1016/j.hep.2003.09.038. [DOI] [PubMed] [Google Scholar]
- 22.Morris JM, Forrest EH. Bilirubin response to corticosteroids in severe alcoholic hepatitis. Eur J Gastroenterol Hepatol. 2005;17:759–62. doi: 10.1097/00042737-200507000-00011. [DOI] [PubMed] [Google Scholar]
- 23.Kalambokis G, Manousou P, Vibhakorn S, et al. Transjugular liver biopsy–indications, adequacy, quality of specimens, and complications–a systematic review. J Hepatol. 2007;47:284–94. doi: 10.1016/j.jhep.2007.05.001. [DOI] [PubMed] [Google Scholar]
- 24.Kryger P, Schlichting P, Dietrichson O, Juhl E. The accuracy of the clinical diagnosis in acute hepatitis and alcoholic liver disease. Clinical versus morphological diagnosis. Scand J Gastroenterol. 1983;18:691–6. doi: 10.3109/00365528309181659. [DOI] [PubMed] [Google Scholar]
- 25.Mookerjee RP, Lackner C, Stauber R, et al. The role of liver biopsy in the diagnosis and prognosis of patients with acute deterioration of alcoholic cirrhosis. J Hepatol. 2011;55:1103–11. doi: 10.1016/j.jhep.2011.02.021. [DOI] [PubMed] [Google Scholar]
- 26.Ramond MJ, Poynard T, Rueff B, et al. A randomized trial of prednisolone in patients with severe alcoholic hepatitis. N Engl J Med. 1992;326:507–12. doi: 10.1056/NEJM199202203260802. [DOI] [PubMed] [Google Scholar]
- 27.Kamath PS, Wiesner RH, Malinchoc M, et al. A model to predict survival in patients with end-stage liver disease. Hepatology. 2001;33:464–70. doi: 10.1053/jhep.2001.22172. [DOI] [PubMed] [Google Scholar]
- 28.Kim WR, Biggins SW, Kremers WK, et al. Hyponatremia and mortality among patients on the liver-transplant waiting list. N Engl J Med. 2008;359:1018–26. doi: 10.1056/NEJMoa0801209. [DOI] [PMC free article] [PubMed] [Google Scholar]
- 29.Barber K, Pioli S, Blackwell J. Development of a UK score for patients with end-stage liver disease. Hepatology. 2007;46:510A. [Google Scholar]
- 30.Sandahl TD, Jepsen P, Ott P, Vilstrup H. Validation of prognostic scores for clinical use in patients with alcoholic hepatitis. Scand J Gastroenterol. 2011;46:1127–32. doi: 10.3109/00365521.2011.587200. [DOI] [PubMed] [Google Scholar]
- 31.Forrest EH, Fisher NC, Singhal S, et al. Comparison of the Glasgow alcoholic hepatitis score and the ABIC score for the assessment of alcoholic hepatitis. Am J Gastroenterol. 2010;105:701–2. doi: 10.1038/ajg.2009.645. [DOI] [PubMed] [Google Scholar]
- 32.Hanley JA, McNeil BJ. A method of comparing the areas under receiver operating characteristic curves derived from the same cases. Radiology. 1983;148:839–43. doi: 10.1148/radiology.148.3.6878708. [DOI] [PubMed] [Google Scholar]
- 33.Neuberger J, Gimson A, Davies M, et al. Selection of patients for liver transplantation and allocation of donated livers in the UK. Gut. 2008;57:252–7. doi: 10.1136/gut.2007.131730. [DOI] [PubMed] [Google Scholar]
- 34.Palaniyappan N, Subramanian V, Ramappa V, Ryder SD, Kaye P, Aithal GP. The utility of scoring systems in predicting early and late mortality in alcoholic hepatitis: whose score is it anyway? Int J Hepatol. 2012;2012:624675. doi: 10.1155/2012/624675. [DOI] [PMC free article] [PubMed] [Google Scholar]
- 35.Lafferty H, Stanley AJ, Forrest EH. The management of alcoholic hepatitis: a prospective comparison of scoring systems. Aliment Pharmacol Ther. 2013;38:603–10. doi: 10.1111/apt.12414. [DOI] [PubMed] [Google Scholar]
- 36.Tripodi A, Caldwell SH, Hoffman M, Trotter JF, Sanyal AJ. Review article: the prothrombin time test as a measure of bleeding risk and prognosis in liver disease. Aliment Pharmacol Ther. 2007;26:141–8. doi: 10.1111/j.1365-2036.2007.03369.x. [DOI] [PubMed] [Google Scholar]
- 37.Lolekha PH, Sritong N. Comparison of techniques for minimizing interference of bilirubin on serum creatinine determined by the kinetic Jaffe reaction. J Clin Lab Anal. 1994;8:391–9. doi: 10.1002/jcla.1860080609. [DOI] [PubMed] [Google Scholar]
- 38.Burroughs AK. Liver transplantation for severe alcoholic hepatitis saves lives. J Hepatol. 2012;57:451–2. doi: 10.1016/j.jhep.2012.01.003. [DOI] [PubMed] [Google Scholar]
Associated Data
This section collects any data citations, data availability statements, or supplementary materials included in this article.
Supplementary Materials
Scatter plots of admission score values for prognostic scores in alcoholic hepatitis correlated with 30- (a) and 90-day (b) mortality.